Personalize this lesson
Adapt explanations and teaching visuals to your background and preferred voice.
Imagine an inference trace with short CUDA operations separated by gaps. The GPU finishes an operation before the host submits the next one. Optimizing the math inside that operation won't remove the gap. First find out whether submission is the limiting resource.
LLM decoding can issue normalization, projections, rotary embeddings, attention, and activation operations. Fusion, model architecture, batch size, and the backend change their count and duration. A large projection can take substantial device time. Measure the costs for the actual execution path.
If the host repeatedly supplies work more slowly than the device consumes it, its queue can drain and expose submission gaps. This is one possible GPU bottleneck, alongside long kernels, dependencies, communication, and other queued work. A profiler trace should establish which resource is waiting.
Why can a GPU appear underutilized even when running an inference service at 100% CPU load?
Answer
One possibility is slow host submission: the device runs out of ready work between operations. CPU load alone doesn't establish this cause. Check the CPU API timeline and device gaps, including other streams and communication.
To master this boundary, we follow a four-operation pipeline from a CPU simulation into a PyTorch CUDA benchmark:
- Copy input values into a working buffer.
- Affine transform: compute .
- Square: compute each value's square .
- Reduce: sum the elements down to a single scalar.
On toy integer inputs [1, 2, 3, 4], the affine step yields [3, 5, 7, 9], the square step yields [9, 25, 49, 81], and the final reduction sums to 164.
The host can submit all four operations and return while the device is still processing earlier work. Bugs appear when submission is mistaken for completion, streams access the same buffer without the required dependency, or graph inputs no longer match captured pointers. Here “shared buffer” means an allocation accessed by several operations, not CUDA's block-local shared-memory address space.
Two clocks describe one execution
Host submission and device completion are separate observations. CUDA kernel launches are asynchronous with respect to the host. Memory-copy behavior also depends on the API, direction, and memory involved, and even an asynchronous API can block because of resource contention. A stream expresses issue-order dependencies; it isn't a promise about a particular physical hardware queue.[1][2]
We can model the public submission contract as two paths: the host continues after submission, and the device executes work when dependencies and resources permit.
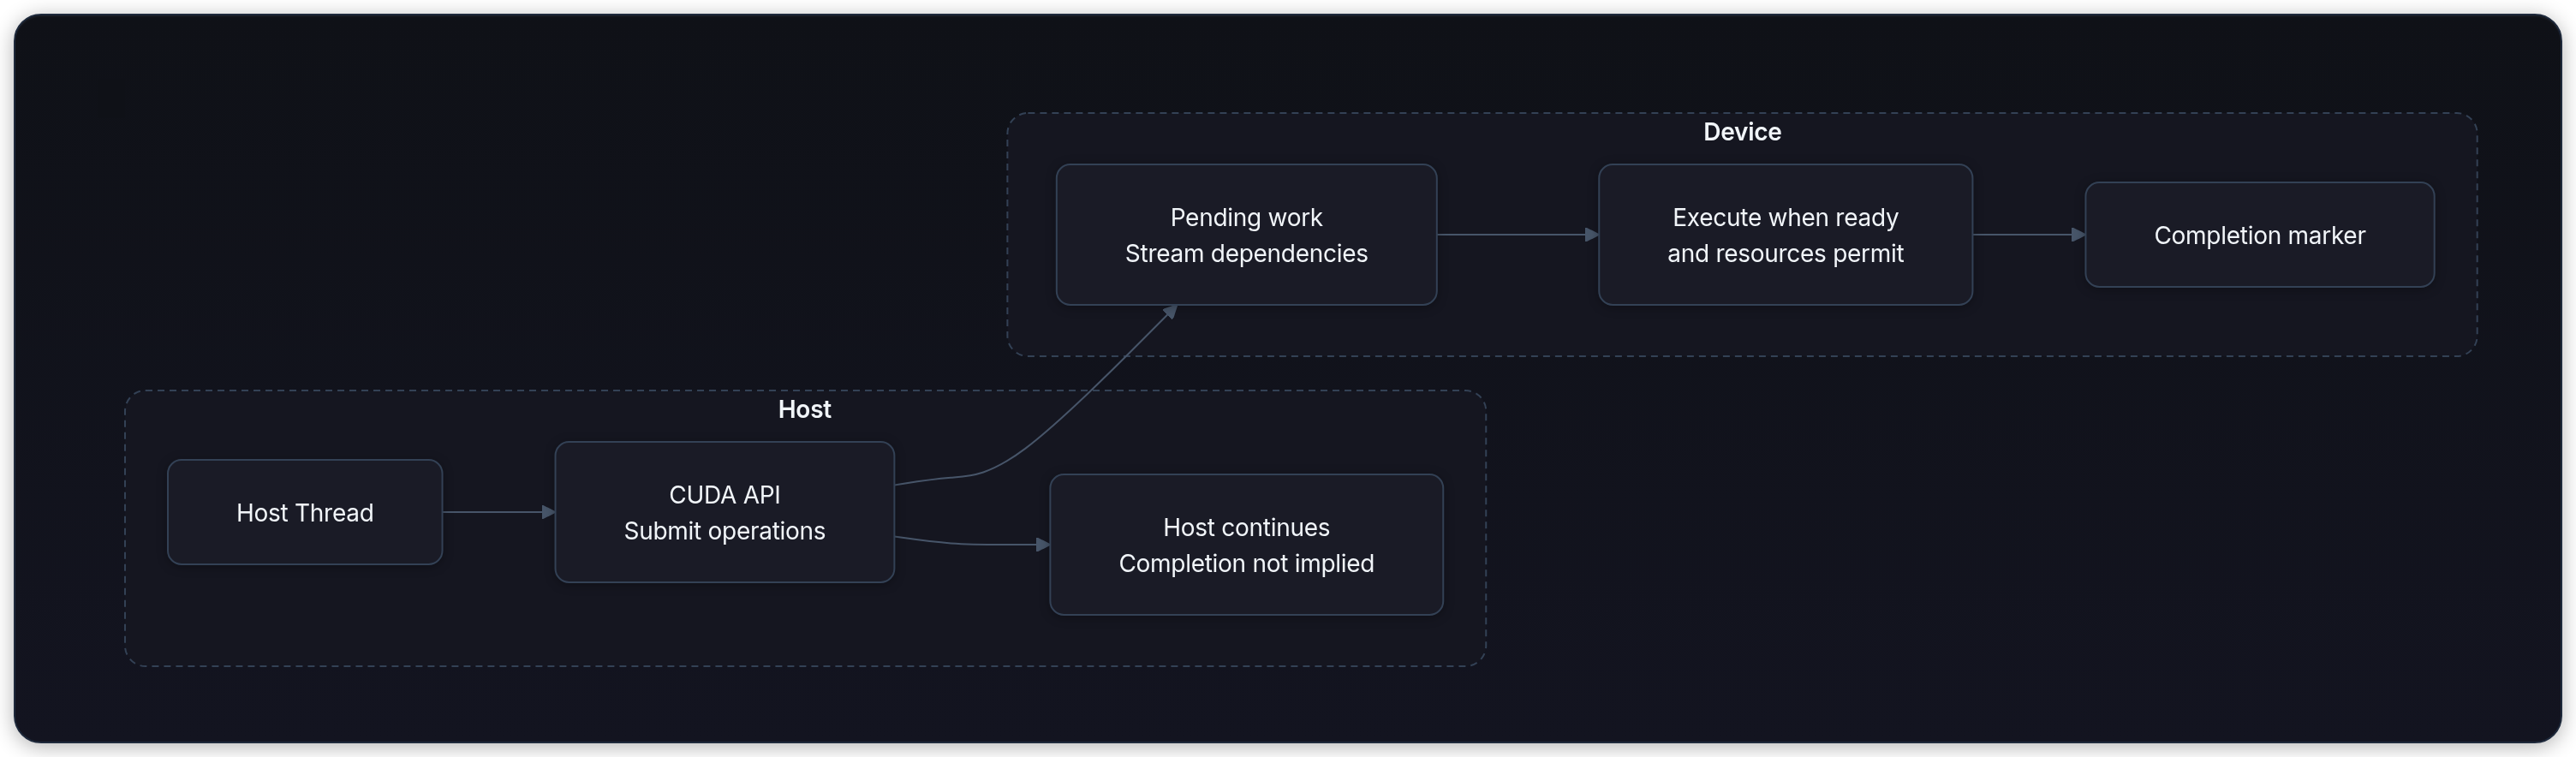
Interpret each observation within its scope:
| Observation | What it proves | What it doesn't prove |
|---|---|---|
| Successful host launch call returns | Submission returned without a reported error | Kernel finished successfully or output is ready; some errors surface later |
| Recorded event completes | Preceding work in that stream reached the marker | Work in other streams has finished |
| Successful stream synchronization returns | All prior commands in that specific stream completed | Other device streams or engines are idle |
| Successful device synchronization returns | Previously submitted work in the relevant CUDA context completed | Other processes' contexts are idle, or this benchmark excluded setup/allocation/JIT |
Output buffer equals 164 | The fixture produced the expected value for this run | Work submission is free of data races across varying timings |
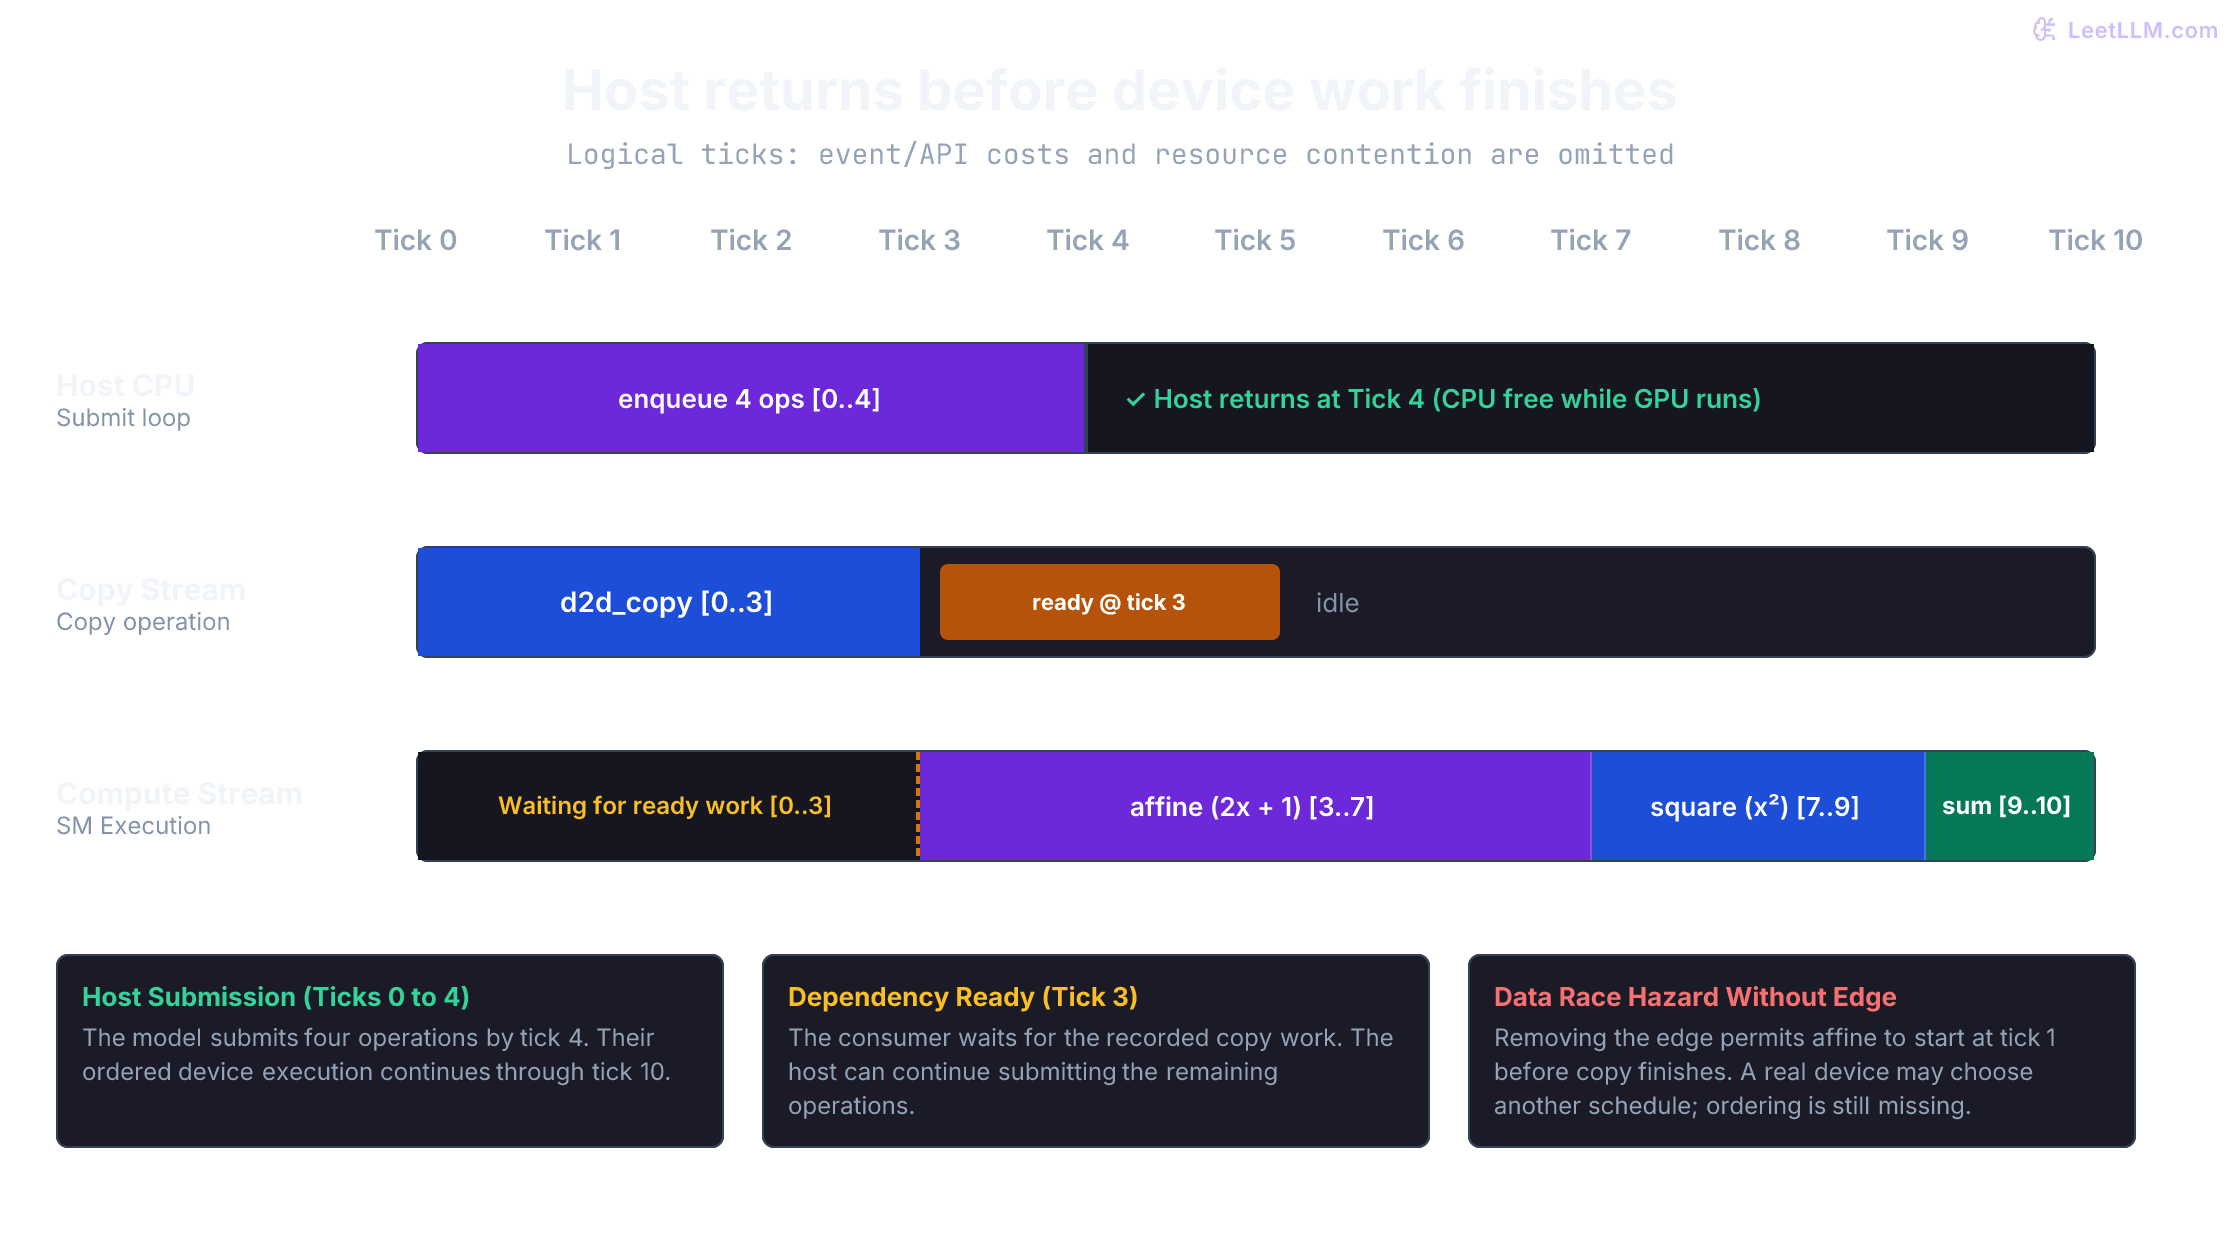
To visualize this asynchronous separation, consider a logical issue-order simulation. Each host submission costs one tick: the CPU submits operations at ticks 0, 1, 2, and 3, and returns to user code at tick 4. Device operations run on their own schedule, waiting for host submission, preceding stream tasks, and cross-stream dependencies. You can download the complete runtime submission simulation script.
from dataclasses import dataclass

@dataclass(frozen=True)
class Operation:
    name: str
    stream: str
    duration: int
    waits_for: tuple[str, ...] = ()

def schedule(operations: list[Operation]) -> dict[str, tuple[int, int]]:
    stream_ready: dict[str, int] = {}
    times: dict[str, tuple[int, int]] = {}
    for issue_tick, op in enumerate(operations):
        if not op.name or not op.stream or op.name in times:
            raise ValueError("operation names must be unique and streams nonempty")
        if type(op.duration) is not int or op.duration <= 0:
            raise ValueError("durations must be positive integer ticks")
        if any(name not in times for name in op.waits_for):
            raise ValueError("dependencies must name earlier submitted operations")
        ready = max((times[name][1] for name in op.waits_for), default=0)
        start = max(issue_tick, stream_ready.get(op.stream, 0), ready)
        times[op.name] = (start, start + op.duration)
        stream_ready[op.stream] = start + op.duration
    return times

operations = [
    Operation("copy", "copy", 3),
    Operation("affine", "compute", 4, ("copy",)),
    Operation("square", "compute", 2),
    Operation("reduce", "compute", 1),
]
times = schedule(operations)
print(f"host_return_tick={len(operations)}")
for op in operations:
    start, end = times[op.name]
    print(f"{op.name} stream={op.stream} start={start} end={end}")
print(f"device_complete_tick={max(end for _, end in times.values())}")
print(f"result={sum((2*x+1)**2 for x in [1, 2, 3, 4])}")
unsafe = schedule([operations[0], Operation("affine", "compute", 4),
                   *operations[2:]])
print(f"without_event_read_before_copy_done={unsafe['affine'][0] < unsafe['copy'][1]}")
assert times["affine"][0] >= times["copy"][1]
assert times["reduce"][1] == 10host_return_tick=4
copy stream=copy start=0 end=3
affine stream=compute start=3 end=7
square stream=compute start=7 end=9
reduce stream=compute start=9 end=10
device_complete_tick=10
result=164
without_event_read_before_copy_done=TrueThe simulated host returns at tick 4, and device work finishes at tick 10. Removing the dependency permits affine to start at tick 1 before copy completes. This demonstrates a missing ordering guarantee, not a prediction of a real GPU's schedule or corrupted value. Square and reduce already follow affine in the same stream. Event/API overhead and resource contention aren't modeled.
Stream semantics and synchronization
Commands submitted to a single CUDA stream execute strictly in issue order. Commands in different streams can execute concurrently or in any interleaved order unless an explicit dependency binds them. Having distinct streams grants permission to overlap; it doesn't guarantee that the hardware has the capacity to execute them concurrently.[2]
The legacy default stream trap
Default-stream behavior is configured per compilation unit. Distinguish these cases, and don't infer a framework's stream flags from raw CUDA defaults:[3]
-
The Legacy Default Stream (NULL stream): Under legacy semantics, stream 0 synchronizes with blocking streams in the same CUDA context. Previously issued blocking-stream work precedes the legacy operation, and subsequent blocking-stream work waits for it. This doesn't synchronize independent processes' contexts or streams created with
cudaStreamNonBlocking. -
Non-Blocking Streams (
cudaStreamNonBlocking): Created viacudaStreamCreateWithFlags(&stream, cudaStreamNonBlocking). These opt out of the legacy stream's implicit synchronization. They can still wait because of explicit events, data dependencies, or unavailable hardware resources. “Non-blocking” doesn't guarantee concurrency. -
Per-Thread Default Streams:
--default-stream per-threadselects a default stream local to the thread and context;cudaStreamPerThreadnames it explicitly. It behaves like a normal explicitly created stream. It is not a non-blocking stream and synchronizes with the legacy stream if both are used.
Why can an unadorned cudaMemcpy call in one thread stall independent worker streams running in another thread?
Answer
If that compilation unit uses legacy default-stream semantics, the copy introduces ordering with blocking streams in the same context. Non-blocking streams are exempt. Copy direction and host-memory type separately determine whether the host call waits; stream synchronization and host blocking aren't the same property.
Cross-stream coordination via events
To coordinate producer and consumer streams without blocking the host CPU, use CUDA events:
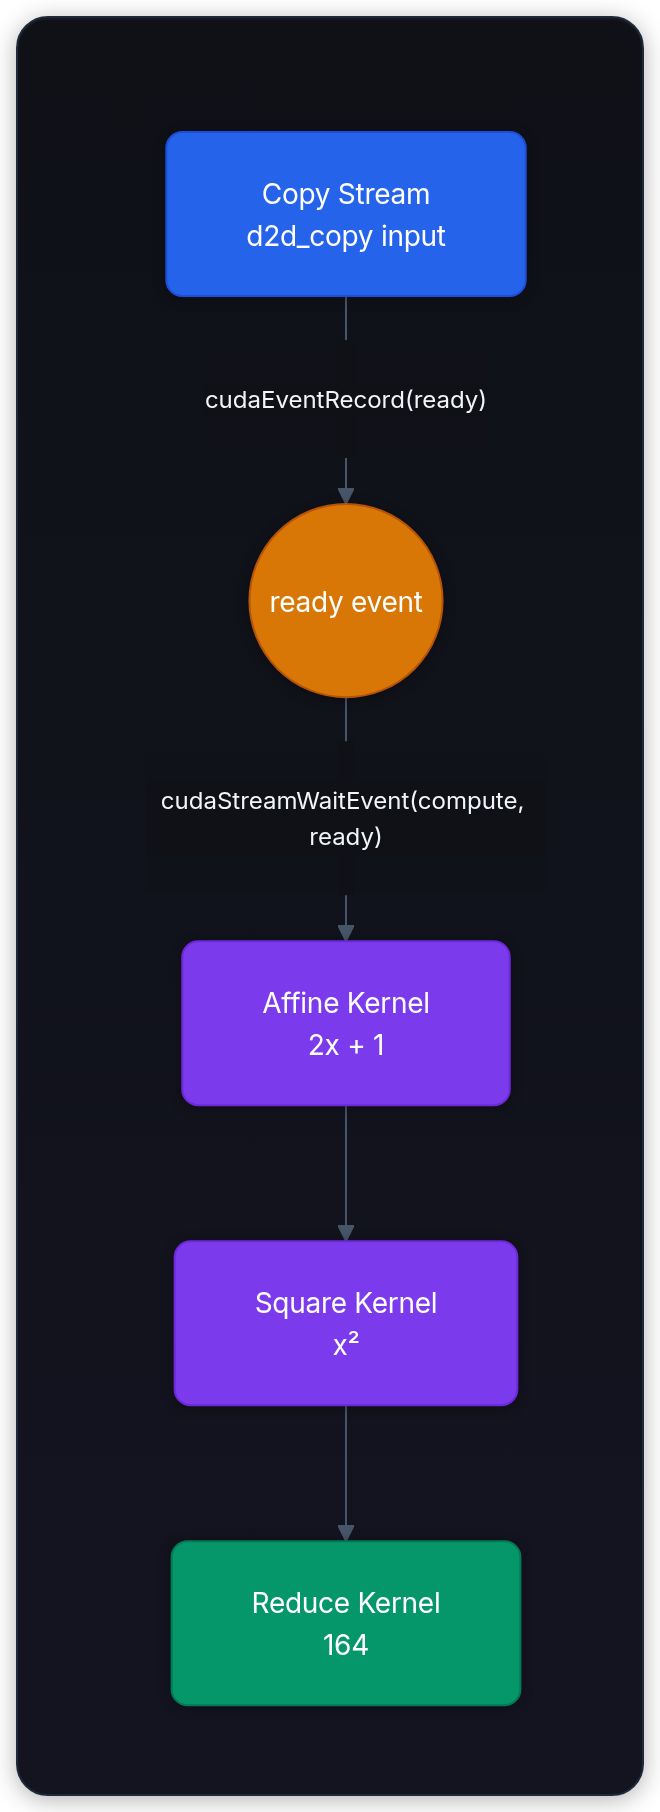
The synchronization sequence relies on two runtime calls:
cudaEventRecord(ready, copy_stream)appends an event marker into the copy stream's FIFO queue immediately after the copy command.cudaStreamWaitEvent(compute_stream, ready, 0)enqueues a dependency barrier into the compute stream.
cudaStreamWaitEvent makes future work in the consumer stream wait for the work represented by the event. It provides a stream dependency rather than a host wait for producer completion. Don't assign it a universal sub-0.5-microsecond API duration or assume a hardware token format.[4]
Record before waiting. A newly created, unrecorded event represents empty work, not undefined behavior. A wait observes the event's most recently recorded state at the time of that call; recording it later doesn't retroactively add a dependency. Keep allocations alive until their consumers finish. Pinning applies to host buffers used for suitable asynchronous transfers, not every device allocation. In PyTorch, stream ordering and allocator lifetime can require separate wait_stream and record_stream handling.[4][5]
Overlap requirements
This pipeline's operations depend on one another, so adding streams won't make this one chain parallel. Independent requests can overlap, provided their buffers, ordering, and hardware permit it:
| Overlap Type | Hardware and Software Prerequisites | Common Serialization Bottleneck | Diagnostic Clue |
|---|---|---|---|
| Host-to-device copy with independent kernel | Pinned host memory, asynchronous copy, streams without an ordering barrier, supported copy/compute overlap | Pageable-memory staging may block the host; an implicit or explicit dependency can serialize work | Inspect API duration and copy/kernel overlap |
| Device-to-host copy with independent kernel | Pinned destination, supported transfer path, no dependency between those tasks | Premature synchronization prevents useful overlap | Reading before completion is a data hazard; a raw CPU read doesn't automatically wait |
| Independent kernels | Distinct streams, supported concurrent execution, sufficient resources | One kernel's resource use can prevent another block from becoming resident | Examine launch/resource metrics and the actual trace; occupancy alone isn't proof |
| Next request's transfer with current request's compute | Separate live storage regions and per-slot dependencies, often double buffering | Reusing a region while a reader still uses it creates a hazard | Disjoint ranges within one allocation can suffice |
Check asyncEngineCount for the device's copy/compute-overlap capability. Host delays, resource use, and stream barriers can still prevent overlap. Verify the actual timeline.[2]
Measure enqueue, device work, and completion
Track three overlapping intervals:
- Host submission time: CPU wall-clock duration around the submission loop, measured without any synchronizations inside the timed region.
- Device elapsed time: The duration between two CUDA events recorded before and after the workload in the execution stream, evaluated only after the stop event completes.
- End-to-end time: Host wall-clock duration from the start of submission through the final scoped device synchronization.
Host submission time and device elapsed time overlap. Event elapsed time is the span between two device timestamps, including gaps within those markers. In an assumed trace where a kernel finishes at 3 µs and the next operation starts at 8 µs, that five-microsecond idle interval contributes to an event span surrounding both operations.[4]
Use the earlier logical schedule to check the arithmetic. Assume the start marker completes at tick 0 and the stop marker is submitted after the host loop into the compute stream:
host_span = len(operations)
device_complete = max(end for _, end in times.values())
event_stop = max(host_span, device_complete)
event_span = event_stop  # start marker at tick 0
end_to_end = max(host_span, event_stop)
print(f"host={host_span}, event={event_span}, end_to_end={end_to_end} ticks")
print(f"incorrect addition={host_span + event_span} ticks")
assert end_to_end == 10 and host_span + event_span == 14host=4, event=10, end_to_end=10 ticks
incorrect addition=14 ticksA long submission loop and short kernels suggest host costs worth investigating. Long kernels can reflect compute, memory, synchronization, or contention. Nsight Systems shows CPU APIs alongside device streams and transfers; Nsight Compute examines individual kernels. Establish the cause rather than infer saturation from duration alone.[6][7]
Isolating steady-state performance
A disciplined benchmark isolates initialization from steady-state execution:
- Initialize the CUDA context and runtime libraries before starting timers.
- Pre-allocate all input, workspace, and output tensors.
- Warm up the execution pipeline to trigger just-in-time (JIT) compilation, autotuning, and driver memory bindings.
- Prime timing events: PyTorch initializes underlying handles lazily on their first record or export. Exclude that setup from timing.[8]
- Enforce strict numerical tolerance checks against an FP64 CPU reference before trusting any timing speedup.
| Benchmark Receipt Field | Why It's Mandatory | Rejection Threshold |
|---|---|---|
| GPU model, driver, PyTorch CUDA build, framework version | Features/performance depend on the environment; a build toolkit version isn't a runtime probe | Uncontrolled environment variations |
| Tensor shape, strides, and allocation contract | Workload identity; graph addresses must remain valid | Unnoticed address/lifetime or layout changes |
| Warmup and measurement iterations | Separates cold initialization from steady-state reuse | Zero warmup or single-shot timing |
| Host, device event, and end-to-end intervals | Separates CPU launch bottlenecks from GPU execution | Omitting host enqueue duration |
| Reference value, tolerance, observed maximum error | Guards against fast but mathematically broken optimizations | Error exceeds numerical tolerance |
| Graph setup time and captured memory addresses | Accounts for instantiation overhead and verifies address contracts | Hidden instantiation costs inside replay loops |
CUDA Graphs reduce repeated submission work
A CUDA Graph describes operations and their dependencies. Instantiation prepares an executable graph, and repeated launches can skip much of eager argument setup and dispatch. A launch still costs time; measure whether the savings improve the workload.[9]
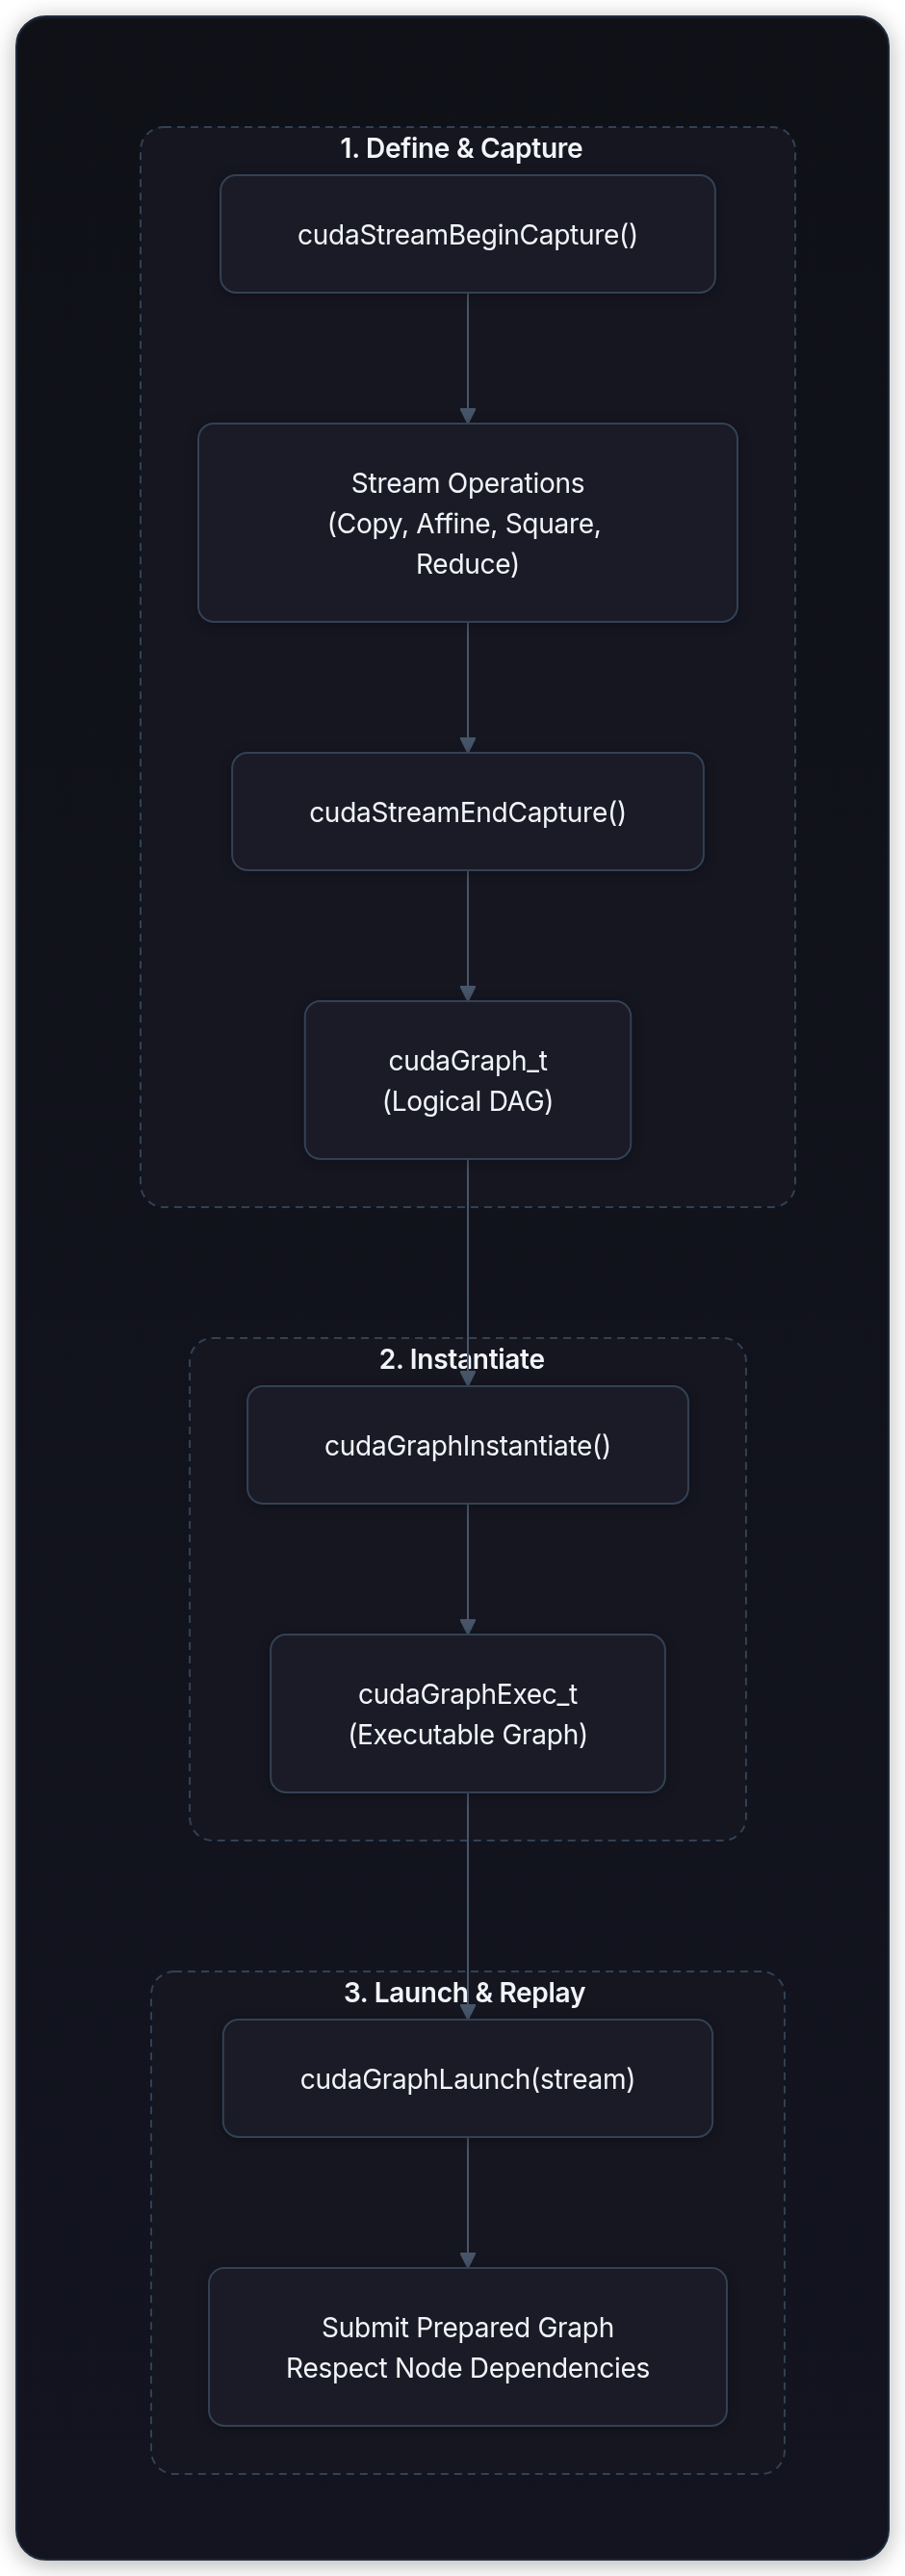
The CUDA Graph lifecycle follows three distinct phases:
-
Capture (
cudaGraph_t): Captured stream operations become graph nodes instead of running. Ordinary CPU work still executes during capture and isn't automatically recorded for replay. -
Instantiation (
cudaGraphExec_t):cudaGraphInstantiatevalidates a graph snapshot and prepares its executable. Cost depends on graph contents and environment. Record it separately; a new graph or an unsuccessful update can require another instantiation. -
Launch (
cudaGraphLaunch):cudaGraphLaunchsubmits the prepared graph to a stream. First launch can also upload work descriptions, so separate it from repeat launches. NVIDIA's September 2024 CUDA 12.6 microbenchmark on an RTX 3060 and Xeon Silver 4208 reported about 2.5 µs plus roughly 1 ns/node for repeated straight-line kernel graphs with at least ten nodes. Multiple roots and non-kernel nodes behaved differently. These historical measurements illustrate why hardware, topology, and version belong in a performance claim.[10]
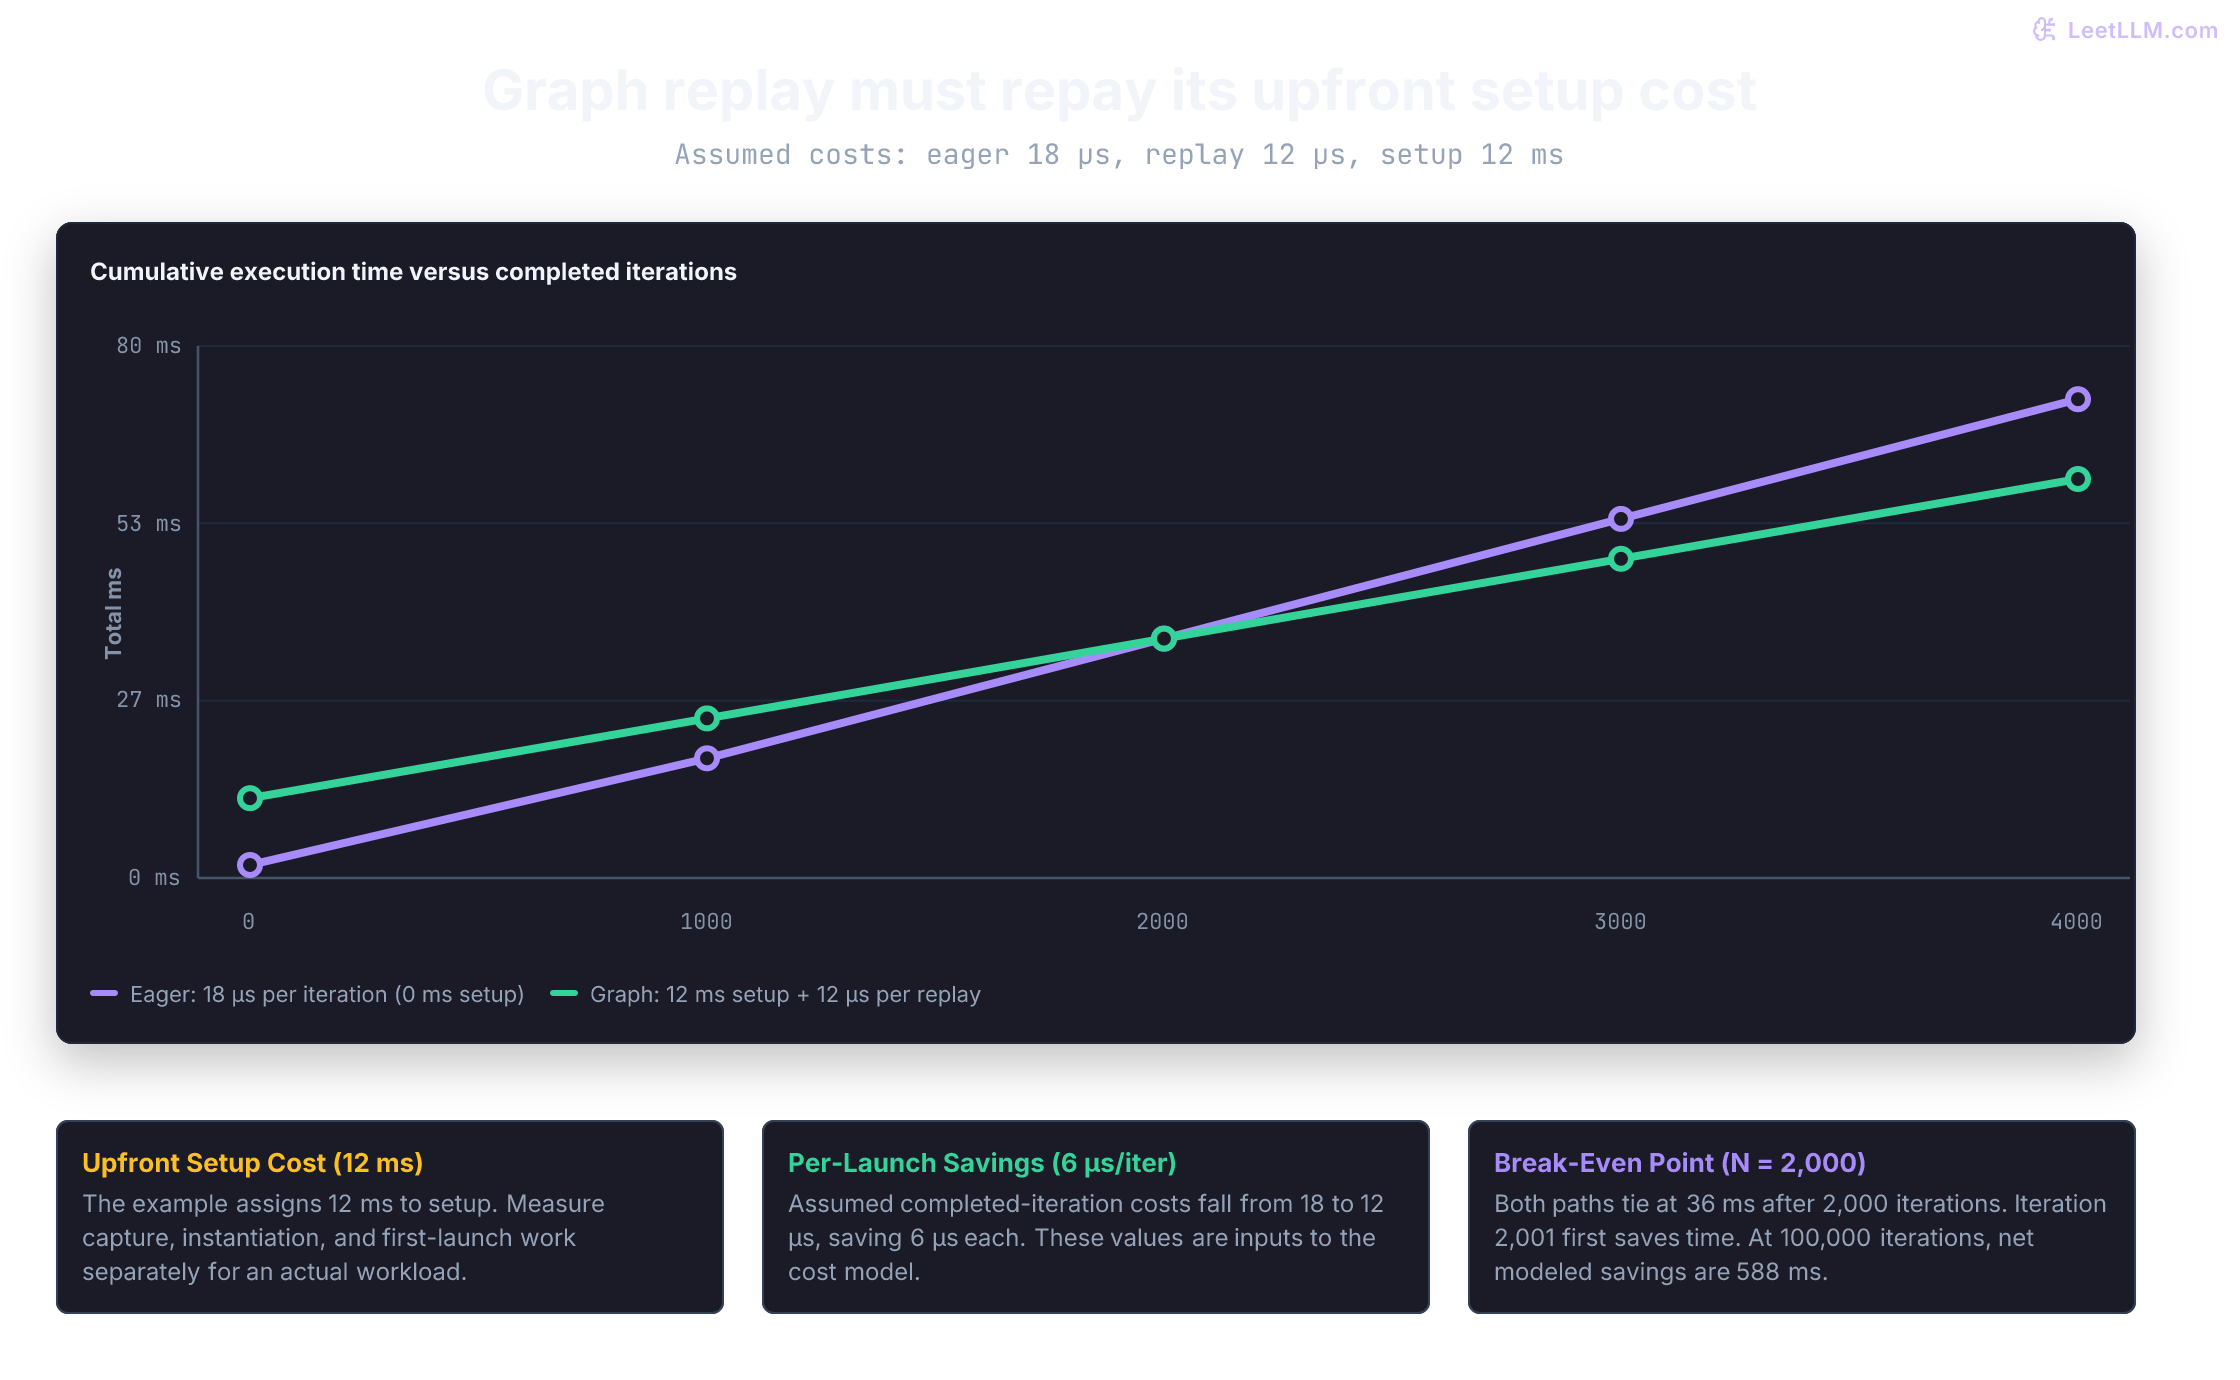
Suppose eager execution takes 18 microseconds per iteration (including host launch overhead and kernel execution), while graph replay drops the time to 12 microseconds, but incurs 12 milliseconds of upfront capture and instantiation cost. Each replay saves 6 microseconds:
At 2,000 iterations, both approaches take exactly 36 milliseconds. Replay iteration 2,001 is the first iteration that delivers a net performance improvement:
from math import floor, isfinite

def first_cheaper_reuse(setup_ms: float, eager_us: float, replay_us: float):
    if not all(isfinite(x) and x >= 0 for x in (setup_ms, eager_us, replay_us)):
        raise ValueError("costs must be finite and nonnegative")
    saving_us = eager_us - replay_us
    return floor(setup_ms * 1000 / saving_us) + 1 if saving_us > 0 else None

print("first cheaper reuse:", first_cheaper_reuse(12, 18, 12))
print("no replay saving:", first_cheaper_reuse(12, 12, 12))
assert 12_000 + 2000 * 12 == 2000 * 18
assert 12_000 + 2001 * 12 < 2001 * 18first cheaper reuse: 2001
no replay saving: NoneCapture rules and constraints
Stream capture intercepts stream activity and converts it into graph nodes. It enforces strict runtime constraints:
- CUDA capture accepts streams other than
cudaStreamLegacy, including explicitly created blocking streams andcudaStreamPerThread. PyTorch's capture wrapper uses a side stream. - If a capture region forks into multiple streams using events, all joined streams must merge back into the origin stream before
cudaStreamEndCaptureis called. - Don't synchronize/query the capturing stream, captured events, or a broader context/device that includes the capture. These refer to work not yet scheduled for execution.
- Ordinary CPU
mallocisn't generally prohibited and isn't captured. OrdinarycudaMallocis also not captured and is restricted by capture interaction mode; relaxing checks doesn't make it replayable. Graph-aware device allocation can use supported stream-ordered or memory-node APIs. PyTorch may allocate through its capture-aware caching allocator.[11][5]
PyTorch simplifies this workflow through torch.cuda.graph(), which manages side streams and coordinates with PyTorch's internal caching allocator to keep memory pools stable.[5]
Virtual addresses are baked into the graph
Captured pointer arguments refer to particular virtual addresses.
Reassigning a Python variable doesn't update captured arguments. If the original allocation remains alive, the graph still processes it. If storage is freed/reused without the required lifetime protection, replay can access invalid or unrelated data. New allocations aren't guaranteed to receive distinct addresses.
For this PyTorch lab, retain references to static buffers, copy new inputs in place, then replay. Order that copy before replay in the same stream or with an event. Order output use before a replay overwrites it, and wait before reading it on the CPU. A clone is also an asynchronous device operation and needs ordering.[5]
Why does reassigning an input variable with a freshly allocated tensor break CUDA Graph replay?
Answer
Reassignment changes a Python binding, not captured pointer arguments. The graph still uses the original allocation unless its executable parameters are explicitly updated through a supported mechanism. Retain that allocation and update its contents in place for this lab.
Graph parameter updates
CUDA supports two mechanisms for updating an executable graph without paying for a full reinstantiation:
- Node Parameter Updates (
cudaGraphExecKernelNodeSetParams): Updates the launch configuration (grid dimensions, block dimensions, or scalar parameters) of a specific node in an existing executable graph. - Whole-Graph Updates (
cudaGraphExecUpdate): Compares a newly captured logicalcudaGraph_tagainst an existingcudaGraphExec_tand updates execution parameters in place.
Identical topology is necessary, not sufficient, for whole-graph update. Node matching/order and node-specific restrictions also apply: kernel context can't change, and memcpy updates constrain devices, allocation contexts, dimensionality, and transfer kind. Check the returned update result and instantiate a valid replacement if it fails. Updates affect later launches; they don't modify already running work.[9]
Some execution variation can be represented without editing topology: CUDA provides node enable/disable APIs and conditional IF/WHILE/SWITCH nodes. PyTorch 2.14 documents selected torch.cond graph paths. Check their supported contents/backends before using them for data-dependent execution.[9][5]
Bucketed graph pools in inference runtimes
Continuous batching changes the number of requests and tokens. Capturing compatible shapes ahead of time can move setup off the token-generation path, at the cost of capture time, memory, and padding. The runtime must select a graph whose complete input contract matches the work.[12]
Inference engines resolve this tension using bucketed graph pools:
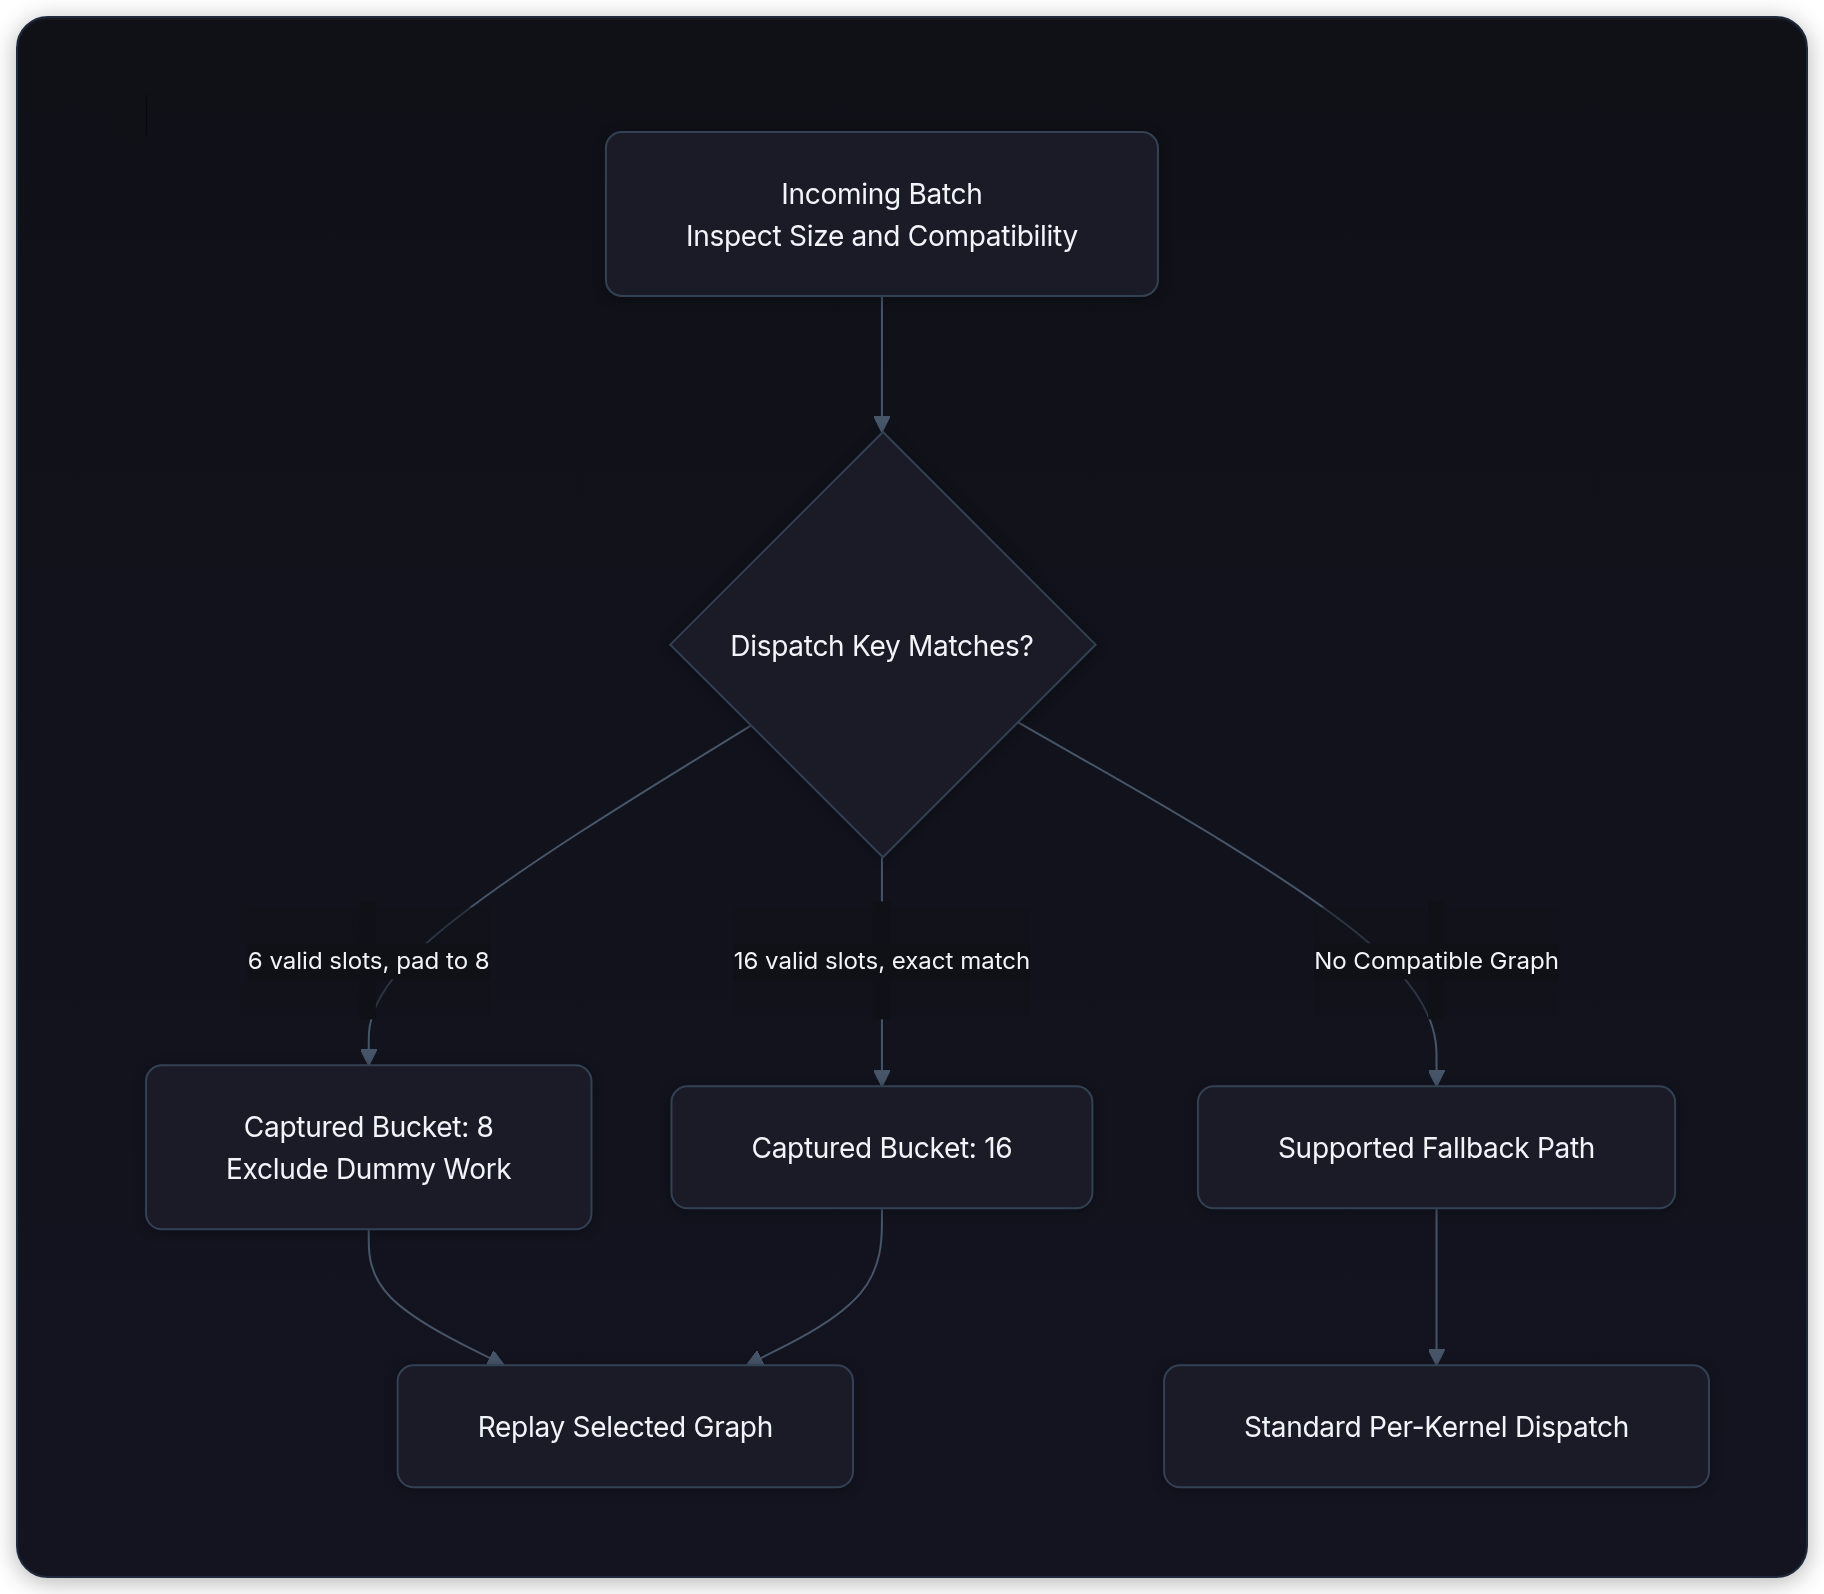
- Pre-Capture Discrete Buckets:
An illustrative set is
[1, 2, 4, 8, 16]. Actual capture sizes depend on configuration, model, memory, and backend; powers of two aren't required. - Padding with Attention Masking: Six compatible requests can use a bucket of eight. Every relevant output, reduction, and cache-write path must correctly handle the two dummy slots. Zero-valued padding alone isn't sufficient, and changing shape/kernel selection needn't preserve bitwise floating-point results.
- Eager Fallback for Outliers: With no compatible graph, use an available piecewise/eager path. That path still has its own supported shapes and numerical contract.
As inspected October 10, 2026, vLLM dispatches by runtime mode and a batch descriptor that includes padded token count, request count, uniformity, and LoRA status. Attention backends can restrict full-graph compatibility. SGLang documents separate decode/prefill graph backends and capture sizes, plus --disable-cuda-graph-padding. Prefill can therefore use supported graph paths; it isn't inherently eager.[12][13]
Predict the reduction after padding six inputs with two zeros. Our affine operation maps each dummy zero to one, which then survives squaring:
buckets = (1, 2, 4, 8, 16)
for count in (6, 16, 17):
    bucket = next((size for size in buckets if size >= count), None)
    print(f"valid={count}, bucket={bucket}")

inputs = [1, 2, 3, 4, 5, 6]
bucket = 8
padded = inputs + [0] * (bucket - len(inputs))
outputs = [(2*x + 1)**2 for x in padded]
reference = sum((2*x + 1)**2 for x in inputs)
unmasked = sum(outputs)
masked = sum(value for slot, value in enumerate(outputs) if slot < len(inputs))
print(f"reference={reference}, unmasked={unmasked}, masked={masked}")
assert masked == reference and unmasked != referencevalid=6, bucket=8
valid=16, bucket=16
valid=17, bucket=None
reference=454, unmasked=456, masked=454This integer model checks a dispatch/padding idea, not an inference engine. Try a dummy slot that writes to a real request's cache position. Masking the final output wouldn't undo that side effect.
Persistent kernels and device-side queues
After reducing repeated submission, a workload may still benefit from distributing tasks within a running kernel. Measure the remaining dispatch costs before adopting that more specialized design.
A persistent kernel keeps workers running across multiple work items. Its lifetime can be bounded, and the host may still produce work, communicate inputs, consume results, or cancel execution.
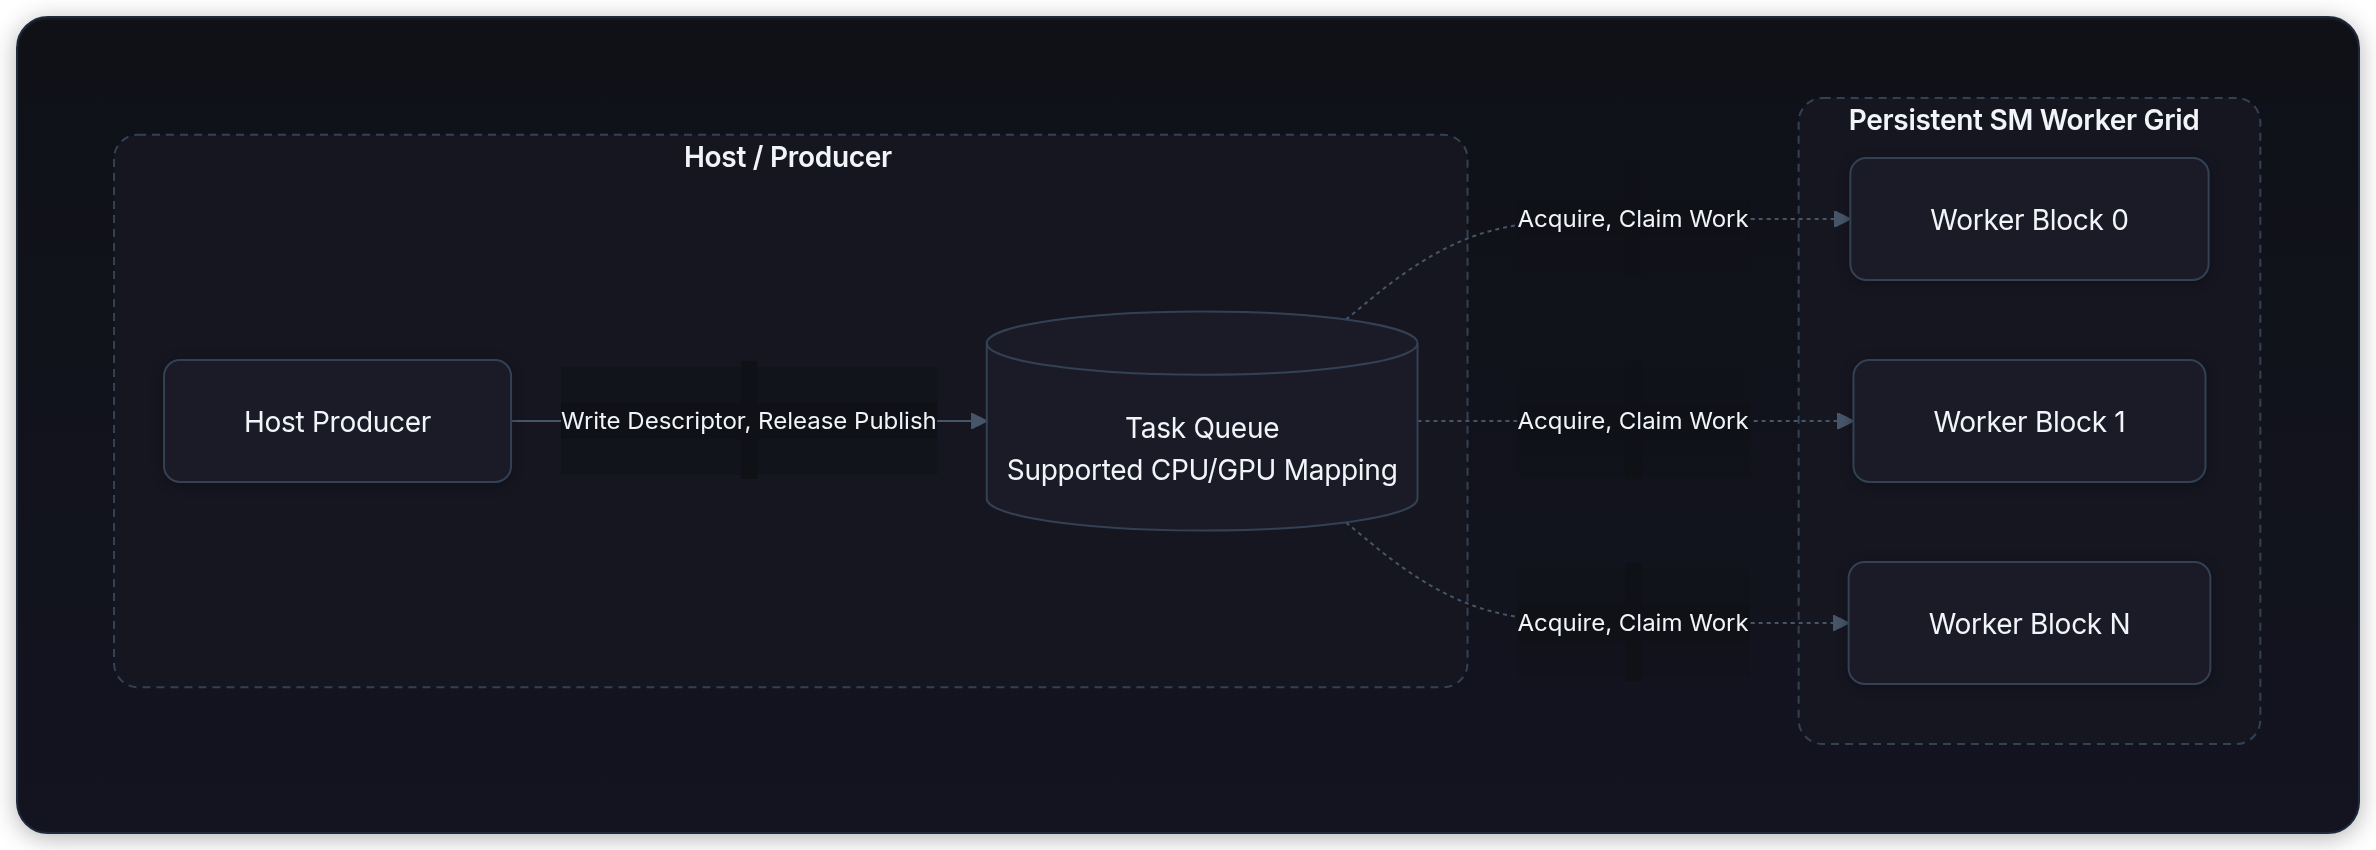
Persistent execution doesn't inherently require Cooperative Groups. If the algorithm uses this_grid().sync(), use a supported cooperative launch and size its grid according to the kernel's residency limit, checked with occupancy APIs and device capabilities. Independent workers can use ordinary launches.[14]
Each SM worker block executes a persistent while (running) loop:
- Poll and claim work through a correctly synchronized queue. For direct CPU/GPU communication, verify the allocation's concurrent-access/atomic support and use compatible system-scope acquire/release operations. Device-scope
atomicAddplus a fence alone doesn't define a correct host/device queue. - Process the published descriptor and its inputs when ownership is established.
- Publish completion with the required ordering; recycle slots only after readers finish. Include termination, bounded capacity, and forward-progress rules.[2]
Architectural trade-offs of persistent kernels
Dispatch and polling costs depend on the implementation and communication path. Compare these contracts:
| Engineering Dimension | Standard CUDA Graph | Persistent Worker Kernel |
|---|---|---|
| Submission work | Host graph launch plus device scheduling | Initial launch plus queue/communication work |
| Resource footprint | Each running node holds its required resources | Workers retain resources until they exit |
| Co-located workloads | Scheduling/resource contention still matters | Large resident grids can starve work needing those resources |
| Watchdogs | Long-running constituent kernels can time out | Long-running workers can time out; platform rules matter |
| Failure recovery | Device errors may require context/process recovery | Add worker shutdown/cancellation; faults can also require context/process recovery |
Resource starvation is especially dangerous when a worker waits for work that can't become resident until that worker exits. Spare resources may permit concurrency, but progress must follow from the algorithm and supported scheduling contract. Test shutdown and dependencies as carefully as the fast path; dedicated devices are one operational choice.
Run the GPU runtime lab
Download the complete gpu_runtime_lab.py script. It benchmarks our four-operation pipeline (copy -> affine -> square -> reduce) across three submission modes:
eager: Submits each operation sequentially from the current stream.stream: Submits the same chain to an explicit non-blocking stream.graph: Warms up the pipeline, captures static buffers, and executes via graph replay.
Run the lab on a system with a supported NVIDIA GPU:
uv run web/src/content/fundamentals/gpu-runtime-execution-lab/assets/gpu_runtime_lab.py \
  --mode all --elements 4096 --warmup 20 --iterations 1000
The script uses a 4,096-element FP32 vector initialized with linspace(0, 1, elements) and a device-to-device copy. Its stream mode submits one dependent chain, not two independent pipelines. It doesn't benchmark pinned host transfers or copy/compute overlap.
Before timing each mode, it fills the retained input buffer with zeros and ones, checking the expected sums (elements and 9 * elements) within its declared tolerance. It restores the original input, warms up, primes events, and checks the last completed result against an FP64 CPU reference. This catches stale graph inputs but doesn't validate every timed iteration.
uv run web/src/content/fundamentals/gpu-runtime-execution-lab/assets/gpu_runtime_lab.py \
  --mode all --elements 4096 --warmup 20 --iterations 1000 > receipt.json
Read these fields from your own successful run:
| Receipt field | Interpretation |
|---|---|
host_submit_us_per_iteration | Submission-loop total divided by iterations; includes Python/framework/API work |
device_us_per_iteration | Stream event span divided by iterations; includes idle gaps inside the markers |
end_to_end_us_per_iteration | Wall interval through stop-event completion, divided by iterations |
graph_setup_ms | Capture/instantiation context plus final synchronization; excludes three preceding eager warmups and first replay/upload |
fresh_input_checks, passed, tolerance | Completed correctness checks for the two fresh inputs and final result |
source_sha256, buffer_contract, environment | Source identity, per-mode shapes/addresses, and recorded environment; torch_cuda_build names the toolkit used to build PyTorch |
These are averages over a repeated, already allocated workload, not individual-request latency percentiles. The setup figure excludes context creation, allocation, and preflight. PyTorch 2.14's default CUDAGraph(keep_graph=False) instantiates at capture end; keep_graph=True has a different first-replay contract. The lab's preflight replays occur before timing.[15]
If graph mode reduces host time, check whether end-to-end time also improves. A shorter event span is consistent with fewer submission gaps, but the trace must establish the cause. Eager and explicit-stream modes retain the same data dependencies, so merely selecting another stream shouldn't imply parallel arithmetic. Repeat runs in different mode orders to inspect warm-state and drift effects; reused buffers aren't a residency guarantee.
Diagnostic guide for runtime bottlenecks
| Symptom | Evidence to inspect | Possible cause | Next step |
|---|---|---|---|
| CPU timer reports tiny numbers, but end-to-end request latency is high | Host submission is fast, but cudaStreamSynchronize blocks for milliseconds | Host timer stopped immediately after enqueue without waiting for device completion | Use CUDA timing events or synchronize before stopping CPU timers |
| Consumer reads stale or partial data | Stream ordering, input lifetimes, and outputs across runs | Missing dependency or a separate memory fault | Record producer completion before the consumer wait; check the allocation contract |
| Transfers don't overlap compute | API and device trace, buffer regions, stream flags | Staging, ordering, unsupported overlap, or resource contention | Use suitable pinned host buffers and remove unnecessary barriers after verifying dependencies |
| Stream capture fails | First failing API and capture error state | Capturing legacy stream, an unsupported call, or forbidden synchronization | Apply that API's capture rules; end invalid capture before reuse |
| Graph replay uses old inputs | Captured pointer and actual updated storage | Python binding changed while captured arguments stayed fixed | Retain static storage and order an in-place copy before replay |
| Dynamic batch size crashes or corrupts memory | Crash occurs when request count changes | Reused graph executable has incompatible tensor shapes or grid bindings | Implement bucketed graph pools with padded masking and eager fallback |
| Graph gives little improvement | Completed latency, dispatch gaps, graph mode, and setup amortization | Submission may be a small cost, or replay may add other work | Locate the remaining cost before choosing kernel or runtime changes |
| Persistent worker degrades other workloads | Resource usage and runnable work in their traces | Worker residency can prevent other blocks from starting | Check a smaller grid and whether dependencies still guarantee progress |