Personalize this lesson
Adapt explanations and teaching visuals to your background and preferred voice.
You have fifteen minutes to explain a project. You could open with its class hierarchy, or with this question: why did adding one partner's runbooks take twenty days? The second opening gives the architecture a job to do.
In AI Lab Behavioral Interview, you practiced separating your contribution from the team's result. A technical presentation lets you go further: show the decision, the mechanism, and the evidence another engineer could question.
There isn't a universal AI-lab presentation format. OpenAI's guide, checked October 10, 2026, says assessments vary by team and emphasizes reasoning and communication; Google DeepMind sends role-specific preparation information and encourages data-backed examples.[1][2] Ask your recruiter about the audience, presentation length versus Q&A, project-selection constraints, and permitted materials. The fifteen-minute engineering talk below is a rehearsal example, not a hiring requirement or a scoring rubric used by those companies.
Choose a project you can explain honestly
Start with the prompt for your role. An infrastructure project can demonstrate architecture and operational judgment. A research project can demonstrate a hypothesis, experimental design, a result, and its limitations. A prototype or negative result can also work when it answers the requested question; don't invent production scale to make it sound larger.
Choose evidence you can discuss without exposing confidential information. Use approved aggregates or a sanitized diagram, remove customer identifiers and secrets, and say when a number is rounded or withheld. If a project can't be explained meaningfully within those limits, choose another one. Don't upload private artifacts to a rehearsal tool just because it accepts files.
This lesson uses a synthetic connector-platform project. Every outcome below is invented for teaching, not a company result or a candidate story to borrow:
- Support engineers search tenant-policy documents and partner runbooks.
- Eight source-specific integrations duplicate credential handling and pagination logic.
- Adding a source takes twenty days in the example baseline. Lookups must stay below an 800 ms p95 latency target.
- You own a common connector contract, adapter implementation, gateway changes, contract tests, and trace instrumentation. Another team owns the tenant store.
That scope supports a useful talk without claiming ownership of every subsystem. The project later supports runbook retrieval for an assistant, but the connector migration itself isn't model research.
Build the argument before the slides
Write six sentences before choosing a slide theme. Here is a possible outline for the synthetic project:
Problem: Each partner integration repeated source-specific plumbing.
Constraint: Change the lookup path without mixing tenant credentials.
Decision: Put adapters behind one contract, initially in-process.
Alternative: Separate services give deployment and scaling independence,
             but add remote calls and another operational boundary.
Evidence: Show onboarding records, contract-test failures, and lookup traces.
Limit: Before/after outcomes don't isolate the effect of the new contract.
Then ask which detail a listener needs to assess each sentence. A pagination example may explain why the contract mattered. A list of helper classes probably doesn't. Keep implementation detail when it explains correctness, a bottleneck, or a difficult choice.
A research talk can use the same discipline without forcing a rollout story: question, hypothesis, method, baseline, result, limitation. For example, if you changed a retriever, show the fixed evaluation set and the failed cases as well as the aggregate score. Research reporting guidance such as the NeurIPS checklist is useful for checking claim scope and reproducibility, not for predicting an interviewer's hiring decision.[3]
A prototype never reached production. Must you replace it with a larger project?
Answer
No. Check the role's presentation instructions. A prototype may show a well-defined hypothesis, a meaningful comparison, and a clear personal contribution. State what was and wasn't tested instead of presenting projected adoption as measured impact.
Budget time around the question
For a fifteen-minute slot, try two minutes for the problem and constraints, four for the architecture, three for a hard decision, three for evidence, one for limitations, and two for questions or interruptions. If Q&A has its own reserved block, you can use that slack differently. Rehearse against the actual instructions.
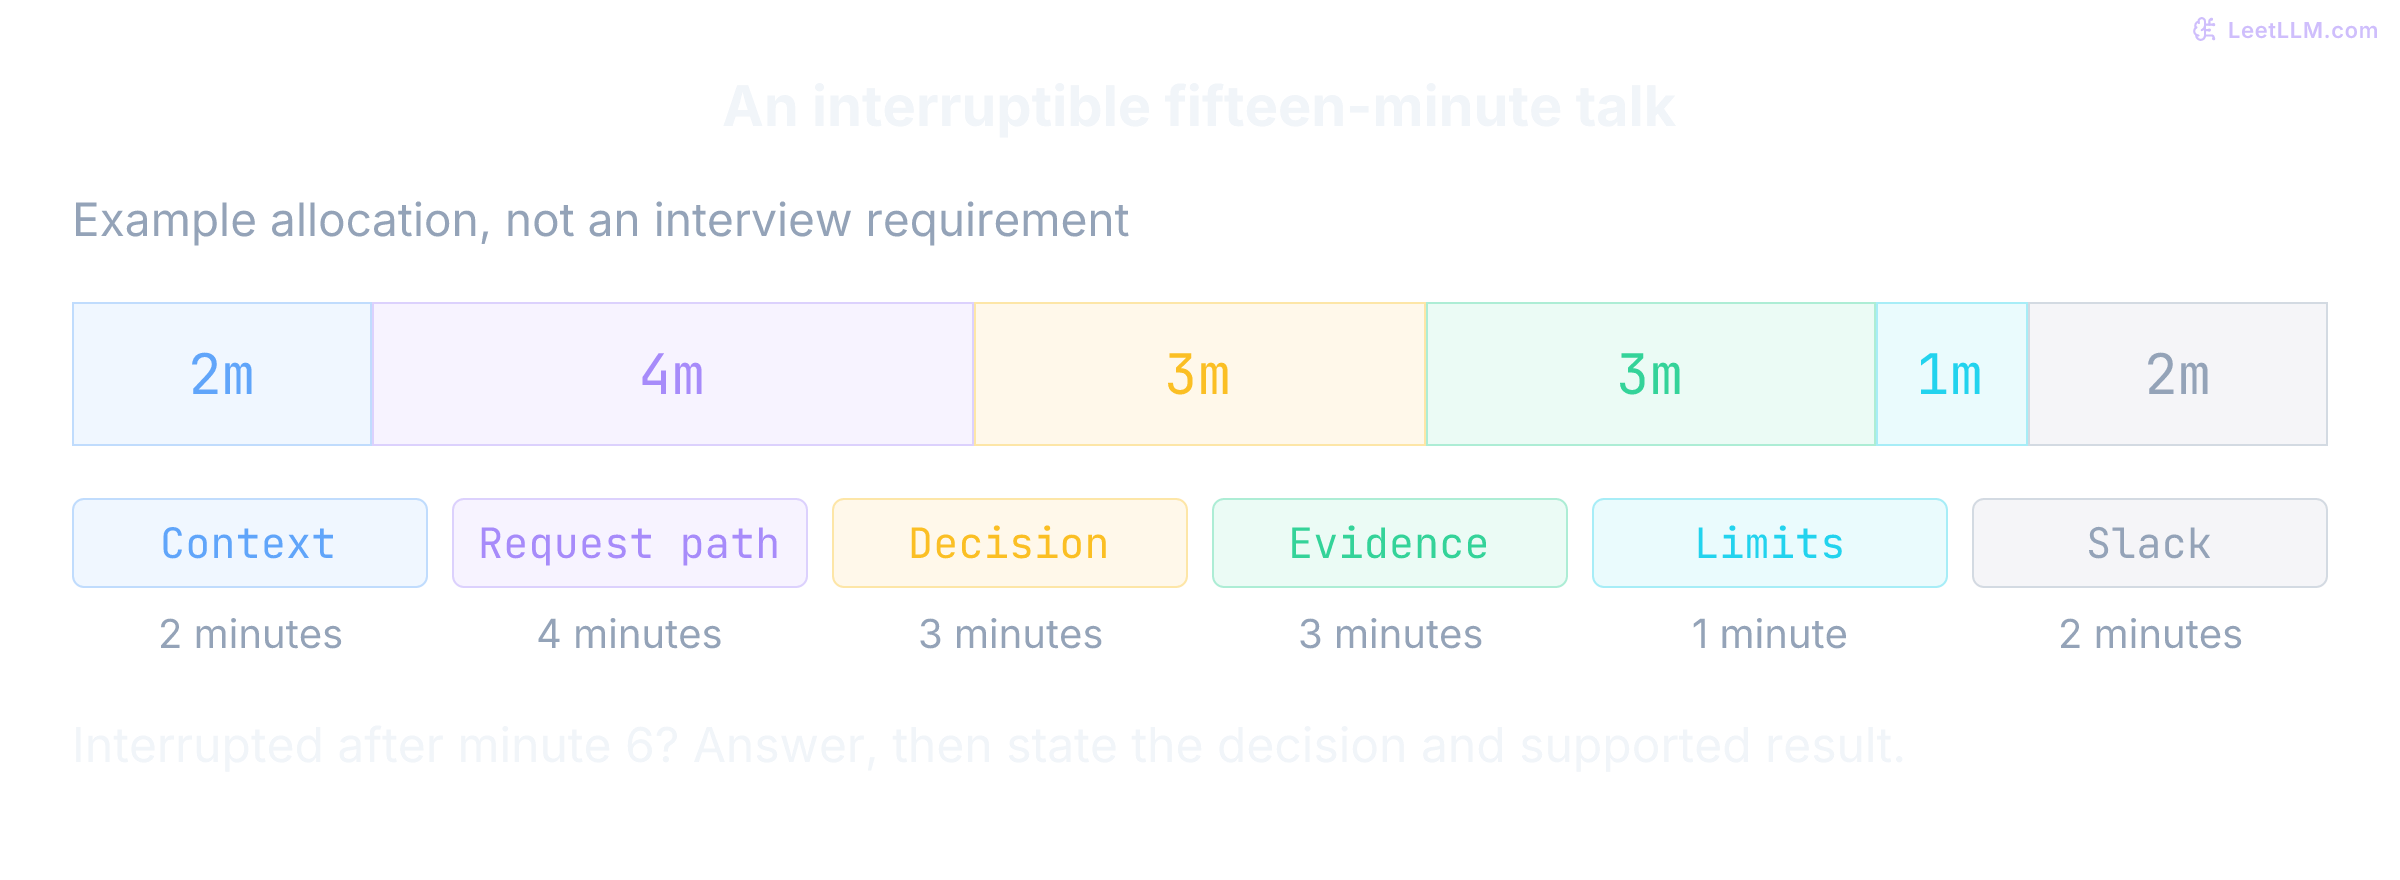
Build a short version as well. In ninety seconds, say what changed, the hardest decision, your contribution, and the strongest supported result. In the full talk, expand those same claims with evidence. You don't need a fixed slide count or a rule that every diagram has seven boxes.
If the format includes a demo, tell the audience what to look for before running it. For this project, trace one lookup through authorization, pagination, and the response. Keep a sanitized captured trace ready if the dependency fails. One successful demo shows one execution, not reliability across users or workloads.
Draw the request and the ownership boundary
Your diagram should answer a concrete question: where could this lookup use the wrong tenant's credentials, return a partial page, or lose its request ID? Role names such as gateway and adapter help an unfamiliar audience follow that question.
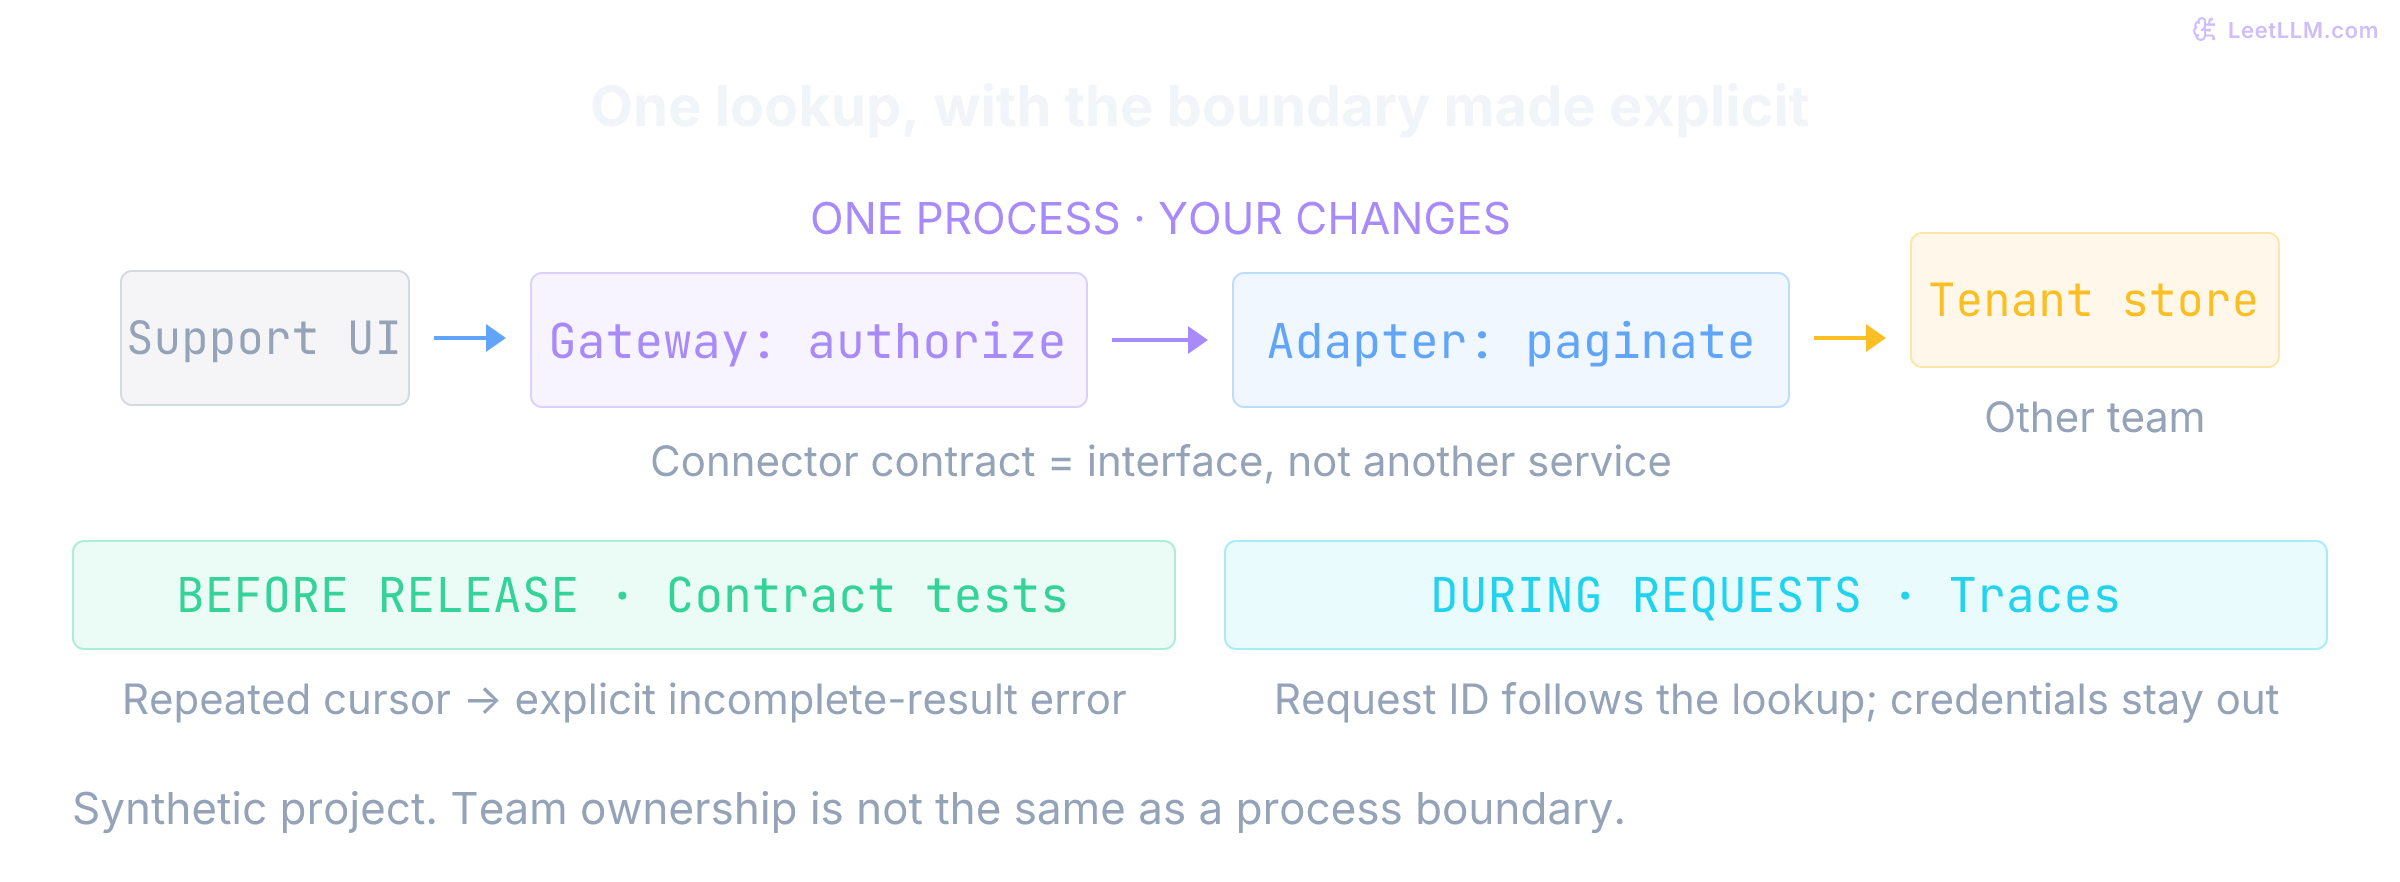
Talk through one failure, not just the happy path. Suppose a source repeats its pagination cursor. The adapter detects the repeated cursor and returns an explicit incomplete-result error under the contract. It mustn't silently report a complete runbook collection. A regression test preserves that case, and the trace records the source and request ID without recording credentials.
Label what you personally changed. “I wrote the adapter contract and the repeated-cursor test; the platform team owned the backing store” is more informative than “I built the entire platform.” Shared ownership doesn't invalidate a contribution.
Keep deeper material available only when it helps a question: request and error schemas, the pagination invariant, a sanitized trace, or the compatibility test. A diagram isn't an inventory of every library.
Defend a choice without making it permanent
The in-process design trades independent deployment and resource isolation for a simpler first migration. It avoids an extra network call and lets the team debug gateway and adapter code together. It also means an adapter bug or resource spike can affect the shared process.
A service split is one possible response to that cost, not a reward for reaching a certain size. Consider the question, “Queue time went up. Would you split the adapters?” First locate the wait. If the external source is rate-limiting requests, another service won't remove that limit. If one adapter saturates the shared process, separate resource budgets, concurrency limits, or an isolated service are plausible alternatives. Compare their cost and failure behavior.
A useful answer has four parts: the constraint you prioritized, the alternative you considered, the downside you accepted, and the evidence that would make you reconsider. Describe a reversal you could actually execute, including compatibility and migration cost.
Make each number carry only the claim it supports
The synthetic result sheet below has several improvements, but they aren't interchangeable. A p95 latency is the 95th percentile of request durations; it doesn't measure retrieval usefulness. A deployment threshold is a decision rule, not proof that a change caused an improvement.
| Example observation | Defensible interpretation | What the slide still needs |
|---|---|---|
| Source onboarding: 20 → 6 days | 14 fewer days in the compared groups | Number of sources, complexity, start/end definition, and concurrent process changes |
| Lookup p95: 720 → 680 ms; target 800 ms | Both reported percentiles are below the target | Traffic mix, sample sizes, measurement windows, errors and timeouts |
| Incidents: 5 → 1 per quarter | Fewer incidents in those two quarters | Definition, severity, request volume, reporting changes, and more observation time |
| Relevant runbook in top five: 148 → 162 of 200 queries | 14 additional successes on this fixed set | Which queries improved or regressed, label quality, and unseen-tenant coverage |
Don't say “the contract cut incidents by 80%” merely because 5 became 1. The arithmetic is an 80% count reduction; the causal attribution needs more evidence. Even the direction of a per-request rate can differ: five incidents over five million requests is one per million, while one over half a million is two per million. Those exposures are illustrative, not additional measurements of the project.
Likewise, the latency change is 40 ms, or about 5.6% of the baseline, not a 40% reduction. Don't turn the gap below the 800 ms target into a claim of available capacity without load testing.
Define the latency population. Google SRE recommends distinguishing successful and failed-request latency and tracking error behavior separately.[4] A success-only p95 can look healthy while timeouts increase. In a separate synthetic fixture below, successful-request p95 is 680 ms, but 20 of 200 attempts time out. A policy requiring both p95 below 800 ms and at least 99% success fails: the success fraction is only 90%. Report the failed-attempt count and durations too; omitting them would make the slide conceal a broken promise.
Inspect the cases behind the average
For this exercise, each of 200 frozen queries has exactly one labeled relevant runbook. A success means that runbook appears in the top five. This is hit@5 and, with one relevant item per query, also the query's recall@5. With multiple relevant items, recall instead measures the fraction of those items retrieved; don't silently substitute “at least one hit.”
Matching query IDs is only the first comparison check. Hold query text, labels, corpus revision, and tenant/permission context fixed. Record each system's index build, retriever/model revision, code, and configuration; a changed embedding model may need a separately rebuilt index over that same corpus. If several inputs change, describe the comparison as a combined system change instead of attributing the result to one adapter or retriever. This applies the NeurIPS checklist's scope and reproducibility principles to our retrieval example.[3]
The baseline succeeds on 148 queries and the candidate on 162. That is 74% → 81%, a 7 percentage-point increase, or roughly 9.5% relative improvement. It doesn't mean every query improved.
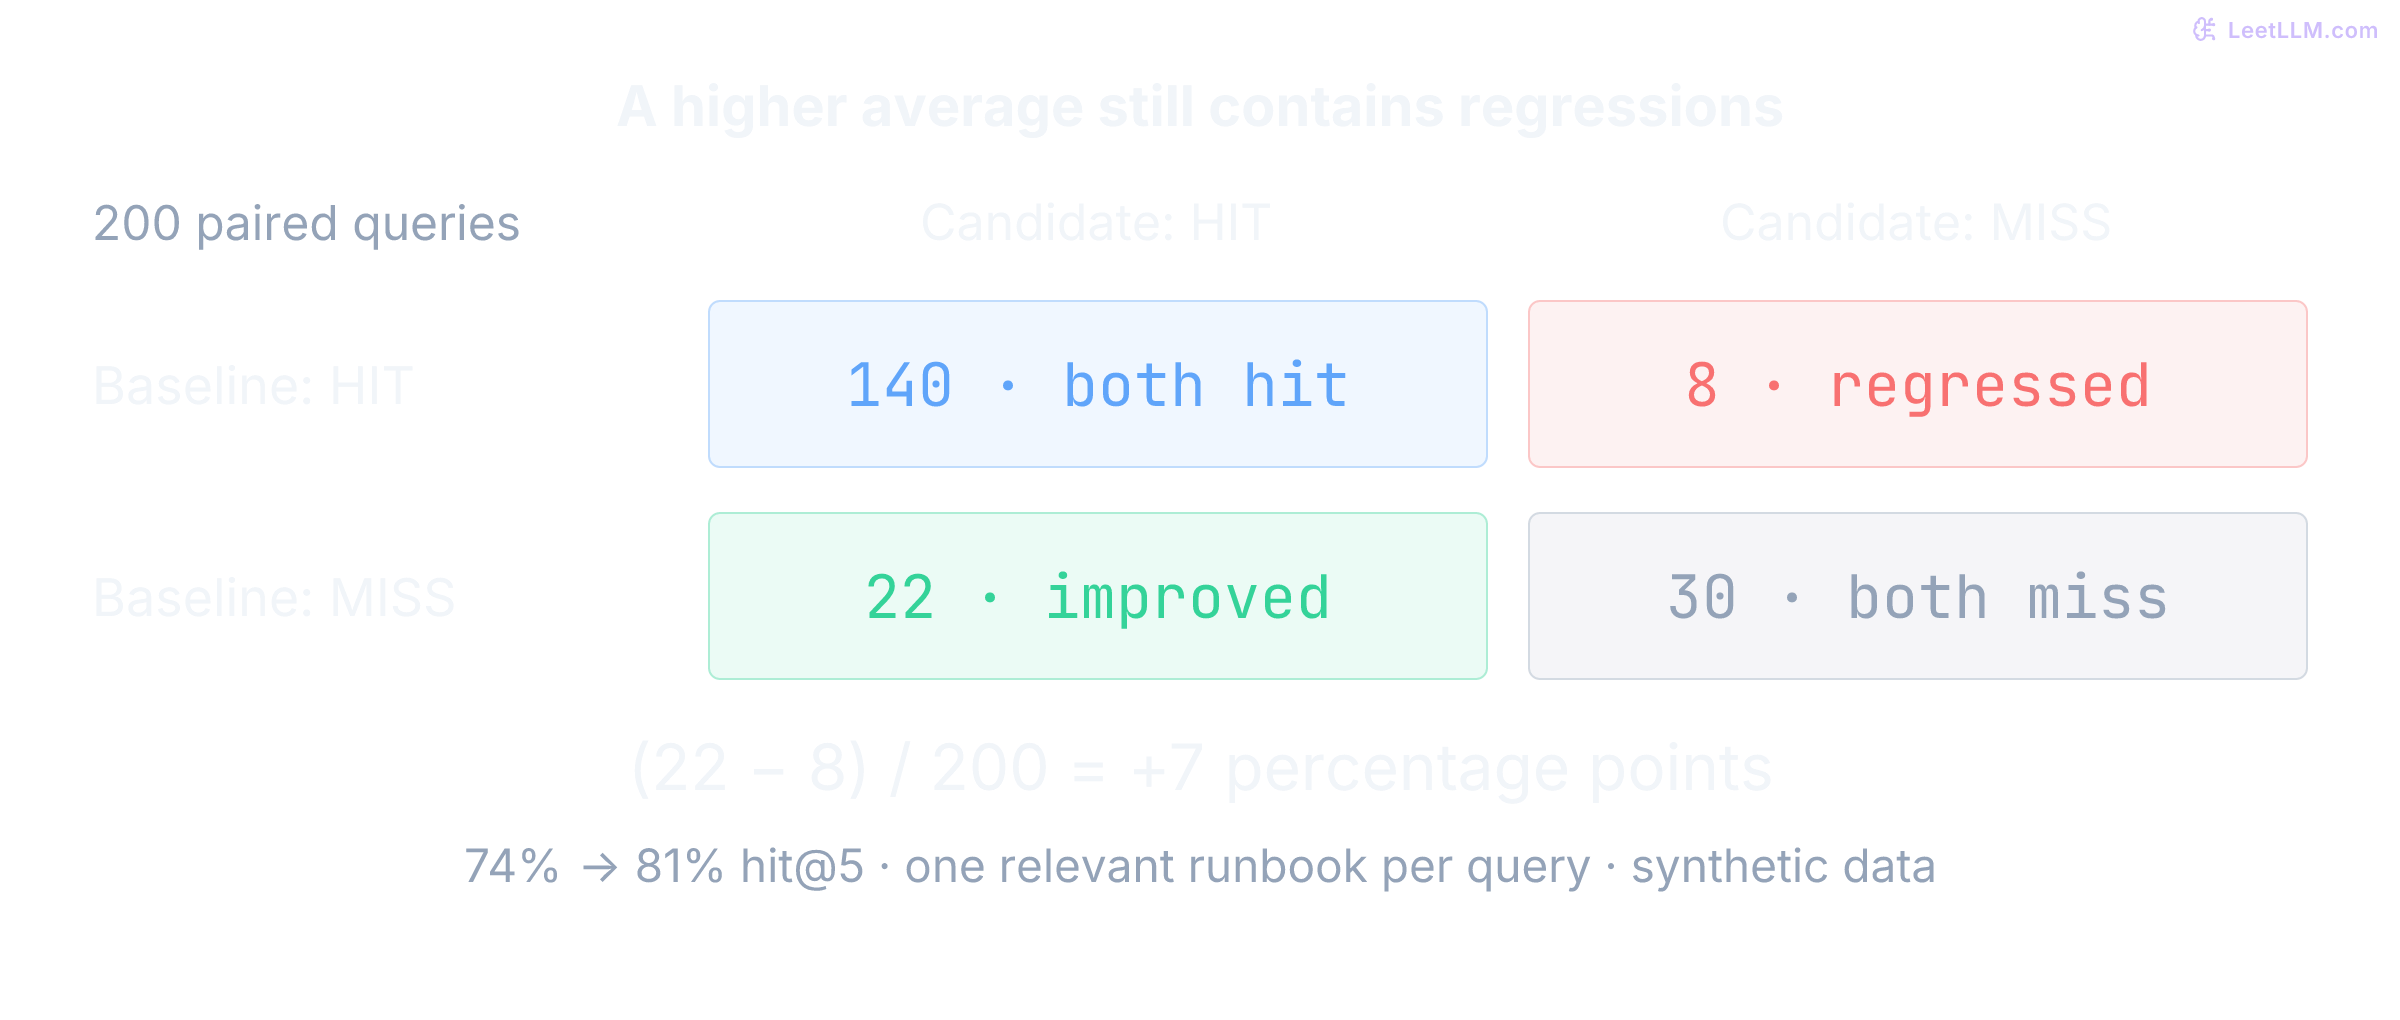
Compute the paired counts with the standard library, reject incompatible input, and check the incident-rate reversal and timeout gate. This fixture counts whole requests: a boolean or fractional request denominator is invalid. It verifies arithmetic, not the validity of the labels, a statistical significance claim, or a real project outcome.
from collections import Counter

def paired_hits(baseline, candidate):
    if not baseline or baseline.keys() != candidate.keys():
        raise ValueError("need the same nonempty query IDs")
    if any(type(v) is not bool for v in (*baseline.values(), *candidate.values())):
        raise ValueError("hits must be booleans")
    counts = Counter(zip(baseline.values(), (candidate[q] for q in baseline)))
    n = len(baseline)
    old = (counts[True, True] + counts[True, False]) / n
    new = (counts[True, True] + counts[False, True]) / n
    return counts, old, new

def incidents_per_million(count, requests):
    if type(count) is not int or count < 0:
        raise ValueError("count must be a nonnegative integer")
    if type(requests) is not int or requests <= 0:
        raise ValueError("request exposure must be a positive integer")
    return count / requests * 1_000_000

# Synthetic paired observations, not downloaded interview or benchmark data.
pairs = [(True, True)] * 140 + [(True, False)] * 8
pairs += [(False, True)] * 22 + [(False, False)] * 30
baseline = {f"q{i}": old for i, (old, _) in enumerate(pairs)}
candidate = {f"q{i}": new for i, (_, new) in enumerate(pairs)}
counts, old, new = paired_hits(baseline, candidate)
assert counts[False, True] - counts[True, False] == 14
assert round(100 * (new - old), 6) == 7.0
# Match by ID, even when input dictionaries have different iteration orders.
assert paired_hits(baseline, dict(reversed(list(candidate.items())))) == (counts, old, new)
assert paired_hits({"q": False}, {"q": False})[1:] == (0.0, 0.0)
assert paired_hits({"q": True}, {"q": False})[1:] == (1.0, 0.0)
for left, right in [({}, {}), ({"q": True}, {"x": True}), ({"q": 1}, {"q": True})]:
    try:
        paired_hits(left, right)
    except ValueError:
        pass
    else:
        raise AssertionError("invalid comparison accepted")

for invalid_exposure in (True, 0.5):
    try:
        incidents_per_million(1, invalid_exposure)
    except ValueError:
        pass
    else:
        raise AssertionError("invalid request denominator accepted")

print(f"hit@5: {old:.0%} -> {new:.0%}; delta {100 * (new - old):.1f} pp")
print(f"improved {counts[False, True]}; regressed {counts[True, False]}")
print("incidents per million:", incidents_per_million(5, 5_000_000),
      "->", incidents_per_million(1, 500_000))

attempted, timed_out = 200, 20
successful_p95_ms = 680  # Assumed observed percentile, not calculated from a trace.
success_fraction = (attempted - timed_out) / attempted
latency_passes = successful_p95_ms < 800
both_gates_pass = latency_passes and success_fraction >= 0.99
print(f"success fraction: {success_fraction:.0%}; latency passes: {latency_passes}")
print("both gates pass:", both_gates_pass)
assert not both_gates_passhit@5: 74% -> 81%; delta 7.0 pp
improved 22; regressed 8
incidents per million: 1.0 -> 2.0
success fraction: 90%; latency passes: True
both gates pass: FalseFor an actual experiment, explain how the queries were chosen and whether they were used during tuning. Report uncertainty appropriate to the sampling process; don't treat repeated runs on the same queries as independent new users. If the sample is too narrow to support a general claim, show that limitation on the result slide.
Explain how you controlled the migration
An appendix can answer “How did you know the new path was safe?” more precisely than a list of rollout buzzwords. For this example, separate three stages:
- Replay a sanitized, labeled fixture through both paths. Check authorization, repeated pagination, error handling, and retrieval results.
- Shadow a permitted sample of read-only traffic while the old path still serves users. Bound the extra load and side effects, compare outputs, and stop the shadow if it harms the serving path. Live traffic isn't automatically labeled for retrieval quality.
- Move a small share of real traffic to the candidate only after those checks. This canary exposes behavior under actual serving conditions. Define the observation window, latency/error gates, quality checks, and a tested route back to the old path before promotion.
Shadow success isn't a live rollout, and read-only duplication isn't free: it can consume quota, emit audit events, and change caches. Likewise, routing traffic back doesn't undo writes. If the real project migrates schemas or performs actions, explain compatibility and recovery separately.
Google Cloud's MLOps guidance distinguishes offline validation from online validation through canary or A/B deployments.[5] Apply that distinction to your evidence, without claiming a connector shadow test reproduces every model-serving risk. If a declared quality gate fails while latency improves, explain why you held the rollout rather than hiding the failed gate.
Answer questions at the edge of your knowledge
Google DeepMind's guide explicitly encourages candidates to explain reasoning and acknowledge uncertainty.[2] Practice a specific response:
I owned the request schema and adapter tests, not the store's indexes. The trace suggests the wait is inside the store call, but it doesn't identify the cause. I'd ask for the query plan and compare it with a slow request before recommending an index.
This separates observation, hypothesis, and proposed investigation. It doesn't evade the question. If you notice a mistake in a slide, correct it directly and say whether it changes the conclusion.
Prepare depth on mechanisms that matter to your claim. If scheduling determines your latency result, understand the scheduler behavior you measured. You don't need to memorize the internals of every named dependency. Explain the interface you used and identify who owned the rest.
Follow the interview's tool policy. OpenAI says AI-tool permissions vary by format. DeepMind's public guide permits preparation with AI but says not to use it during live interviews or tasks unless instructed otherwise.[1][2] Don't infer permission from what a different employer allowed.
Bridge to AI work without relabeling the project
For an agent-platform role, a useful bridge might be: “Our connector enforced tenant-scoped access before a request reached the store. With a model choosing calls, I'd keep authorization outside the model and test unauthorized tool requests.” Explain how the policy is enforced; an evaluation that catches some bad calls isn't an authorization boundary.
For a retrieval role, the bridge might instead be label quality, query-level regressions, and tenant coverage. For a research role, discuss what hypothesis the result motivates and the experiment needed to test it. Choose the connection that fits the role rather than appending an agent-control checklist to every talk.
Rehearse with evidence, not a script score
Have a listener interrupt after the architecture slide and ask, “What did you change, and how do you know it helped?” If you can't answer without the next eight slides, shorten the explanation. Ask them to challenge one assumption and identify one unsupported claim. A checker can add up minutes; it can't determine whether your contribution or reasoning is convincing.
Common presentation failure modes
| Symptom | Repair |
|---|---|
| A diagram lists packages but doesn't show a request | Trace one input, one decision, and one failure path |
| A precise percentage has no denominator | Add sample counts, units, windows, and population definitions |
| Team results are described as individual work | Name your decision and artifact, then credit the other owners |
| A before/after chart is treated as causal proof | State concurrent changes and the comparison needed to isolate the effect |
| A prototype is described as deployed behavior | Label simulation, replay, shadow, and live evidence separately |
| Every question triggers an appendix tour | Answer the question first, then open the one supporting artifact |
Evaluation rubric
- Can a listener explain the problem, chosen design, and credible alternative without learning your internal acronyms?
- Can each outcome be traced to a defined measurement, with personal contribution and causal limits stated separately?
- Can you explain a failure or negative result, a boundary you didn't own, and what evidence would change your decision?
Follow-up questions
The audience asks whether the 74% to 81% result means the new retriever is better for every tenant. What do you say?
Answer
It improved hit@5 on this fixed 200-query set by seven percentage points, with twenty-two improvements and eight regressions. That doesn't establish improvement for every tenant. Inspect tenant-level coverage and the regressed cases, then evaluate on an appropriate held-out sample.
You have five minutes left after questions interrupt the request-path slide. What do you preserve?
Answer
Answer the current question, then state the hardest decision, your contribution, the main supported result, and its limitation. Offer deeper material in Q&A rather than accelerating through every planned slide. Follow the interviewer's direction if they want to stay on one technical detail.