Personalize this lesson
Adapt explanations and teaching visuals to your background and preferred voice.
If you train on Linux or Windows with an NVIDIA GPU, start with CUDA for ML Training. If you train on a Mac with Apple silicon, use this matching backend path after that lesson's placement and timing contracts.
You move a classifier to your Mac's GPU, but its first forward pass fails: the model is on mps and the batch is still on cpu. Doesn't Apple silicon share memory between CPU and GPU? It does. Shared physical memory and PyTorch device placement are different things.
The previous CUDA lesson introduced device placement and timing. Both habits transfer from CUDA to the Mac, but the memory picture changes.
We keep its four-ticket batch, (B, T, D) = (4, 8, 16), and follow one classifier step through the Mac path: where tensors live, which memory pool they use, whether an operation runs on the accelerator, and when the host has actually waited. Python still runs on the CPU; PyTorch launches GPU kernels for tensors that live on the selected device.[1][2]
Metal, MPS, and the mps device
Start with model.to("mps"). The string is one small part of a three-layer stack:
- Metal: Apple's GPU programming framework.
- MPS: Metal Performance Shaders, Apple's library of optimized GPU operations.
mps: the PyTorch device string you pass to tensors and modules.
Metal is Apple's graphics and compute API. PyTorch doesn't ask you to write Metal shaders for ordinary training. It uses a Metal Performance Shaders (MPS) backend that maps tensor ops onto MPS Graph and tuned MPS kernels.[1][2] The Mac question isn't "CUDA or GPU?" It's "which backend does this machine expose to PyTorch?"
One memory pool, two PyTorch devices
With a discrete NVIDIA GPU, host RAM and GPU video memory are separate physical pools, with copies across an interconnect. Apple silicon uses a unified memory architecture: CPU and GPU share system memory instead of splitting storage into CPU RAM plus a separate VRAM card.[4]
The same .to(...) call therefore crosses different hardware boundaries:
- On a discrete NVIDIA GPU,
tensor.to("cuda")places storage in the GPU's own device memory. - On Apple silicon,
tensor.to("mps")doesn't cross that same RAM-to-VRAM boundary. But changing a PyTorch tensor's device still returns a copy, not the original tensor with a new label. The CPU allocation and the MPS allocation draw from the same physical pool. Apple's MLX has a different array model; its shared-memory behavior isn't a promise about PyTorch tensors.[5][4]
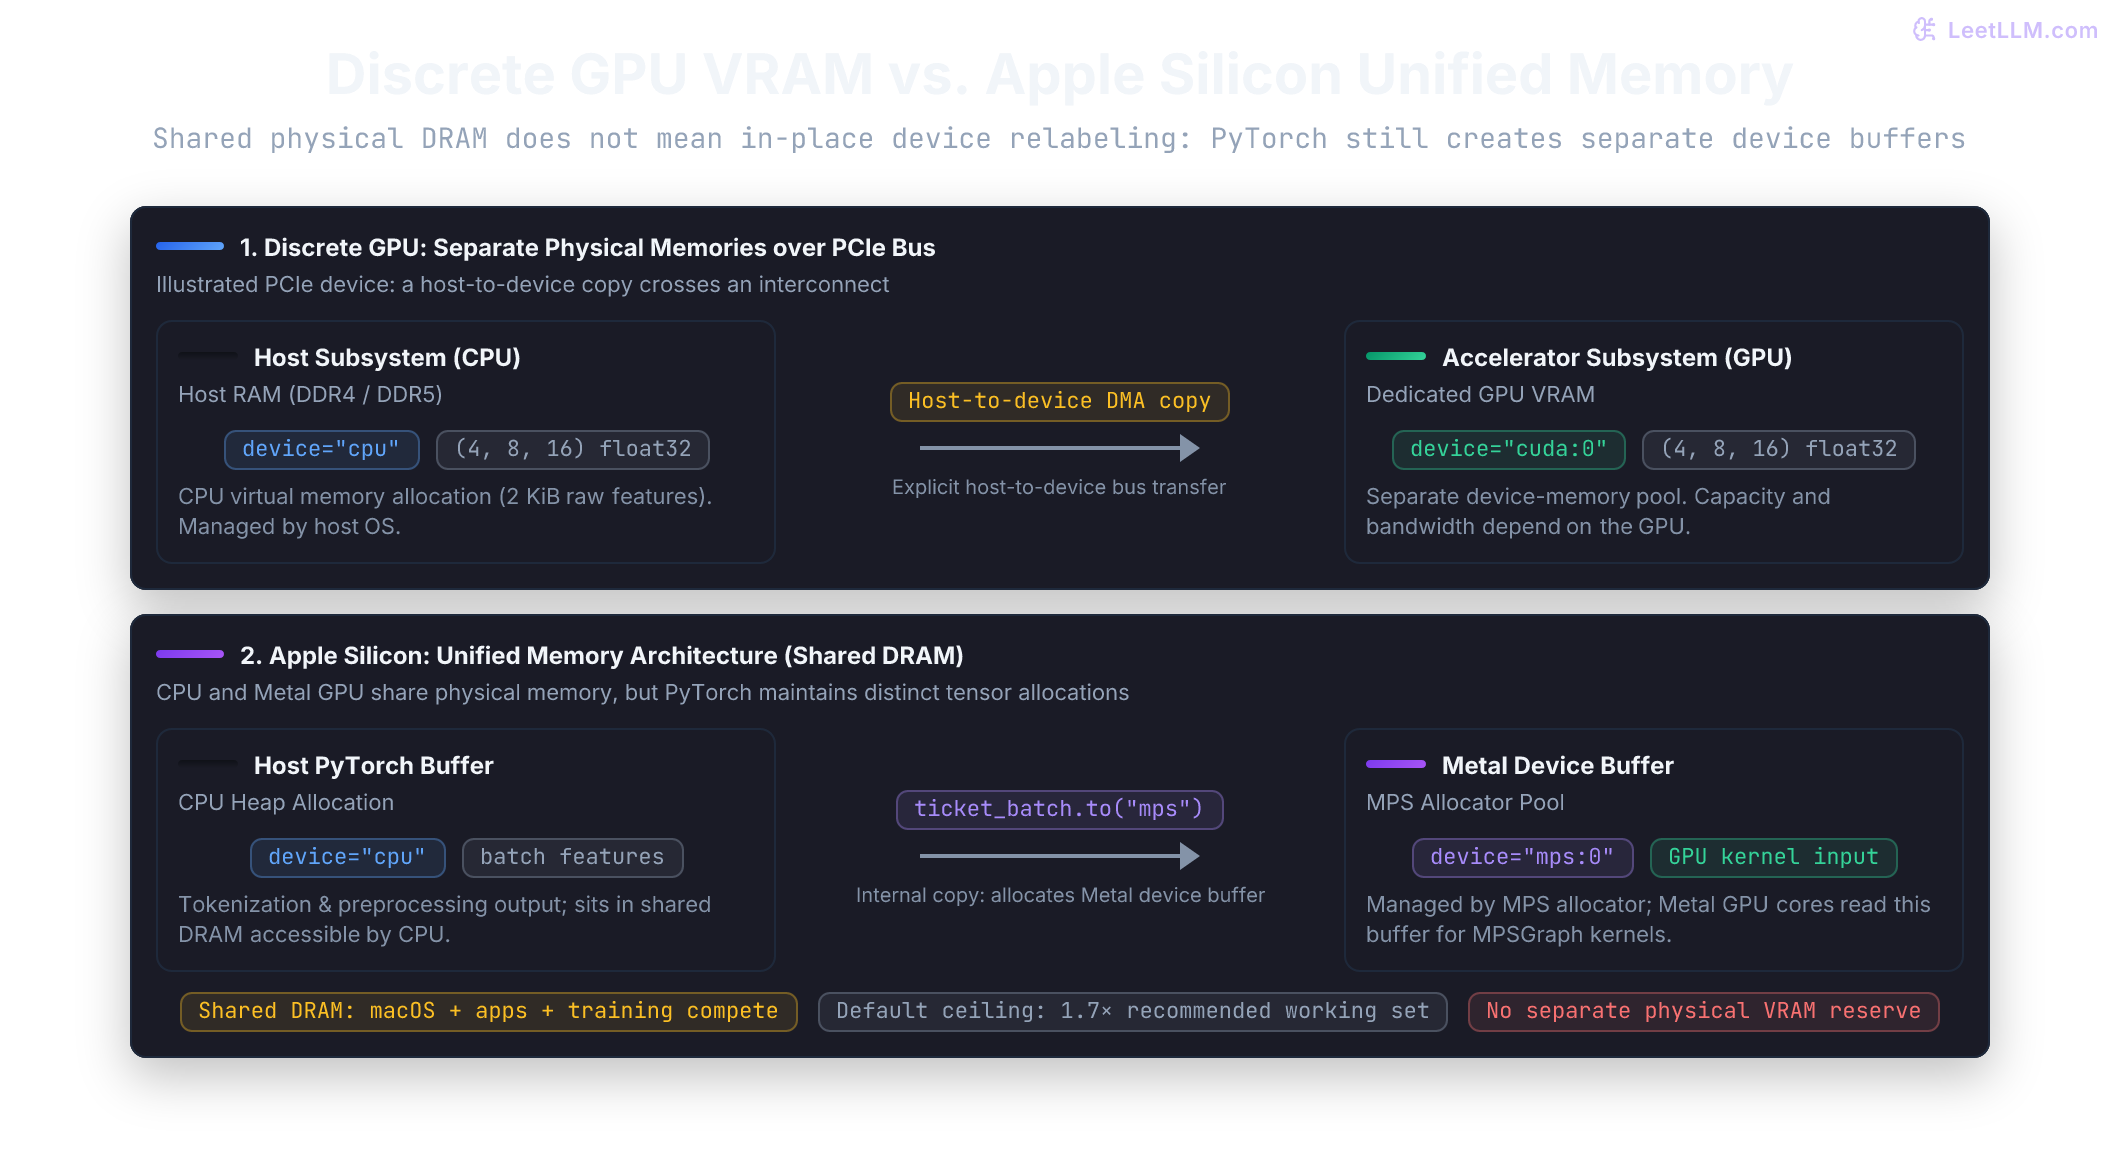
Two practical consequences follow:
- There isn't a dedicated VRAM budget for the integrated GPU. The GPU shares physical memory with the CPU, macOS, and other apps. The pool is still limited. macOS and PyTorch enforce working-set ceilings (
recommended_max_memory, high watermark), so unified memory doesn't remove GPU memory pressure. - Placement is still explicit. You still write
cpuandmps, keep model and batch on compatible devices, and avoid needless host-visible scalar reads in the hot path.
Assign the returned tensor: ticket_batch = ticket_batch.to("mps"). Calling ticket_batch.to("mps") and discarding the result leaves ticket_batch on CPU. By contrast, model.to("mps") updates a module's parameters in place. This small API difference often explains the first mixed-device error.
Predict which batch hides the memory problem: the teaching shape or a realistic classifier step. The CUDA lesson kept (4, 8, 16) small enough for any card. That tiny float32 batch is only 2 KiB of raw features. A larger step, 32 tickets with 128 tokens and 768 features, makes the input allocation visible:
1tiny = 4 * 8 * 16 * 4
2realistic = 32 * 128 * 768 * 4
3mib = 1024 ** 2
4
5print(f"CUDA teaching batch (4, 8, 16): {tiny / 1024:.1f} KiB")
6print(f"larger step (32, 128, 768): {realistic / mib:.1f} MiB")
7print("training also keeps weights, activations, gradients, and optimizer state")1CUDA teaching batch (4, 8, 16): 2.0 KiB
2larger step (32, 128, 768): 12.0 MiB
3training also keeps weights, activations, gradients, and optimizer stateThe expected output is 2.0 KiB and 12.0 MiB. That 12.0 MiB is only input features. Training also stores weights, activations, gradients, optimizer state, and temporary workspaces. On a Mac those tensors compete for the same system memory as the rest of the laptop.
Environment prerequisites on macOS
Apple's setup page documents a wheel path for an Apple silicon Mac with macOS 14.0 or later, Python 3.10 or later, and Xcode command-line tools.[1] It names a specific PyTorch release, while the PyTorch install selector names its current stable build. Those version numbers move, so use Apple's page for the Mac requirements floor, then confirm the wheel for your Python and macOS versions.[6]
Check the machine before changing model code. If xcode-select -p reports missing developer tools, run xcode-select --install once.
1xcode-select -p
2python3 --version
3sw_vers
Create a virtual environment so this lesson doesn't replace packages used by another project. Then install the current torch wheel:
1python3 -m venv .venv
2source .venv/bin/activate
3python -m pip install --upgrade pip
4python -m pip install torch
Runtime availability: is_built() vs. is_available()
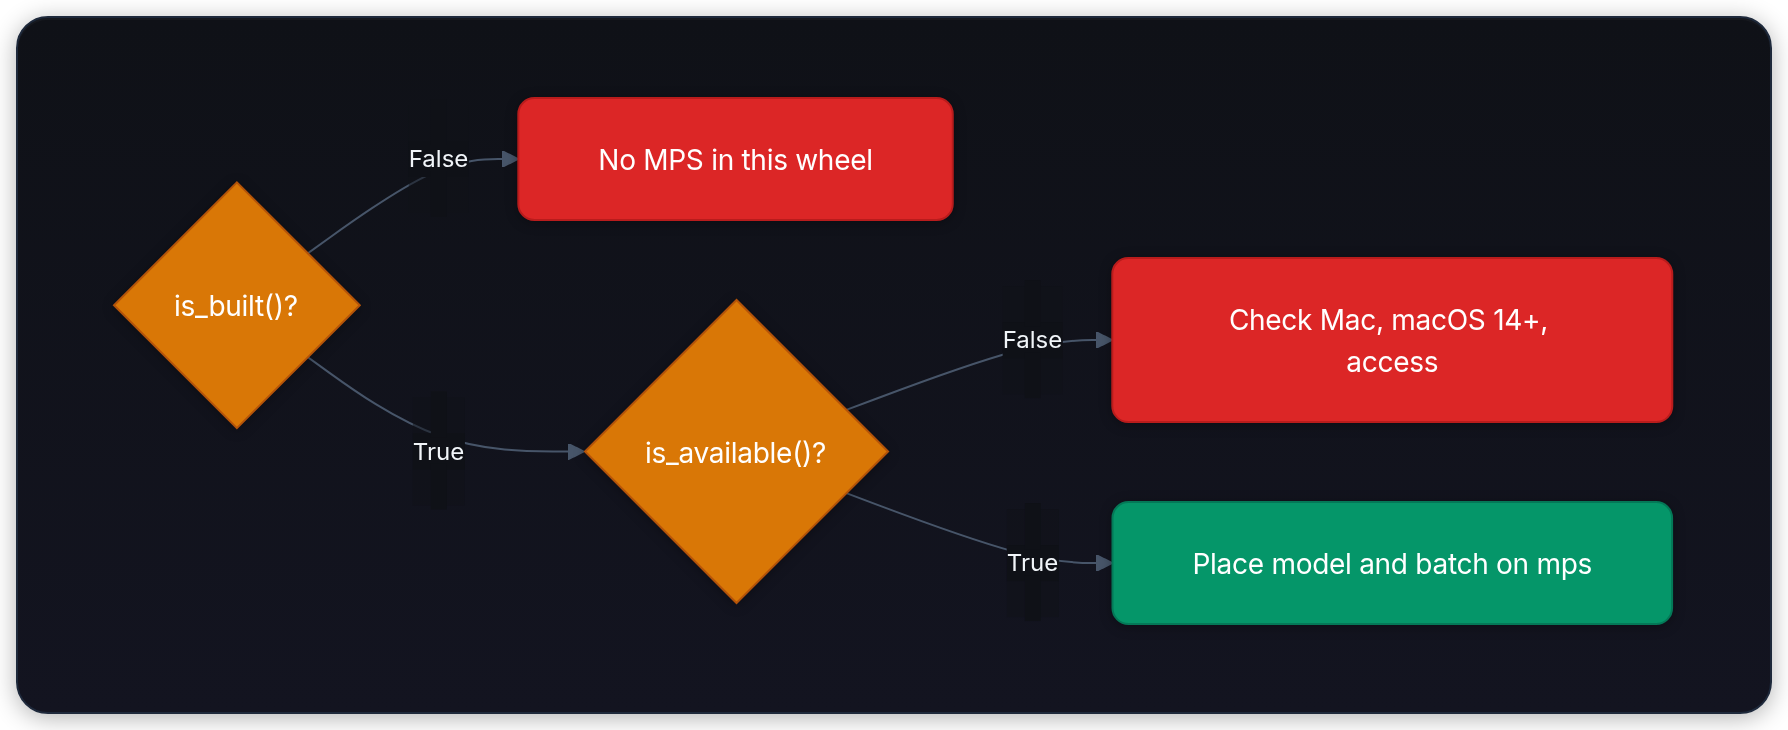
Before running the script, predict what mps built: True and mps available: False should mean. The check distinguishes three states:
- This PyTorch binary was not built with MPS support.
- The binary knows about MPS, but this machine or OS can't use it right now.
- MPS is available, so you can move model and tensors onto
mps.
PyTorch's own MPS note uses that is_built() / is_available() split. If the backend is missing from the wheel, it says the install was not built with MPS. If the wheel has MPS but the runtime can't use it, the current docs point at macOS below 14.0 or a machine without an MPS-capable device.[2]
1import torch
2
3has_mps_backend = hasattr(torch.backends, "mps")
4mps_built = bool(has_mps_backend and torch.backends.mps.is_built())
5mps_available = bool(has_mps_backend and torch.backends.mps.is_available())
6
7device = torch.device("mps") if mps_available else torch.device("cpu")
8
9x = torch.arange(6, dtype=torch.float32).reshape(2, 3).to(device)
10model = torch.nn.Linear(3, 2).to(device)
11y = model(x)
12
13print(f"mps built: {mps_built}")
14print(f"mps available: {mps_available}")
15print(f"selected device: {device}")
16print(f"output shape: {tuple(y.shape)}")1mps built: True
2mps available: True
3selected device: mps
4output shape: (2, 2)The printed mps built / mps available lines are an example from a compatible Apple silicon Mac. On non-Mac hosts, older macOS, or a CPU-only wheel, expect False and selected device: cpu. The output shape stays (2, 2) either way.
- built = False means this PyTorch binary lacks MPS support. That's expected off macOS. On a supported Mac, check the wheel and Python architecture.
- built = True, available = False usually means the backend exists in the package, but OS, hardware, or runtime access is missing.
- available = True means you can use
torch.device("mps").
is_built() answers "does this wheel even know about MPS?" is_available() answers "can this specific machine use it right now?" Keep those two questions separate.
The same four tickets on mps
Reuse the CUDA lesson's batch: four tickets, eight token positions, sixteen features. These randomly generated features stand in for already-encoded text; a tokenizer itself produces token IDs, not sixteen floating-point features per position. Average the eight positions into one vector per ticket, then produce three logits (unnormalized class scores) per ticket. Labels stay [0, 2, 1, 0].
The shape calculation is (4, 8, 16) to (4, 16) to (4, 3): mean(dim=1) removes the eight-position axis, and Linear(16, 3) maps each sixteen-feature vector to three scores. If the batch stays on CPU while the model moves to mps, the mean can succeed on CPU; the linear layer is where the incompatible devices meet.
On a Mac training run, one small step usually looks like this:
| Step | CPU side | mps side | Why it matters |
|---|---|---|---|
| batch assembly | tokenizer, collator, padding, labels | nothing yet | data still starts on host |
| device move | Python asks for .to("mps") | batch becomes an mps tensor | placement is explicit |
| forward pass | host launches ops | Metal kernels run the math | most heavy arithmetic lives here |
| loss read | maybe host asks for a scalar | device may need to finish queued work first | logging can stall the loop |
| backward pass | autograd schedules gradient work | gradient kernels run on mps | memory now includes activations and grads |
| optimizer step | host calls step() | parameter updates happen on mps | model stays on device across steps |
Read the table as a debugging trace: for each row, name tensor location, kernel location, synchronization point, and likely failure. The device tag is logical even when physical memory is shared.
Unified memory tempts people into "one laptop, one pool, one device." The hardware shares memory. PyTorch still doesn't. cpu and mps are separate device targets, and the forward pass still fails if model and batch land on different devices.[2]
The next cell checks those shapes and device agreement. Its fixed seed makes the random example easier to rerun, although exact values needn't match across backends.
1import torch
2import torch.nn as nn
3
4torch.manual_seed(7)
5device = torch.device("mps" if torch.backends.mps.is_available() else "cpu")
6model = nn.Linear(16, 3).to(device)
7ticket_batch = torch.randn(4, 8, 16).to(device)
8
9ticket_vectors = ticket_batch.mean(dim=1)
10logits = model(ticket_vectors)
11devices_match = next(model.parameters()).device == ticket_batch.device == logits.device
12print("model and batch agree:", devices_match)
13print("ticket vectors:", tuple(ticket_vectors.shape))
14print("logits shape:", tuple(logits.shape))1model and batch agree: True
2ticket vectors: (4, 16)
3logits shape: (4, 3)Continue in the same Python session with one optimizer step. Cross-entropy compares the three scores with each ticket's correct class. backward() computes parameter gradients, and step() changes the weights using those gradients. We're checking that this path executes, not teaching a useful classifier from four random examples. The training-loop lesson develops the learning process later.
1import math
2
3import torch.nn.functional as F
4
5optimizer = torch.optim.SGD(model.parameters(), lr=0.1)
6labels = torch.tensor([0, 2, 1, 0], device=device)
7weights_before = model.weight.detach().clone()
8
9optimizer.zero_grad()
10loss = F.cross_entropy(model(ticket_vectors), labels)
11loss.backward()
12optimizer.step()
13logged_loss = loss.detach().cpu().item()
14
15print("weights changed:", not torch.equal(weights_before, model.weight.detach()))
16print("finite loss:", math.isfinite(logged_loss))1weights changed: True
2finite loss: TrueThe .cpu().item() call sits outside gradient computation. It marks the boundary where a scalar returns to the host for reporting.
If model and batch devices don't agree, fix placement before hunting deeper bugs. Compare actual parameter and tensor devices, including their indices. An indexless torch.device("mps") isn't equal to torch.device("mps:0"), even though both can select the Mac GPU. Continue in the same session to catch and repair an unplaced batch:
1import torch
2
3batch = torch.randn(4, 8, 16)
4model_device = next(model.parameters()).device
5print("before move:", batch.device == model_device)
6batch = batch.to(model_device)
7print("after move:", batch.device == model_device)1before move: False
2after move: TrueOn MPS, the first line is False and the second is True. On the CPU path, both are True: the new batch already matches the model. This check applies to the single-device classifier here, not to intentionally partitioned models.
One Mac GPU isn't a CUDA cluster
If Activity Monitor shows many Apple GPU cores, should PyTorch expose one device per core? No. torch.mps.device_count() reports available MPS devices.[7] This lesson uses the default mps device, which Apple's verification example prints as mps:0.[1] GPU core count and PyTorch device count answer different questions.
That differs from a CUDA server with several discrete cards. If a job needs multi-device or multi-node training, verify the target framework and communication backend on that cluster instead of translating CUDA distributed settings onto the Mac. The local MPS path here is for one-device development and smaller training runs.
Unsupported operations and CPU fallback
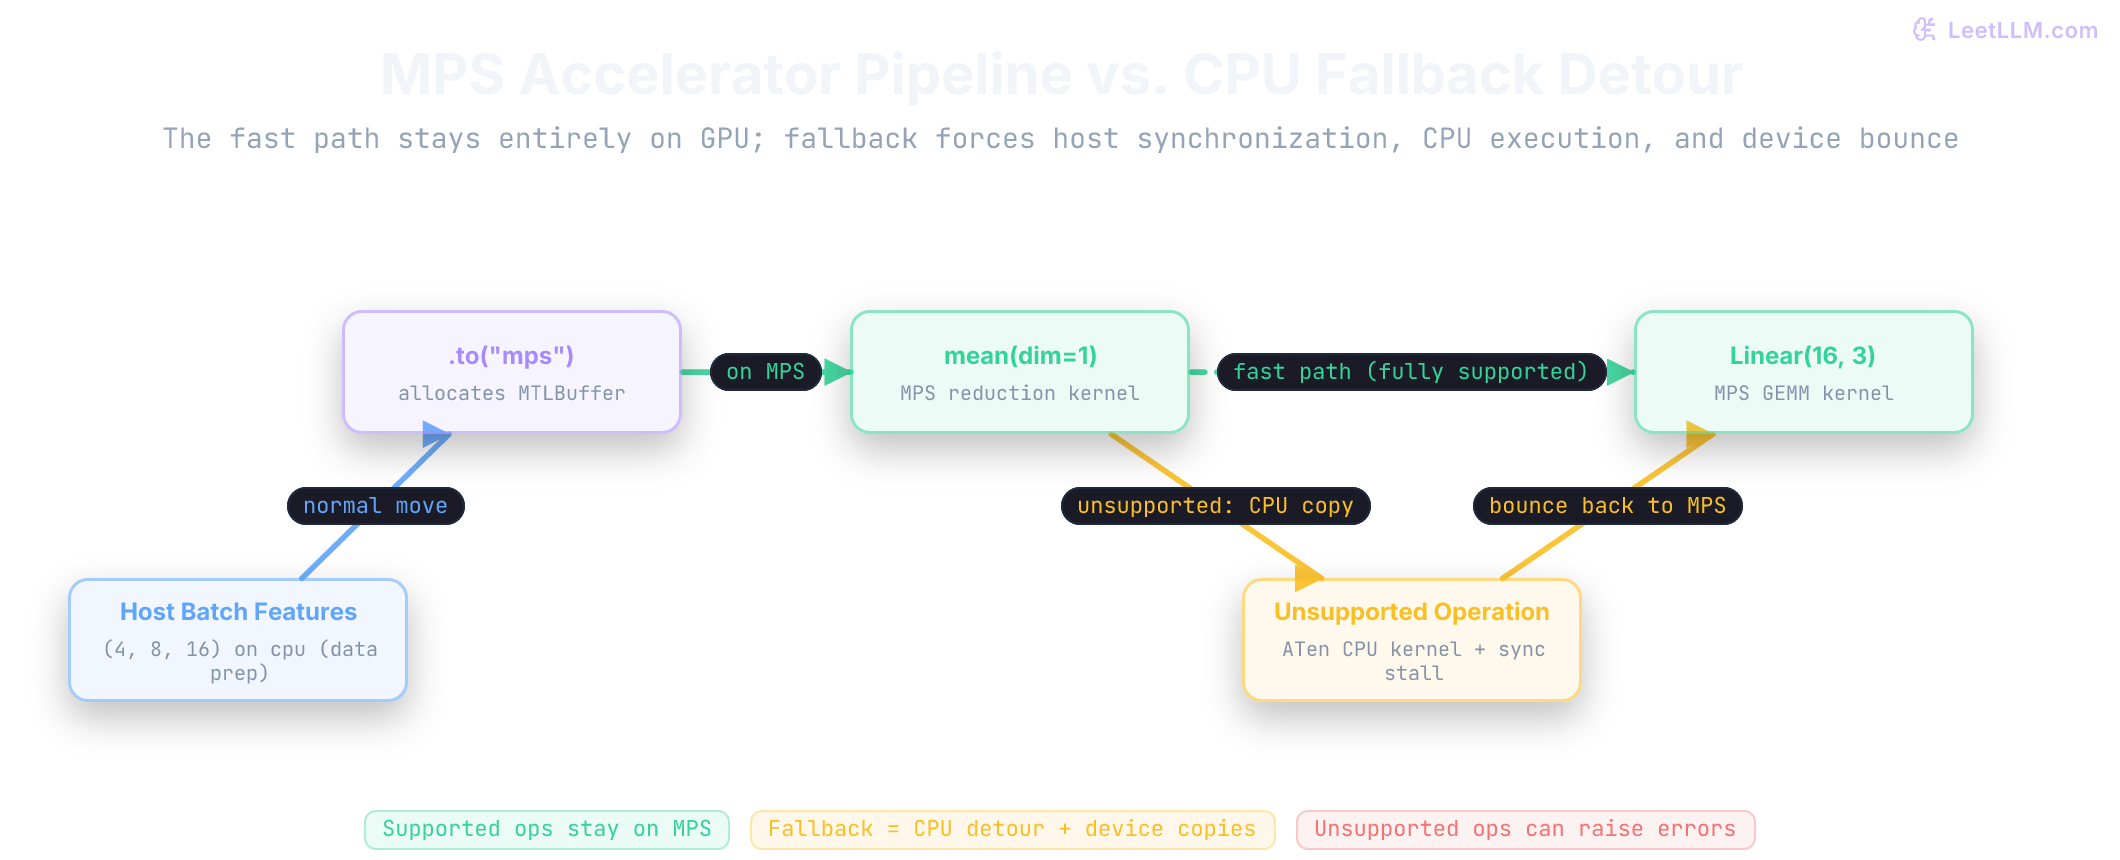
Suppose one operation has no MPS implementation. A valid training loop can stop at that line. PyTorch exposes PYTORCH_ENABLE_MPS_FALLBACK=1 so unsupported MPS operations can run on CPU instead of failing immediately.[3] Treat that flag as a temporary compatibility aid, not a promise that every unsupported operation will work. Set it before the process loads PyTorch.
1PYTORCH_ENABLE_MPS_FALLBACK=1 python train.pyPutting os.environ["PYTORCH_ENABLE_MPS_FALLBACK"] = "1" after import torch is often a no-op, because the C++ backend reads that state at initialization.
Fallback keeps debugging unblocked, but it can hide a CPU detour inside the accelerator path. That detour may add synchronization, device conversion, and copy work even though CPU and GPU share physical memory. If one hot operation keeps falling back, throughput can collapse while the script still looks correct.
CPU work isn't automatically fallback. Tokenization and batch assembly normally happen on CPU before .to("mps"). MPS fallback means a PyTorch operation on the accelerator path has no MPS implementation and runs on CPU instead.
Your tokenizer runs on CPU before ticket_batch.to("mps"). Is that MPS fallback?
Answer
No. CPU-side batch assembly before the device move is normal. MPS fallback happens when an unsupported PyTorch operation on the accelerator path runs on CPU instead of mps.
Use fallback to identify the blocking operation. Then remove the flag and choose deliberately: rewrite that operation, try a newer supported PyTorch release, keep the full workload on CPU, or accept the measured detour. The question is no longer "does it run?" but "where did the step leave MPS, and is that cost acceptable?"
Keep precision changes measurable
The examples so far use float32. Keep that as the correctness baseline before trying lower precision. Ask what success would mean before changing dtype: finite loss, unchanged evaluation behavior, lower memory, or a faster synchronized step? A blanket model.half() changes every floating-point parameter, including operations that may need more range, and makes numerical failures harder to localize.
PyTorch's automatic mixed precision (AMP) API chooses dtypes per operation. Its documentation recommends leaving model and inputs in their normal dtype, wrapping the forward pass and loss with torch.autocast, and using gradient scaling when float16 training needs it.[8] The official AMP examples are written for CUDA and CPU. On Mac, ask the installed build whether autocast is available for mps before copying a CUDA AMP snippet:
1from contextlib import nullcontext
2
3import torch
4
5device = torch.device("mps" if torch.backends.mps.is_available() else "cpu")
6model = torch.nn.Linear(8, 3).to(device)
7features = torch.randn(4, 8, device=device)
8
9use_mps_amp = (
10    device.type == "mps"
11    and torch.amp.autocast_mode.is_autocast_available("mps")
12)
13precision_context = (
14    torch.autocast(device_type="mps", dtype=torch.float16)
15    if use_mps_amp
16    else nullcontext()
17)
18
19with precision_context:
20    logits = model(features)
21    loss = logits.square().mean()
22
23print("device:", device.type)
24print("MPS autocast enabled:", use_mps_amp)
25print("logits dtype:", logits.dtype)
26print("finite loss:", bool(torch.isfinite(loss).item()))
On a compatible Mac, this probe tells you whether the installed release enables MPS autocast and which dtype reached the logits. It doesn't prove the full training job is stable. Compare loss curves or evaluation metrics with the float32 baseline, then compare synchronized step time and peak memory. If results become non-finite or accuracy shifts, return to float32 before changing anything else. The later Mixed Precision Training lesson develops autocast and gradient scaling in depth.
Time and profile MPS work
The Mac timing trap looks like the CUDA timing trap. A host timer can report 3 ms while MPS still has 35 ms of queued work. Warm up the operation first, then synchronize before and after the measured block. PyTorch exposes torch.mps.synchronize() for that boundary.[7]
1import time
2import torch
3
4device = torch.device("mps" if torch.backends.mps.is_available() else "cpu")
5x = torch.randn(256, 256, device=device)
6w = torch.randn(256, 256, device=device)
7
8for _ in range(3):
9    y = x @ w
10if device.type == "mps":
11    torch.mps.synchronize()
12
13start = time.perf_counter()
14for _ in range(10):
15    y = x @ w
16if device.type == "mps":
17    torch.mps.synchronize()
18elapsed_ms = (time.perf_counter() - start) * 1000
19
20print("timed matmuls:", 10)
21print("result shape:", tuple(y.shape))
22print(f"{device.type}: {elapsed_ms / 10:.3f} ms per matmul")
Expect timed matmuls: 10, result shape: (256, 256), and a measured number of milliseconds per multiplication. That number depends on the Mac, PyTorch build, and other work. It includes Python dispatch and the final wait, but excludes input allocation and the CPU-to-device move. Repeat the block and compare several measurements; one tiny run doesn't establish a winner.
The same hidden sync points still matter:
loss.item()whenlossis an MPS tensortensor.cpu(), includingtensor.cpu().numpy()for NumPy analysis- printing values that must come back to host memory
Calling .numpy() directly on an MPS tensor isn't the route back to NumPy: move the data to CPU first.
1import torch
2
3device = torch.device("mps" if torch.backends.mps.is_available() else "cpu")
4loss = torch.tensor(2.5, device=device)
5reported_loss = loss.detach().cpu().item()
6
7print(f"reported loss: {reported_loss:.1f}")1reported loss: 2.5Don't trust timing claims until you know whether the host waited for the device. Compare CPU and MPS on the same Mac, with the same shapes, dtype, warmup, and number of steps. An available GPU isn't proof that a tiny (4, 8, 16) step is faster there.
When a timer says the step is slow
A synchronized timer tells you whether the step is slow. A trace helps explain where time went. PyTorch's MPS profiler emits operating-system signposts that Xcode Instruments can record and display.[7] Once timing proves a problem, profile the steady-state region rather than the setup path.
After opening Instruments with an OS Signpost or Logging trace, wrap only the steady-state region you want to inspect:
1import torch
2
3if not torch.backends.mps.is_available():
4    raise SystemExit("Run this profiler example on an MPS-capable Mac")
5
6x = torch.randn(256, 256, device="mps")
7w = torch.randn(256, 256, device="mps")
8
9for _ in range(3):
10    y = x @ w
11torch.mps.synchronize()
12
13with torch.mps.profiler.profile(
14    mode="interval",
15    wait_until_completed=False,
16):
17    for _ in range(10):
18        y = x @ w
19torch.mps.synchronize()
20print("profiled matmuls:", 10)1profiled matmuls: 10Keep wait_until_completed=False for a representative trace. Setting it to True waits after each encoded operation, which can make individual dispatches easier to inspect but changes the performance you're trying to understand. Look for long gaps between operations, many tiny dispatches, and CPU detours before guessing at a fix.[7]
Memory pressure on Apple GPUs
The first memory lesson is the same as CUDA: weights aren't the whole bill. Activations, gradients, optimizer state, and temporary workspaces matter too. If empty_cache() releases bytes but the next batch still fails, live tensors or the workload peak are the likely boundary, not a stale cache alone.
Unified memory adds one twist. There isn't a separate video-memory pool: a large run competes for system memory with macOS and every other app. PyTorch exposes current_allocated_memory() for bytes occupied by live tensors, driver_allocated_memory() for total memory allocated by Metal for the process (including cached allocator blocks and MPS/MPSGraph allocations), and empty_cache() to release unoccupied cached memory.[7] empty_cache() doesn't free tensors that are still alive, so it can't repair a workload whose real peak exceeds the limit.
Inspect those counters only after MPS is available:
1import torch
2
3if torch.backends.mps.is_available():
4    before = torch.mps.current_allocated_memory()
5    tensor = torch.ones(1024, 1024, device="mps")
6    after = torch.mps.current_allocated_memory()
7    del tensor
8    torch.mps.empty_cache()
9    print("live tensor allocation increased:", after > before)
10    print("recommended limit reported:", torch.mps.recommended_max_memory() > 0)
11else:
12    print("MPS allocator counters need an available mps device")
Use the symptom to choose the first experiment, not an allocator knob:
| Symptom | First question | First fix |
|---|---|---|
| OOM on first real batch | Is batch or sequence length too large? | shrink batch size first |
| Step time swings wildly | Are unsupported ops or sync points bouncing work back to CPU? | check fallback and logging paths |
| MPS allocator errors | Are you near working-set limits? | reduce workload before touching allocator env vars |
| macOS starts swapping | Is training competing with other memory-heavy apps? | stop the run, reduce workload, then close unneeded apps |
PyTorch also exposes MPS-specific allocator controls such as PYTORCH_MPS_HIGH_WATERMARK_RATIO and PYTORCH_MPS_LOW_WATERMARK_RATIO. The documented high-watermark default, 1.7, is a multiple of Metal's recommended working-set size, not 170% of your Mac's installed RAM. The low watermark triggers allocator cleanup and adaptive command-buffer commits; it isn't extra memory.[3] These are advanced tuning controls. Disabling the high watermark (0.0) can cause system failure under system-wide out-of-memory conditions. Start by shrinking work.
For the larger (32, 128, 768) budget, start with the smallest reversible workload change:
- lower per-step batch size before touching allocator ratios
- shorten sequence length if the task allows it
- remove needless
.cpu()calls before blaming Metal - confirm fallback isn't firing inside the hot path
1batch_size = 32
2sequence_length = 128
3baseline_positions = batch_size * sequence_length
4
5for label, batch, tokens in [
6    ("baseline", 32, 128),
7    ("half batch", 16, 128),
8    ("half length", 32, 64),
9]:
10    share = (batch * tokens) / baseline_positions
11 print(f"{label:11s}: {share:.0%} of token positions")1baseline : 100% of token positions
2half batch : 50% of token positions
3half length: 50% of token positionsMemory lever: Both changes halve token positions and many activation tensors. Shorter sequences can reduce attention score tensors faster because attention has two sequence axes.
Diagnose by symptom, not by backend name
An "MPS is slow" report isn't a diagnosis. Start with the smallest failing batch and preserve its shape, dtype, device, and PyTorch version. Those four facts separate placement, operator coverage, precision, timing, and capacity failures that otherwise look identical.
| Observed symptom | Most likely boundary to check first | Evidence to collect |
|---|---|---|
is_built() or is_available() is false | package, hardware, or macOS | both booleans, torch.__version__, sw_vers |
| forward pass reports mixed devices | placement | model parameter device and every batch tensor device |
| run needs the fallback flag | operator coverage | exact unsupported operator and PyTorch version |
loss becomes NaN after precision change | numerical range | dtype, first non-finite step, float32 baseline |
| host timer looks impossibly fast | asynchronous execution | warmup plus synchronized timing |
| allocator OOMs or macOS swaps | live workload and system pressure | batch shape, both MPS memory counters, open-app pressure |
You're on an Apple silicon Mac. torch.backends.mps.is_built() is True, but torch.backends.mps.is_available() is False. What does that tell you first?
Answer
PyTorch knows how to speak to the MPS backend, but current machine state still blocks usage. Check macOS version, hardware support, runtime access, and install path before blaming your model code.
Your training loop "works" only with PYTORCH_ENABLE_MPS_FALLBACK=1, but step time is awful. What's most likely happening?
Answer
One or more operations are running through CPU fallback. The script survives, but repeated backend switches, synchronization, or unsupported hot-path ops are erasing GPU gains.
Dispatch overhead and the MPS crossover point
For a final experiment, run the timing example on CPU and MPS without changing its shapes or dtype. Record both measurements, then try a moderately larger matrix (such as or ).
A tiny operation can favor CPU because launching GPU work adds overhead. Python dispatch, Metal command encoding, and queue submission all contribute costs; their sizes depend on the operation, backend, and batching. A small matrix multiplication may finish on CPU before the GPU path repays those costs. Measure that crossover on your Mac rather than assigning it a universal matrix size.
For a dense matrix multiplication, the arithmetic grows as . A fixed launch cost becomes a smaller share as the work grows, so the GPU may become faster. Actual dispatch cost and kernel choice aren't guaranteed to stay constant. If MPS lags behind CPU, size is one hypothesis; precision, kernel implementation, memory pressure, and other running work can also explain it. Change one size at a time and compare warmed-up, synchronized measurements.
When a real model behaves differently from this small classifier, keep the diagnosis specific. A mixed-device error calls for placement checks. An unsupported operator calls for a compatibility decision. A slow but correct run calls for synchronized timing and, if needed, an Instruments signpost trace. Unified memory changes where allocations physically reside, but keeping devices aligned, kernels running on accelerator, and queues measured honestly remains the engineering contract.