Personalize this lesson
Adapt explanations and teaching visuals to your background and preferred voice.
A bright hairline mark cuts diagonally across an equipment panel photo. Shift that mark two pixels right, and any capable inspector still recognizes the scratch. A model that memorizes absolute pixel coordinates breaks on that tiny shift because each coordinate feeds a separate learned weight.
The previous lesson fed named tabular features into dense layers. Their order had to match the weight columns. Images add a useful structure: nearby pixels form edges, corners, and textures. Flattening preserves every pixel value and can be reversed if you know the shape; a dense layer simply doesn't impose local neighborhoods or shared detectors on that vector.
Convolutional neural networks tackle this challenge through two ideas: local receptive fields and weight sharing.[1][2] We trace one 4 x 4 panel crop through hand calculations, tensor dimensions, pooling layers, and a matching PyTorch forward pass to see how raw pixels turn into class scores.
Make reuse pay for itself
Suppose the inspection camera resizes images to 224 x 224 RGB pixels. Each pixel holds red, green, and blue intensities, giving three channels. Connecting that input to a modest hidden layer of 256 dense units gives every single unit a distinct weight for every pixel intensity.
A convolutional layer replaces that global wiring with localized detectors. Instead of observing all 150,528 numbers at once, a 3 x 3 RGB detector inspects a small window of 3 x 3 x 3 = 27 weights plus one bias scalar. That exact detector slides across every valid position in the image.
1height, width, channels, hidden = 224, 224, 3, 256
2dense_weights = height * width * channels * hidden
3dense_biases = hidden
4dense_parameters = dense_weights + dense_biases
5
6filters, kernel = 16, 3
7conv_weights = filters * channels * kernel * kernel
8conv_biases = filters
9conv_parameters = conv_weights + conv_biases
10
11print(f"dense parameters: {dense_parameters:,} ({dense_weights:,} weights + {dense_biases} biases)")
12print(f"conv parameters: {conv_parameters:,} ({conv_weights:,} weights + {conv_biases} biases)")
13print(f"parameter-count ratio: {dense_parameters / conv_parameters:,.0f}x")1dense parameters: 38,535,424 (38,535,168 weights + 256 biases)
2conv parameters: 448 (432 weights + 16 biases)
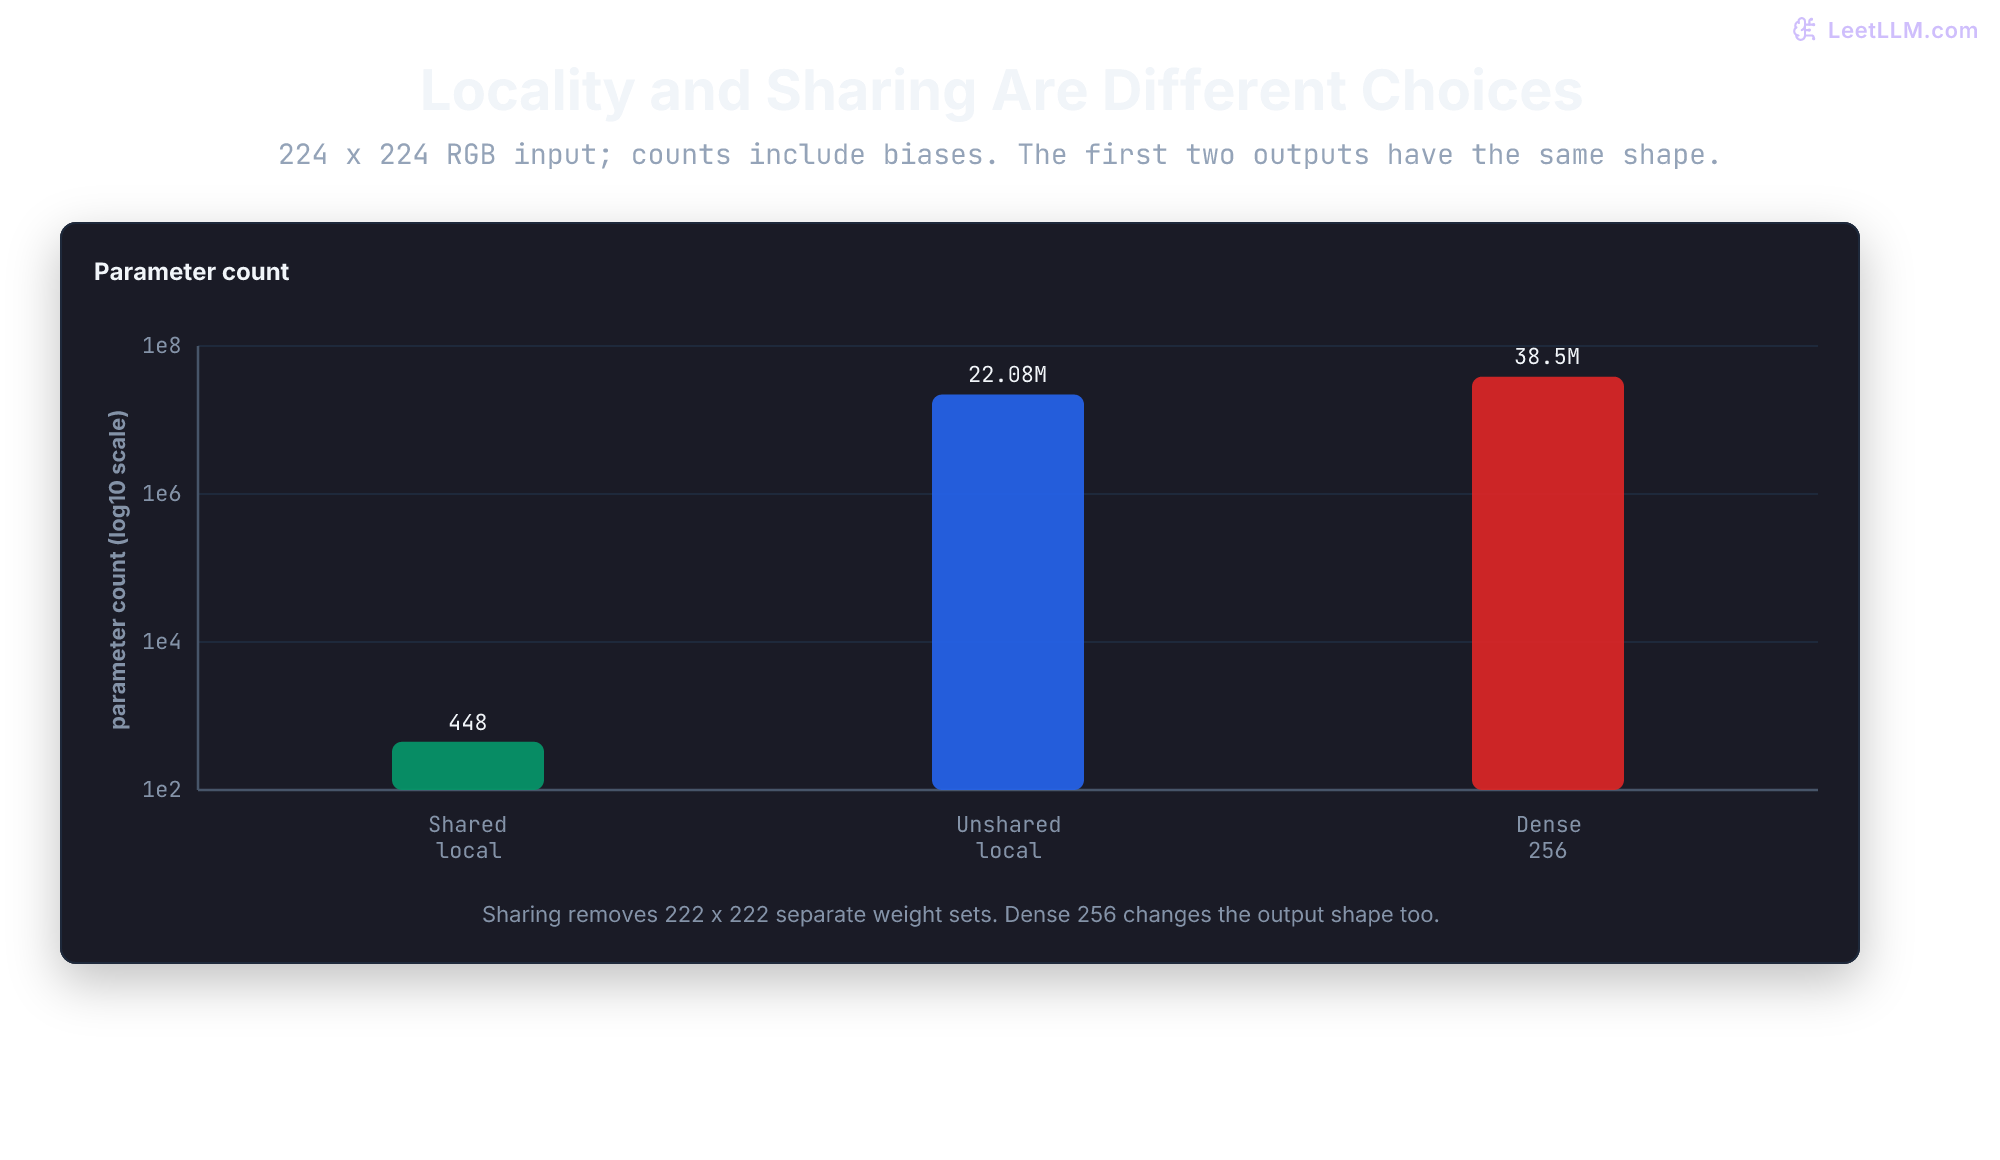
3parameter-count ratio: 86,017xThe dense layer has over 38.5 million parameters; the convolutional layer uses 448. The ratio is about 86,000, but the outputs and connections differ: 256 global dense values versus sixteen 222 x 222 local feature maps. This isn't the same function implemented with fewer parameters or a measured speedup.
Two architectural choices drive this reduction: local connectivity and weight sharing. Local connectivity restricts each output neuron to a tiny spatial neighborhood. Weight sharing reuses the identical set of weights across every spatial position.
To isolate the contribution of weight sharing, consider a locally connected layer with sixteen 3 x 3 RGB filters that doesn't share weights across positions. Without padding, the output grid has 222 x 222 positions. Giving each position its own private weights balloons the count to 222 * 222 * 448 = 22,079,232 parameters. Weight sharing compresses those 22 million parameters down to 448 without altering the output dimensions.
Beyond parameter savings, weight sharing introduces a mathematical property called translation equivariance. Formally, an operation is equivariant to translation operator when shifting the input produces an identically shifted feature map:
For stride-one convolution away from boundary effects, shifting a pattern three pixels right shifts its response three pixels right. The same detector is reused at each position. On a finite crop, padding and a pattern entering or leaving the image can break that exact equality. With stride greater than one, arbitrary pixel shifts also change alignment with the sampling grid.
Equivariance differs from translation invariance, where produces an unchanged output. Local pooling can provide some shift tolerance, but a classification head isn't automatically invariant. Global spatial averaging is unchanged by a rearrangement of its input feature-map values; a translated finite image needn't produce such a rearrangement because of boundaries and downsampling.
Let one detector find one pattern
Examine a concrete grayscale crop representing a small defect on a dark metallic surface. Values range between 0.0 (dark surface) and 1.0 (bright scratch). Four bright values form a central 2 x 2 mark surrounded by background:
| Input crop | Column 1 | Column 2 | Column 3 | Column 4 |
|---|---|---|---|---|
| Row 1 | 0.05 | 0.08 | 0.06 | 0.07 |
| Row 2 | 0.12 | 0.92 | 0.88 | 0.09 |
| Row 3 | 0.08 | 0.90 | 0.93 | 0.11 |
| Row 4 | 0.06 | 0.07 | 0.09 | 0.05 |
Select a 3 x 3 filter, also called a kernel. This kernel rewards bright middle rows while penalizing brightness in adjacent rows, acting as a horizontal line and ridge detector:
| Kernel | Column 1 | Column 2 | Column 3 |
|---|---|---|---|
| Row 1 | -0.6 | -0.6 | -0.6 |
| Row 2 | 1.1 | 1.1 | 1.1 |
| Row 3 | -0.6 | -0.6 | -0.6 |
Placing a 3 x 3 window over a 4 x 4 grid yields 4 - 3 + 1 = 2 valid starting rows and 2 valid starting columns, producing a 2 x 2 output feature map.
Assuming zero bias for this trace, overlay the kernel on the upper-left 3 x 3 patch covering rows 0 to 2 and columns 0 to 2. Multiply aligned values elementwise and sum the products:
The middle row contributes +2.112, exceeding the combined negative contributions from the neighboring rows (-0.114 and -1.146). The response before any activation function is 0.852.
1patch = (
2    (0.05, 0.08, 0.06),
3    (0.12, 0.92, 0.88),
4    (0.08, 0.90, 0.93),
5)
6kernel = (
7    (-0.6, -0.6, -0.6),
8    (1.1, 1.1, 1.1),
9    (-0.6, -0.6, -0.6),
10)
11
12row_contributions = [
13    round(sum(pixel * weight for pixel, weight in zip(row, kernel_row)), 3)
14    for row, kernel_row in zip(patch, kernel)
15]
16response = sum(
17    pixel * weight
18    for row, kernel_row in zip(patch, kernel)
19    for pixel, weight in zip(row, kernel_row)
20)
21
22print(f"row contributions: {row_contributions}")
23print(f"first response: {response:.3f}")1row contributions: [-0.114, 2.112, -1.146]
2first response: 0.852Slide the identical kernel across the remaining three positions. Each placement computes an inner product between kernel weights and the aligned image window:
| Window | Crop rows, cols | Response |
|---|---|---|
| Top left | 0:3, 0:3 | 0.852 |
| Top right | 0:3, 1:4 | 0.789 |
| Bottom left | 1:4, 0:3 | 0.817 |
| Bottom right | 1:4, 1:4 | 0.874 |
The bottom-right window yields 0.874, the highest activation on the grid. Its window aligns most favorably with the bright pixels in rows 2 and 3.
1import numpy as np
2
3image = np.array([
4    [0.05, 0.08, 0.06, 0.07],
5    [0.12, 0.92, 0.88, 0.09],
6    [0.08, 0.90, 0.93, 0.11],
7    [0.06, 0.07, 0.09, 0.05],
8])
9kernel = np.array([
10    [-0.6, -0.6, -0.6],
11    [1.1, 1.1, 1.1],
12    [-0.6, -0.6, -0.6],
13])
14
15def convolve_valid(image: np.ndarray, kernel: np.ndarray) -> np.ndarray:
16    out_height = image.shape[0] - kernel.shape[0] + 1
17    out_width = image.shape[1] - kernel.shape[1] + 1
18    output = np.empty((out_height, out_width))
19    for row in range(out_height):
20        for col in range(out_width):
21            window = image[row:row + kernel.shape[0], col:col + kernel.shape[1]]
22            output[row, col] = np.sum(window * kernel)
23    return output
24
25feature_map = convolve_valid(image, kernel)
26strongest = tuple(int(pos) for pos in np.unravel_index(np.argmax(feature_map), feature_map.shape))
27print(np.round(feature_map, 3))
28print("strongest response:", strongest)1[[0.852 0.789]
2 [0.817 0.874]]
3strongest response: (1, 1)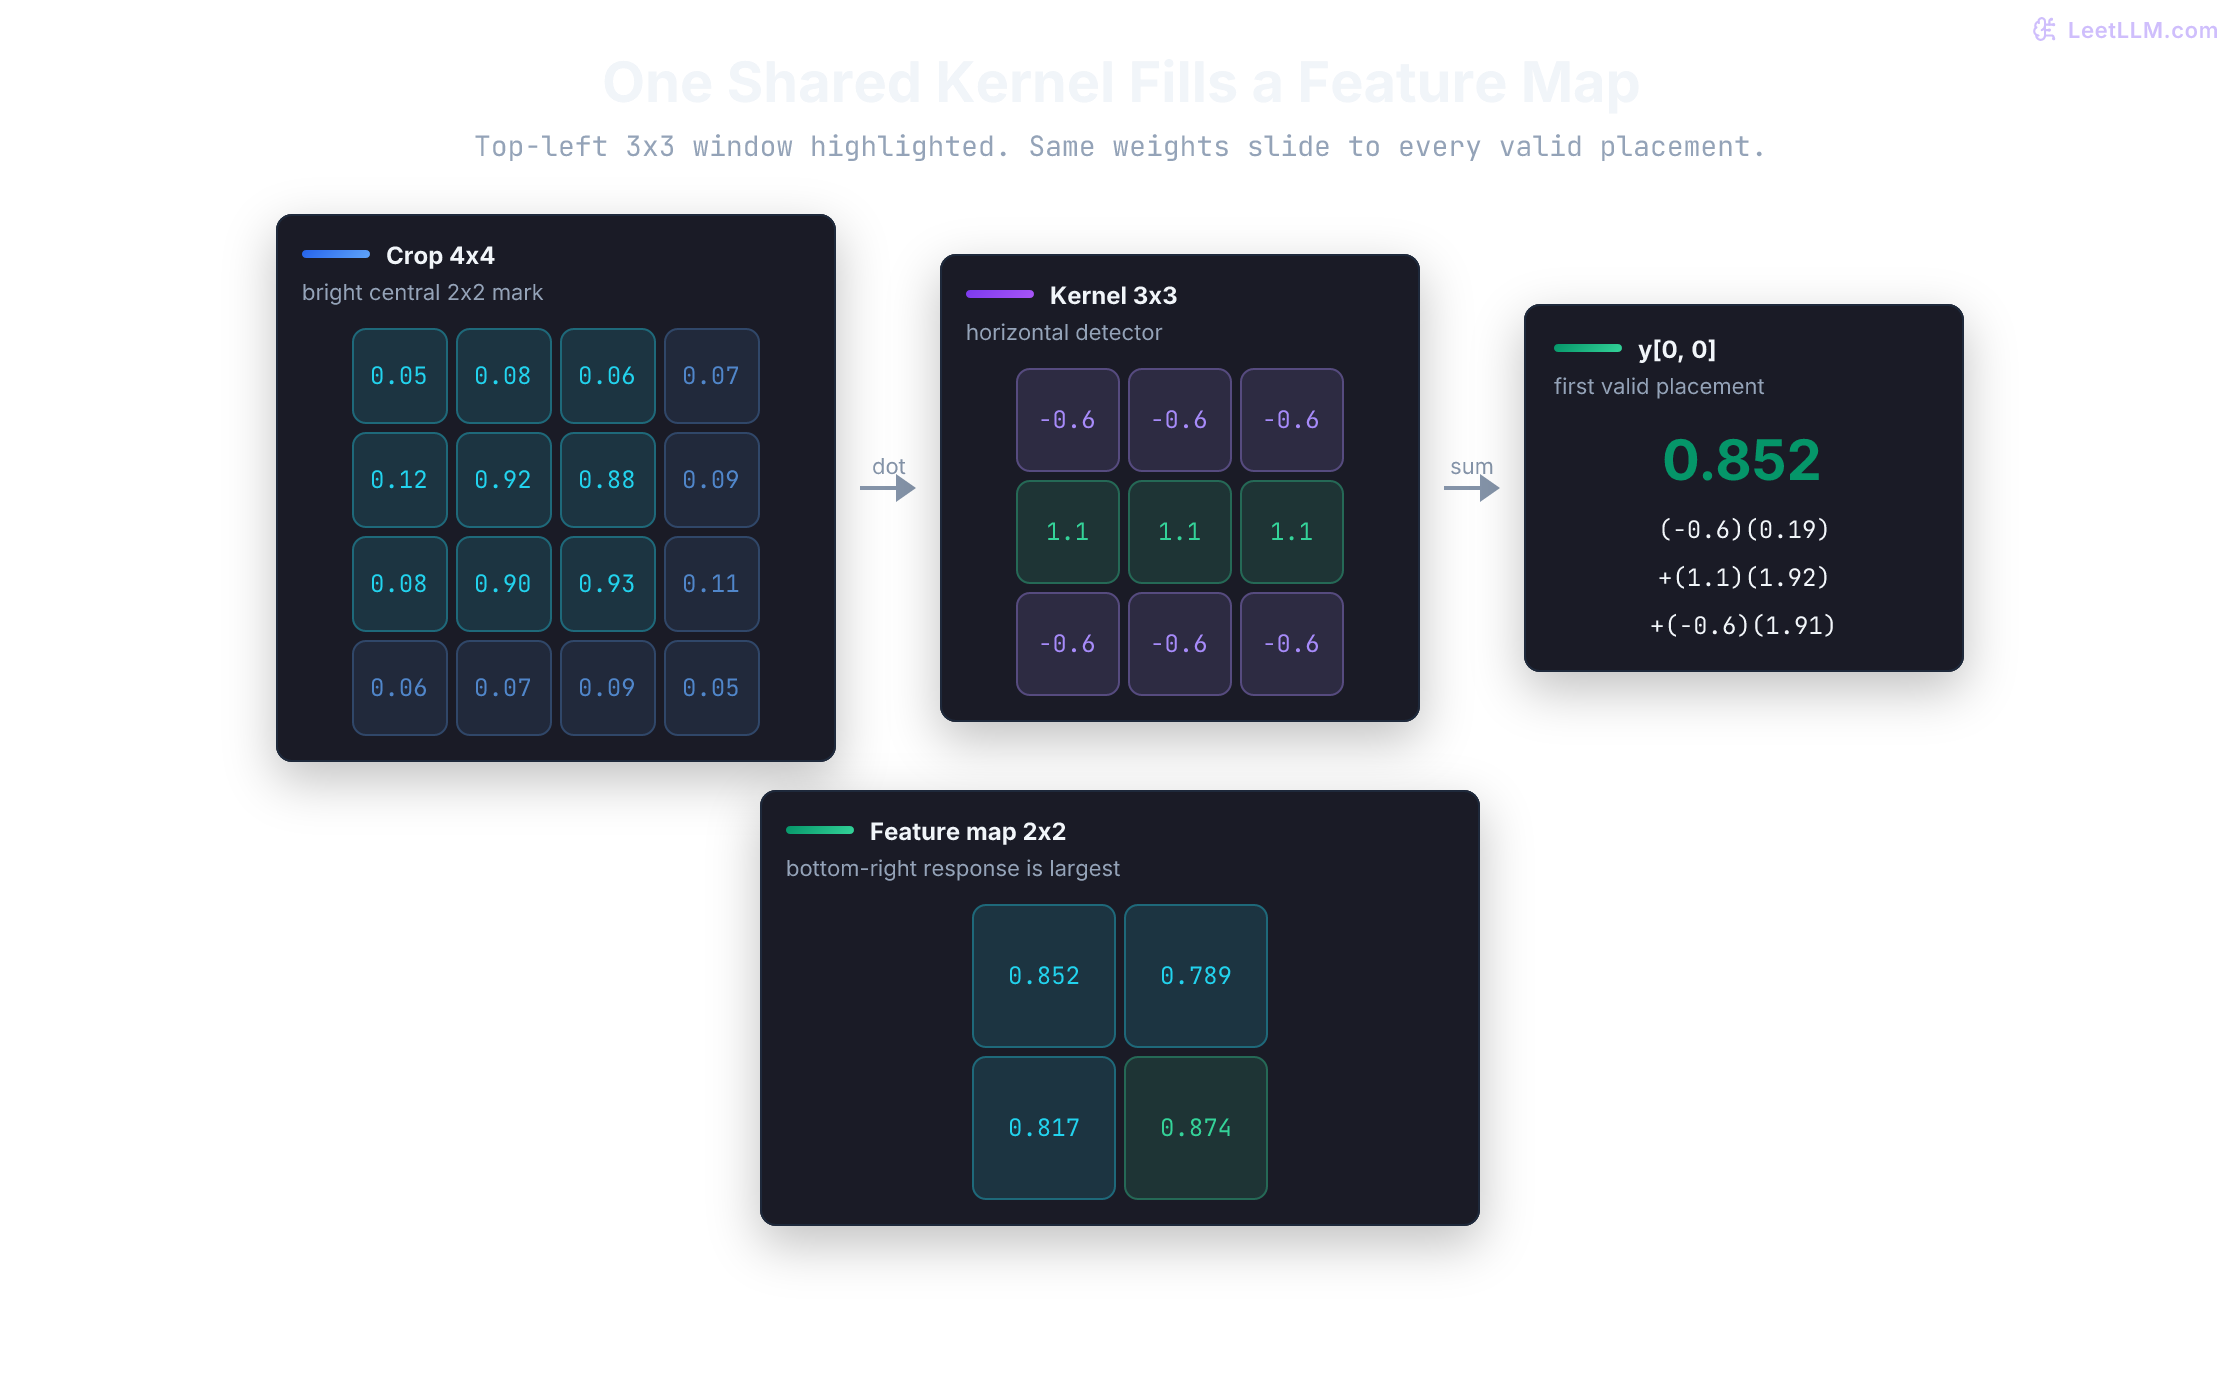
Mathematical convolution flips the kernel horizontally and vertically before computing these sliding sums. PyTorch uses cross-correlation, with no flip.[2] [3] For freely learned filters, flipping changes the parameter convention rather than the set of representable operations. For a fixed or imported asymmetric kernel, the distinction changes its responses. Our vertically symmetric kernel happens to give the same result either way.
Shapes, channels, and padding contracts
Moving beyond single-channel crops requires tracking dimensions across stride, padding, dilation, and channel depth.
For an input spatial dimension , kernel size , padding , stride , and dilation rate , the output spatial dimension is:
When dilation (standard dense sampling), the effective kernel size equals , simplifying the formula to:
The floor operation rounds down, discarding incomplete windows that hang off the edge of the padded input tensor.
Padding controls border behavior:
- Valid padding (): No padding added. At stride one, the spatial dimension shrinks by , or just when dilation is one.
- Same padding at stride one: Choose padding so . With dilation one and an odd kernel, symmetric padding works: one pixel for a
3 x 3kernel, two for5 x 5. Dilation changes the required total padding to ; an odd total needs unequal padding on the two sides. PyTorch'spadding='same'supports only stride one.[3]
Dilation () inserts spaces between kernel elements without adding learned parameters. A kernel with dilation spans a receptive footprint while retaining only 9 parameter weights.
1def conv_size(size: int, kernel: int, stride: int = 1, padding: int = 0, dilation: int = 1) -> int:
2    if size <= 0 or kernel <= 0 or stride <= 0 or padding < 0 or dilation <= 0:
3        raise ValueError("size, kernel, stride, and dilation must be positive; padding cannot be negative")
4    effective_kernel = dilation * (kernel - 1) + 1
5    if effective_kernel > size + 2 * padding:
6        raise ValueError("effective kernel cannot exceed padded input size")
7    return (size + 2 * padding - effective_kernel) // stride + 1
8
9configurations = [
10    ("worked crop", 4, 3, 1, 0, 1),
11    ("same-size crop", 4, 3, 1, 1, 1),
12    ("strided screenshot", 224, 3, 2, 1, 1),
13    ("dilated feature map", 28, 3, 1, 0, 2),
14]
15
16for name, size, kernel, stride, padding, dilation in configurations:
17    output = conv_size(size, kernel, stride, padding, dilation)
18 print(f"{name}: {size} -> {output}")1worked crop: 4 -> 2
2same-size crop: 4 -> 4
3strided screenshot: 224 -> 112
4dilated feature map: 28 -> 24Channels introduce a third dimension. In the ordinary groups=1 convolution used here, one filter has shape and spans all three RGB channels.
At each spatial stop, the filter computes a three-dimensional inner product across all channels and sums them into a single scalar response, adding one bias term. To generate distinct output feature maps, the layer uses separate filters, yielding a parameter tensor of shape plus biases.
1import numpy as np
2
3image = np.zeros((3, 224, 224))
4filters = np.zeros((16, 3, 3, 3))
5biases = np.zeros(16)
6
7assert filters.shape[1] == image.shape[0]
8print("input shape:", image.shape)
9print("one filter shape:", filters[0].shape)
10print("output channels:", filters.shape[0])
11print("parameters including biases:", filters.size + biases.size)1input shape: (3, 224, 224)
2one filter shape: (3, 3, 3)
3output channels: 16
4parameters including biases: 448For a PyTorch batch with dimensions ordered NCHW (batch, channels, height, width), filters map to . Input and output channel counts can differ. Grouped convolution changes connectivity: each filter sees channels, and both input and output counts must be divisible by the group count .[3] NCHW describes axis order here, not a required physical memory layout.
Receptive fields and channel expansion
An activation in the first feature map sees a small input window. Stacking a second convolution layer enables each second-layer activation to view a patch of the first feature map. That patch depends on a region of the original input.
The input region that influences a specific unit's activation is its receptive field. Tracking receptive field expansion across layers requires tracking two state variables:[4]
field: the side length of the receptive field in raw input pixel units.jump: the distance between adjacent activation centers in raw input pixel units.
For a layer with kernel size , stride , and dilation , its effective kernel span is :
All layers in this trace have dilation one. field describes the theoretical footprint, not a guarantee that every pixel contributes equally or even has a nonzero local gradient:
1layers = [
2    ("conv 3x3", 3, 1),
3    ("conv 3x3", 3, 1),
4    ("pool 2x2", 2, 2),
5    ("conv 3x3", 3, 1),
6]
7
8field, jump = 1, 1
9for name, kernel, stride in layers:
10    field = field + (kernel - 1) * jump
11    jump = jump * stride
12 print(f"{name:9s} receptive field={field:2d}, jump={jump}")1conv 3x3 receptive field= 3, jump=1
2conv 3x3 receptive field= 5, jump=1
3pool 2x2 receptive field= 6, jump=2
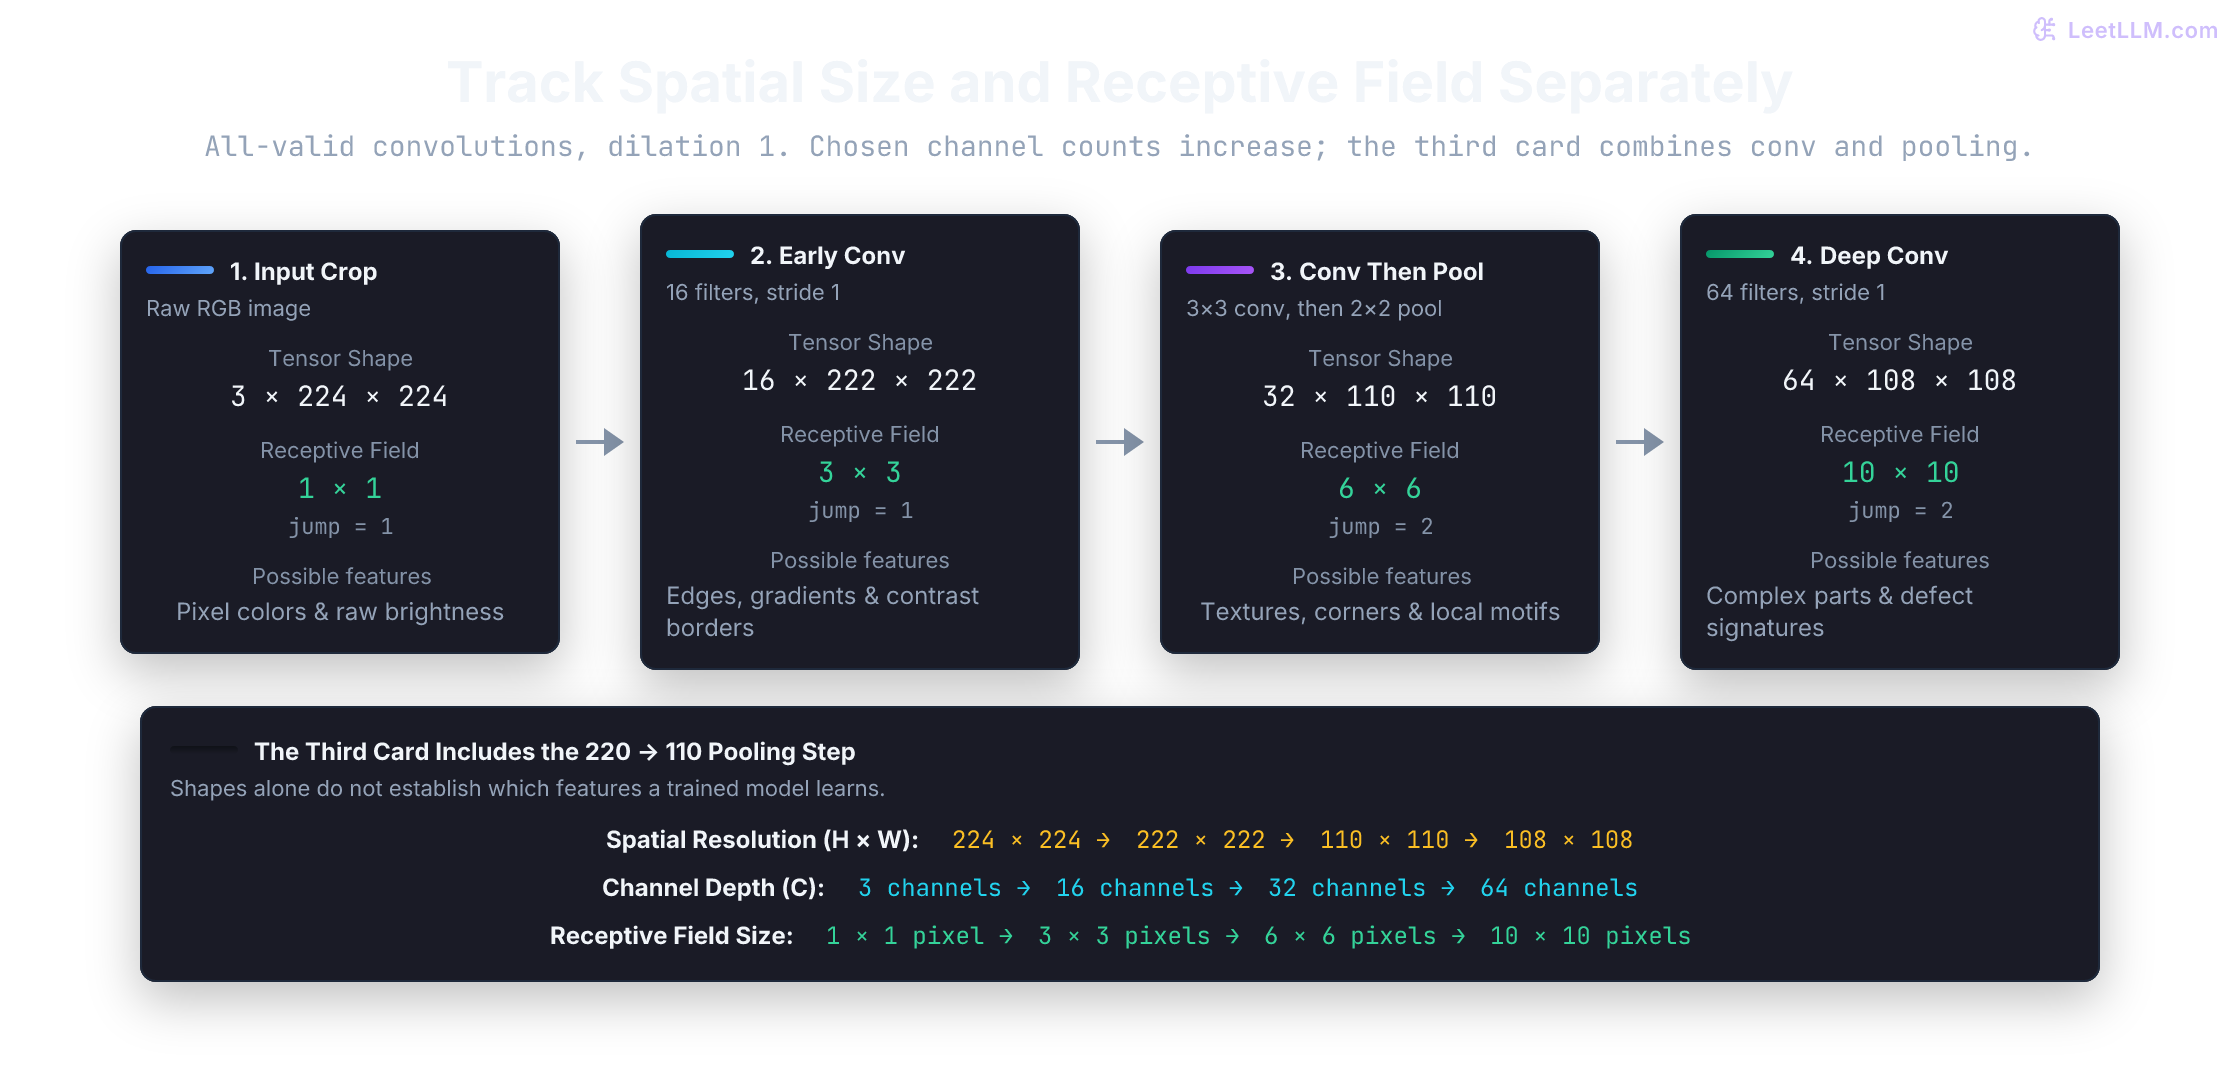
4conv 3x3 receptive field=10, jump=2Notice how pooling accelerates receptive field growth. A stride of 2 doubles the jump to 2. The subsequent convolution expands the receptive field by input pixels rather than 2, reaching a context window.
Many classification backbones reduce spatial resolution and increase channel count across stages, though the exact progression varies by architecture. More channels can hold more distinct feature responses; they aren't a necessary consequence of downsampling. The figure below uses an illustrative all-valid sequence matching our receptive-field calculation: convolution, convolution, pooling, then convolution.
Early activations depend on small neighborhoods; later activations can combine evidence across larger regions. A trained model may learn edge-like early filters and more complex combinations later, but the shapes alone don't establish what features it learned. Downsampling also loses detail, which matters when the defect is only a few pixels wide.
Pooling mechanisms and gradient routing
Downsampling feature maps reduces computation while expanding receptive fields. Pooling achieves this downsampling without introducing learnable weights.
Two primary pooling strategies dominate convolutional networks:
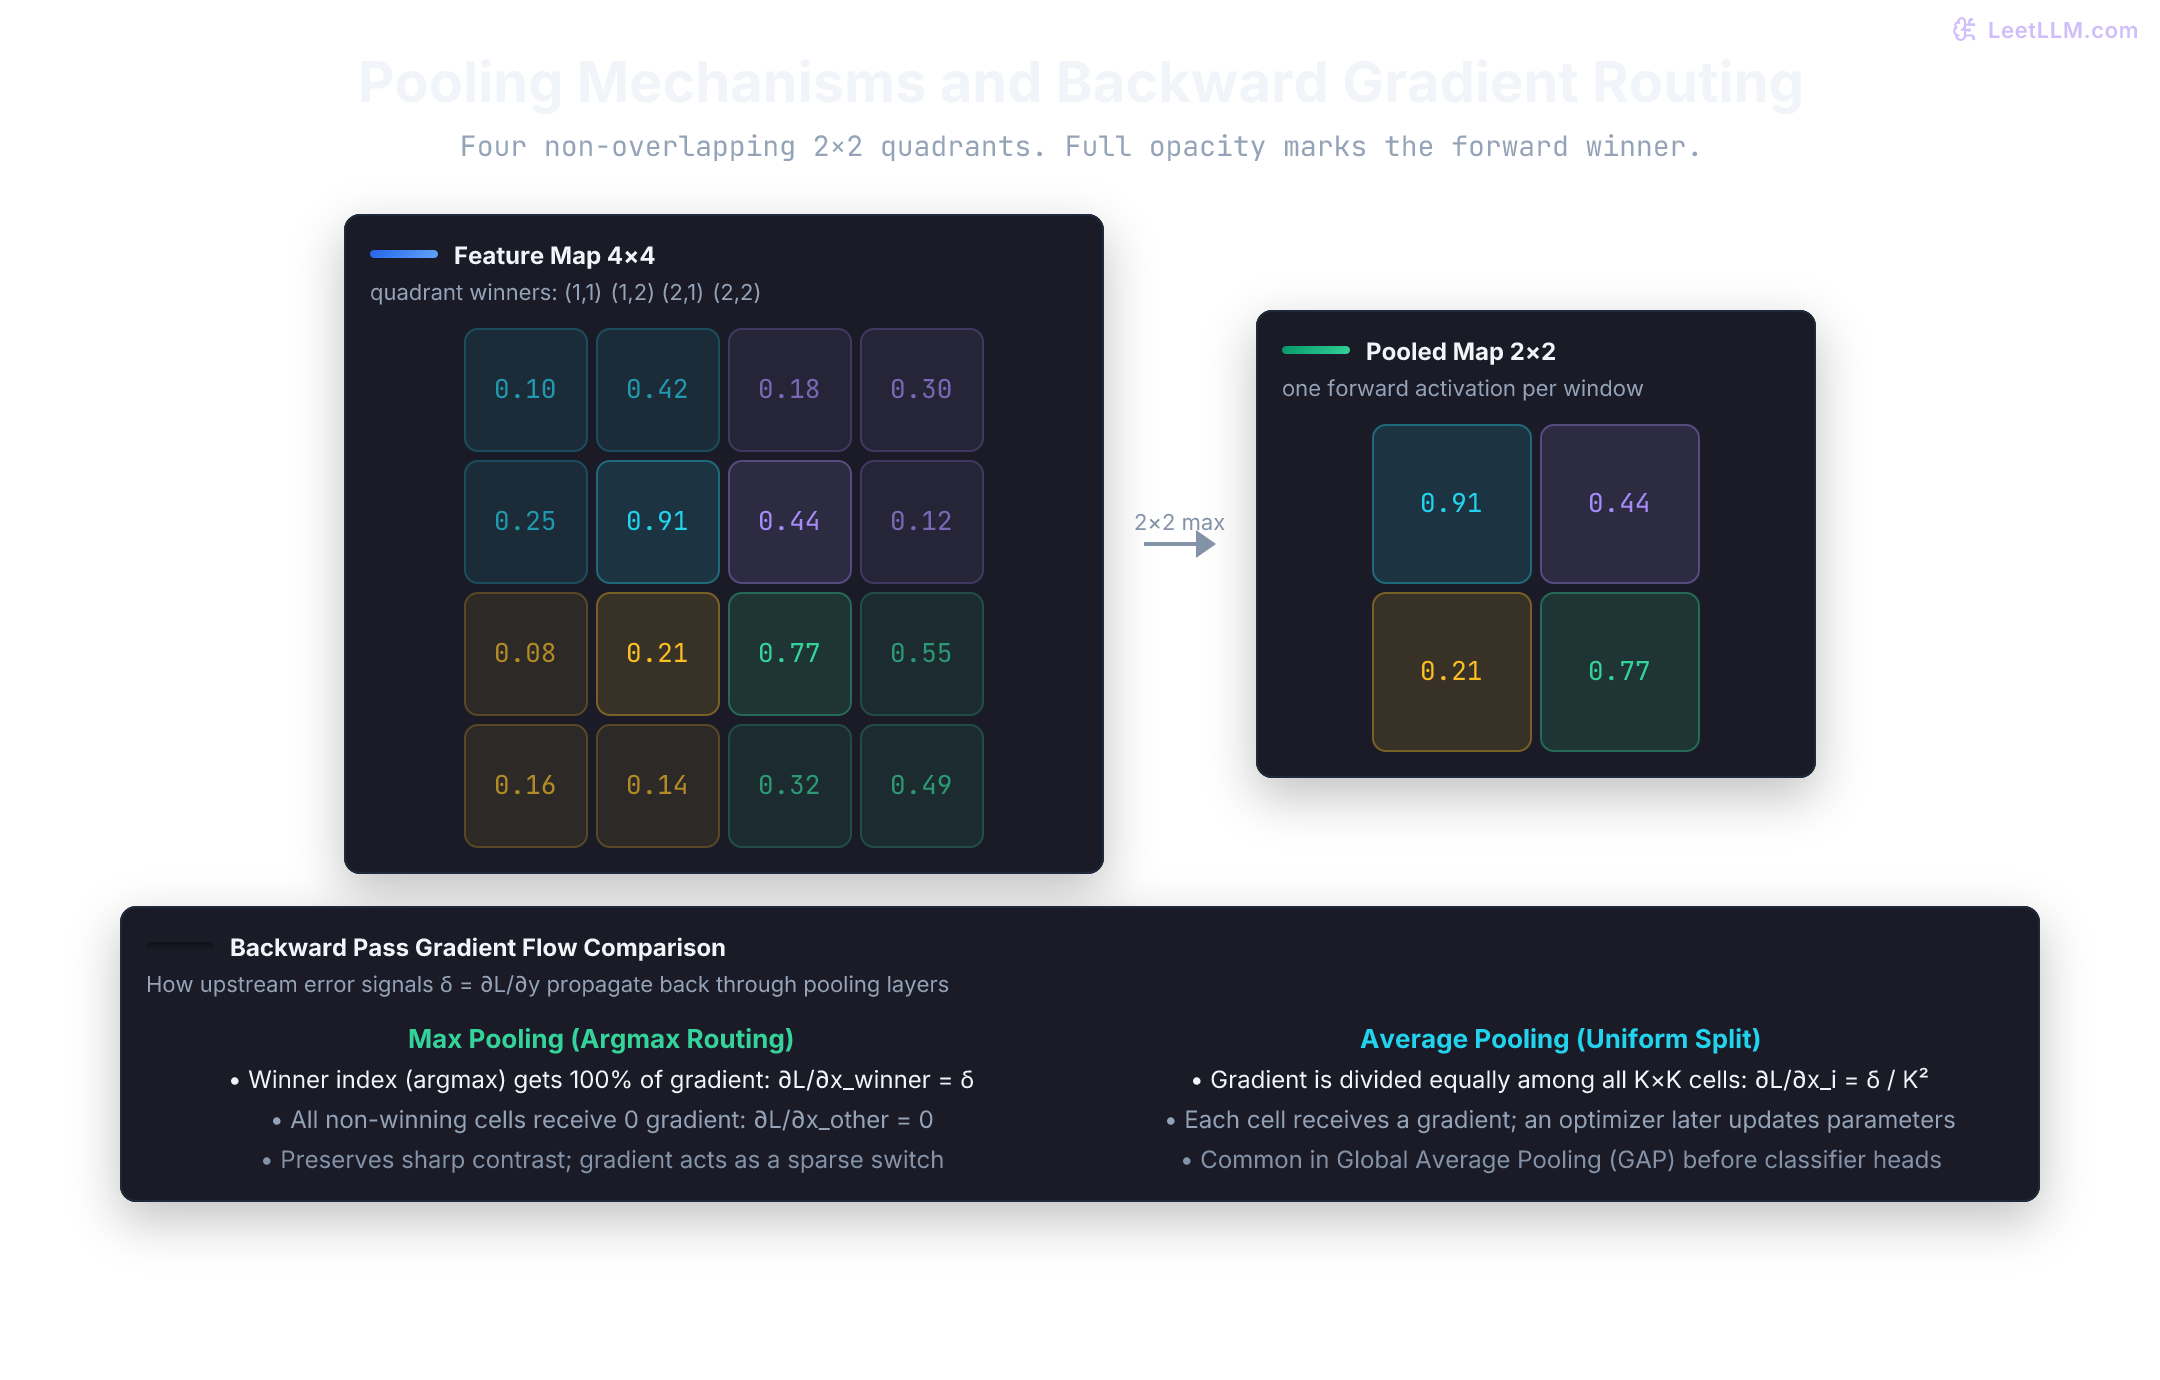
- Max pooling: Selects the maximum value within each window. It acts as a feature detector: if a crack feature fires strongly anywhere in a window, max pooling preserves that peak response, offering localized translation tolerance.
- Average pooling: Computes the arithmetic mean within each window. It summarizes feature-map responses, which may represent learned features rather than raw background intensity. A single large response contributes less to the mean than to the maximum.
Global Average Pooling (GAP) averages the spatial values separately for each channel, giving one value per channel and example. Starting with , the result can retain shape or be flattened to QCQ + QCHWQ + QHW > 1$, while removing spatial information from the head; lower test error isn't guaranteed.
Evaluate standard max pooling with stride 2 over this response grid:
| Feature map | Column 1 | Column 2 | Column 3 | Column 4 |
|---|---|---|---|---|
| Row 1 | 0.10 | 0.42 | 0.18 | 0.30 |
| Row 2 | 0.25 | 0.91 | 0.44 | 0.12 |
| Row 3 | 0.08 | 0.21 | 0.77 | 0.55 |
| Row 4 | 0.16 | 0.14 | 0.32 | 0.49 |
1import numpy as np
2
3feature_map = np.array([
4    [0.10, 0.42, 0.18, 0.30],
5    [0.25, 0.91, 0.44, 0.12],
6    [0.08, 0.21, 0.77, 0.55],
7    [0.16, 0.14, 0.32, 0.49],
8])
9
10pooled = np.empty((2, 2))
11winners = []
12for row in range(2):
13    for col in range(2):
14        block = feature_map[row * 2:row * 2 + 2, col * 2:col * 2 + 2]
15        local_row, local_col = np.unravel_index(np.argmax(block), block.shape)
16        pooled[row, col] = block[local_row, local_col]
17        winners.append((int(row * 2 + local_row), int(col * 2 + local_col)))
18
19print(np.round(pooled, 2))
20print("winner coordinates:", winners)1[[0.91 0.44]
2 [0.21 0.77]]
3winner coordinates: [(1, 1), (1, 2), (2, 1), (2, 2)]The output picks 0.91, 0.44, 0.21, and 0.77, one winner per quadrant.
During backpropagation, error gradients propagate backwards through pooling operations differently:
- In max pooling, the selected input activation receives the window's gradient: . Other cells receive zero from that window. These aren't necessarily raw pixels. Ties require a backward convention; our NumPy example selects the first maximum in flattened order.
- In average pooling over an unpadded window, each cell receives from that window. Backpropagation computes gradients, not parameter updates. If pooling windows overlap, contributions to a shared cell add.
For the four pooled values above, suppose the incoming gradients are [[2.0, -1.0], [0.5, 3.0]]. Which entries of the 4 by 4 input-gradient map are nonzero?
Answer
Only the selected winners: (1,1) gets 2.0, (1,2) gets -1.0, (2,1) gets 0.5, and (2,2) gets 3.0. All other entries are zero in this non-overlapping, unique-winner example. The negative incoming gradient stays negative; max pooling routes it rather than taking its maximum.
Failure modes: border evidence and padding artifacts
Boundary handling introduces subtle failure modes that impact model predictions.
For a stride-one valid 3 x 3 operation on an image at least 5 x 5, a corner pixel participates in one window and an interior pixel can participate in nine. On our smaller 4 x 4 crop, even the most central pixels participate in only four. Fewer placements can reduce aggregate evidence in some models; they don't guarantee a smaller response for every kernel and classification head.
1import numpy as np
2
3def total_window_response(image: np.ndarray, padding: int) -> float:
4    padded = np.pad(image, padding)
5    kernel = np.ones((3, 3))
6    total = 0.0
7    for row in range(padded.shape[0] - 2):
8        for col in range(padded.shape[1] - 2):
9            total += np.sum(padded[row:row + 3, col:col + 3] * kernel)
10    return total
11
12edge_signal = np.zeros((5, 5))
13edge_signal[0, 0] = 1.0
14center_signal = np.zeros((5, 5))
15center_signal[2, 2] = 1.0
16
17print(f"valid edge total: {total_window_response(edge_signal, padding=0):.0f}")
18print(f"valid center total: {total_window_response(center_signal, padding=0):.0f}")
19print(f"padded edge total: {total_window_response(edge_signal, padding=1):.0f}")1valid edge total: 1
2valid center total: 9
3padded edge total: 4Padding helps by creating extra placements where the corner pixel lands inside valid windows, raising the count from 1 to 4.
Padding can also introduce responses to synthetic structure. Zero padding places zero-valued pixels around the image. On a uniform gray surface of brightness 0.6, the transition to 0.0 creates an artificial intensity step. An edge filter can respond strongly to that step; a classifier might mistake the response for a defect.
Reflection padding (mode='reflect') mirrors interior values across the boundary.[5] It avoids this gray-to-black transition on a uniform image, but it imposes its own artificial continuation. It doesn't guarantee smooth gradients or remove all border artifacts.
1import numpy as np
2
3card = np.full((5, 5), 0.6)
4horizontal_edge = np.array([
5    [1.0, 1.0, 1.0],
6    [0.0, 0.0, 0.0],
7    [-1.0, -1.0, -1.0],
8])
9
10def response_map(padded: np.ndarray, kernel: np.ndarray) -> np.ndarray:
11    output = np.empty((padded.shape[0] - 2, padded.shape[1] - 2))
12    for row in range(output.shape[0]):
13        for col in range(output.shape[1]):
14            output[row, col] = np.sum(padded[row:row + 3, col:col + 3] * kernel)
15    return output
16
17for mode in ("constant", "reflect"):
18    padded = np.pad(card, 1, mode=mode)
19    responses = response_map(padded, horizontal_edge)
20 print(f"{mode} max absolute response: {np.abs(responses).max():.1f}")1constant max absolute response: 1.8
2reflect max absolute response: 0.0Constant zero padding yields an artificial response of 1.8 on an untextured, uniform surface. Reflection padding outputs 0.0. When edge artifacts appear near image borders, evaluate padding modes and keep training and inference configurations synchronized.
Build it: an inspectable forward pass
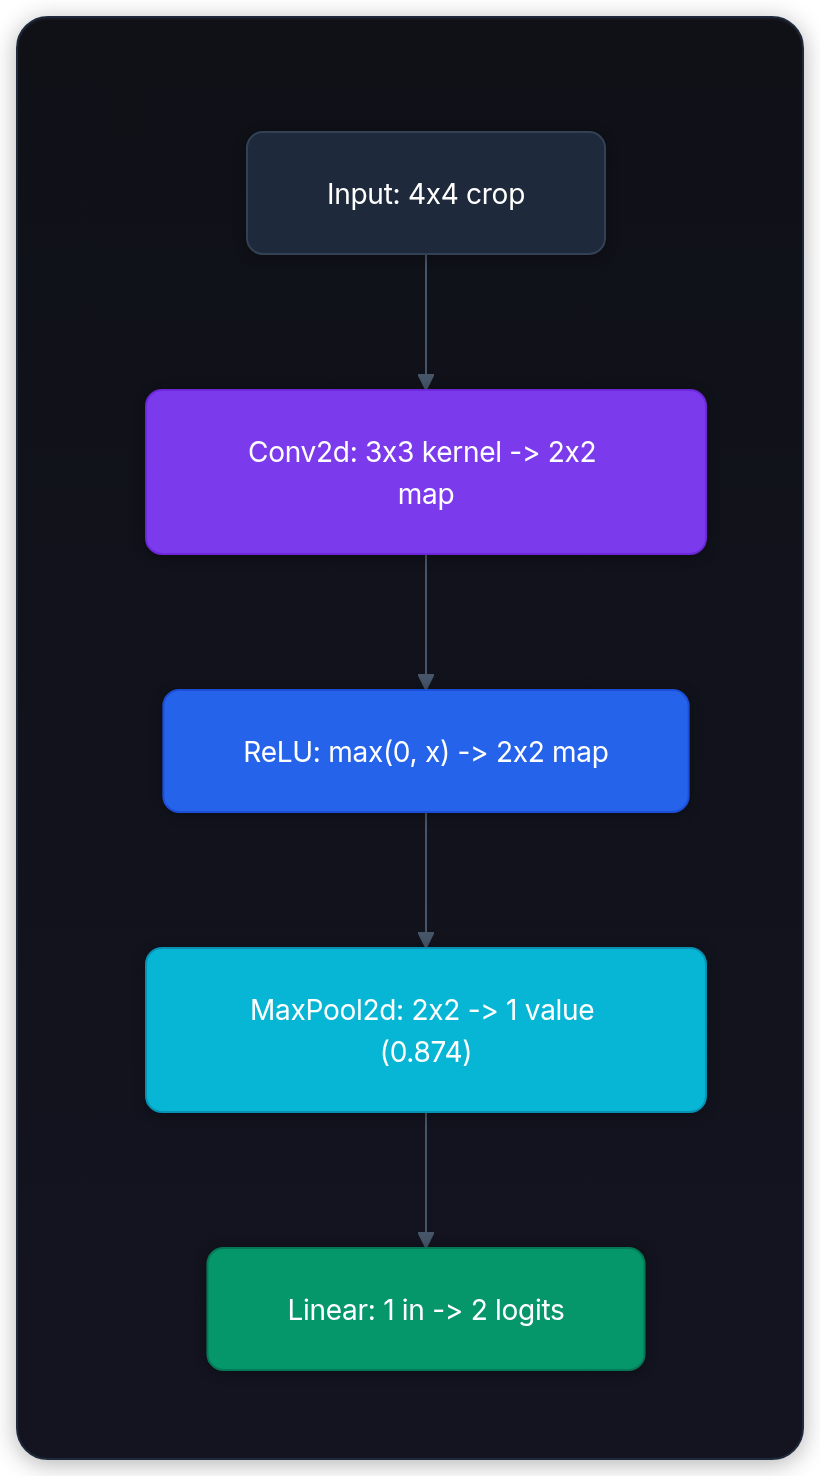
Assemble a complete toy forward pipeline: the unpadded 4 x 4 crop passes through convolution, ReLU, max pooling, and a two-class linear head. All weights are hand-picked, so its logits illustrate class-score arithmetic, not a validated crack detector.
A stack of convolutions without non-linear operations remains affine, or linear if biases are absent. It can't create a non-linear dependence on the input. The merged operation isn't necessarily one ordinary shared-kernel convolution when finite boundaries and strides are involved.
1import numpy as np
2
3image = np.array([
4    [0.05, 0.08, 0.06, 0.07],
5    [0.12, 0.92, 0.88, 0.09],
6    [0.08, 0.90, 0.93, 0.11],
7    [0.06, 0.07, 0.09, 0.05],
8])
9kernel = np.array([
10    [-0.6, -0.6, -0.6],
11    [1.1, 1.1, 1.1],
12    [-0.6, -0.6, -0.6],
13])
14
15def conv_valid(image: np.ndarray, kernel: np.ndarray) -> np.ndarray:
16    output = np.empty((2, 2))
17    for row in range(2):
18        for col in range(2):
19            output[row, col] = np.sum(image[row:row + 3, col:col + 3] * kernel)
20    return output
21
22feature_map = conv_valid(image, kernel)
23activated = np.maximum(feature_map, 0.0)
24pooled = np.array([activated.max()])
25classifier_weights = np.array([[1.4], [-0.9]])
26classifier_bias = np.array([-0.2, 0.1])
27numpy_logits = classifier_weights @ pooled + classifier_bias
28
29assert feature_map.shape == (2, 2)
30assert pooled.shape == (1,)
31print("feature map:")
32print(np.round(feature_map, 3))
33print("pooled activation:", np.round(pooled, 3))
34print("logits:", np.round(numpy_logits, 3))1feature map:
2[[0.852 0.789]
3 [0.817 0.874]]
4pooled activation: [0.874]
5logits: [ 1.024 -0.687]The NumPy pipeline produces logits [1.024, -0.687].
Now construct the same architecture in PyTorch. Conv2d accepts a batch with shape (N, C, H, W) or an unbatched (C, H, W) tensor. Here unsqueeze(0).unsqueeze(0) adds the batch and channel axes, turning (4, 4) into (1, 1, 4, 4). Copy the manual weights to check numerical agreement.
1import torch
2from torch import nn
3
4image_bchw = torch.tensor(image, dtype=torch.float32).unsqueeze(0).unsqueeze(0)
5
6model = nn.Sequential(
7    nn.Conv2d(1, 1, kernel_size=3, bias=False),
8    nn.ReLU(),
9    nn.MaxPool2d(kernel_size=2),
10    nn.Flatten(),
11    nn.Linear(1, 2),
12)
13
14with torch.no_grad():
15    model[0].weight.copy_(torch.tensor(kernel, dtype=torch.float32).view(1, 1, 3, 3))
16    model[4].weight.copy_(torch.tensor(classifier_weights, dtype=torch.float32))
17    model[4].bias.copy_(torch.tensor(classifier_bias, dtype=torch.float32))
18
19pytorch_logits = model(image_bchw).detach().numpy()[0]
20assert np.allclose(pytorch_logits, numpy_logits, rtol=0.0, atol=1e-6)
21print("pytorch logits:", np.round(pytorch_logits, 3))
22print("matches NumPy:", True)1pytorch logits: [ 1.024 -0.687]
2matches NumPy: TrueThe float32 PyTorch results agree with NumPy's float64 calculation within the asserted tolerance. Optimized implementations can use different arithmetic orders, so mathematical equivalence doesn't promise bitwise equality.
Modern vision architectures: ResNet and vision transformers
LeNet-5 and AlexNet demonstrated learned convolutional features on document recognition and large-scale image classification, respectively.[1] [6] As researchers increased depth, they encountered the degradation problem: some deeper plain networks had higher training error than shallower counterparts.
Higher training error points to an optimization difficulty, rather than an explanation based solely on overfitting. The ResNet paper distinguishes this degradation from vanishing gradients: its plain networks used batch normalization, and the authors reported healthy backward gradient norms.[7] More depth can make optimization harder even when gradient magnitudes haven't vanished.
He et al.'s ResNet makes the learned branch represent a residual, , rather than the whole desired mapping.[7] With matching shapes, an identity shortcut adds the original input to that branch:
The following block applies ReLU after this sum, as the original basic ResNet block does. Changing spatial size or channel count would also require a compatible shortcut, such as a projection; this example keeps both unchanged.
BatchNorm2d normalizes each channel using statistics across batch and spatial positions, then applies learned scale and offset parameters. With its default settings, training updates running statistics that evaluation reuses.[8] The newly created block below is in training mode; this example checks shapes, not classifier accuracy.
1import torch
2from torch import nn
3
4class ResidualBlock(nn.Module):
5    def __init__(self, channels: int):
6        super().__init__()
7        self.conv1 = nn.Conv2d(channels, channels, kernel_size=3, padding=1, bias=False)
8        self.bn1 = nn.BatchNorm2d(channels)
9        self.relu = nn.ReLU(inplace=True)
10        self.conv2 = nn.Conv2d(channels, channels, kernel_size=3, padding=1, bias=False)
11        self.bn2 = nn.BatchNorm2d(channels)
12
13    def forward(self, x: torch.Tensor) -> torch.Tensor:
14        identity = x
15        out = self.relu(self.bn1(self.conv1(x)))
16        out = self.bn2(self.conv2(out))
17        out += identity
18        return self.relu(out)
19
20block = ResidualBlock(channels=16)
21dummy_input = torch.randn(1, 16, 28, 28)
22output = block(dummy_input)
23print("input shape:", list(dummy_input.shape))
24print("output shape:", list(output.shape))
25print("shape preserved:", dummy_input.shape == output.shape)1input shape: [1, 16, 28, 28]
2output shape: [1, 16, 28, 28]
3shape preserved: TrueThe derivative of the residual connection during backpropagation reveals why this works:
For the residual sum, the identity term provides a direct additive gradient path. If the branch Jacobian is small, this path can help avoid repeatedly shrinking gradients through that branch. It isn't an unconditional lower bound on the total gradient: a branch Jacobian of cancels it exactly. The block's ReLU after addition introduces another gate, so the displayed derivative is for the sum before that ReLU. The original paper demonstrates successful training of residual networks with 50, 101, and 152 layers.[7]
If an identity shortcut exists, can the total input gradient still be zero?
Answer
Yes. For the residual sum, a branch derivative of -I makes I + (-I) = 0. A zero incoming gradient or an inactive ReLU after the sum can also give zero. The shortcut changes the available paths and has strong empirical benefits; it doesn't guarantee a nonzero gradient at every unit.
A different connection pattern powers Vision Transformers (ViT).[9] Instead of sliding small local filters, ViT slices an image into non-overlapping patches (typically pixels). Linearly projecting each flattened patch into an embedding vector of dimension is mathematically equivalent to a standard 2D convolution with kernel_size=16, stride=16, and out_channels=D.
The architectural contrast lies in how subsequent layers mix information:
- Convolutional networks share local filters across space, encouraging a detector learned in one location to be useful elsewhere. This inductive bias, an architectural assumption about useful functions, can help with limited labeled data. Strides, boundaries, and later heads still affect shift behavior.
- The original Vision Transformer retains spatial structure through patch extraction and positional embeddings, but its self-attention can combine information from any pair of patches in a layer. It has less built-in image locality than a CNN, rather than no spatial assumptions. The original paper found large-scale pretraining useful for its comparisons.[9]
Architecture alone doesn't determine data efficiency or a universal winner. DeiT showed competitive image transformers trained on ImageNet without external training images, using a stronger training recipe and teacher distillation.[10] ConvNeXt modernized convolutional design and competed with the Transformers studied in its experiments.[11] For an inspection task, compare suitable pretrained backbones on held-out panel photos, including tiny defects and image boundaries; account for inference cost as well as accuracy.
Change the crop, predict the response
Test your understanding of spatial shapes, kernel weights, and receptive fields before revealing the answers.
Using the kernel in this lesson, calculate the first response when its upper-left weight is changed from -0.6 to 0.0. Which input pixel causes the difference?
Answer
Only the upper-left aligned input value, 0.05, changes its contribution. Removing its -0.6 weight increases the response by 0.03, from 0.852 to 0.882, because 0.05 times -0.6 had contributed -0.03.
An RGB image of shape 64 by 64 enters eight 5 by 5 filters with stride 2 and padding 2. What is the output spatial shape, and how many parameters, including one bias per filter, does the layer have?
Answer
Each output dimension is floor((64 + 2 times 2 - 5) / 2) + 1 = 32, so output shape is 8 by 32 by 32. Parameters are 8 filters times (3 channels times 5 times 5 weights) plus 8 biases = 600 + 8 = 608 total.
Trace receptive field and jump for two 3 by 3 stride-one convolutions followed by one 3 by 3 stride-two convolution.
Answer
Start with field 1 and jump 1. First convolution gives field 1 + 21 = 3, jump 1. Second gives field 3 + 21 = 5, jump 1. The stride-two convolution gives field 5 + (3 - 1)*1 = 7, jump 1 * 2 = 2. One final activation covers a 7 by 7 input footprint, and adjacent final activations move two input pixels apart.
How can zero padding produce a nonzero edge response on a uniform gray panel?
Answer
With zero bias, a zero-sum edge kernel gives zero response when its whole window sees the same value. A window crossing the zero-padded border mixes gray and black values and can give a nonzero response. The example's maximum absolute response is 1.8. Whether a classifier reports a false defect depends on its learned decision, not just that response.