Personalize this lesson
Adapt explanations and teaching visuals to your background and preferred voice.
You have sixteen GPUs, each with 80 GB of usable memory in this hypothetical cluster. Together, they provide 1,280 GB. You want to train a 70-billion-parameter (70B) model using AdamW in mixed precision. Why can't ordinary Distributed Data Parallel (DDP) use that combined capacity? Even a single BF16 parameter replica needs 140 GB, so placing it on any one of these GPUs already fails. You haven't reached activation or optimizer allocations yet.
Why does this happen? Ordinary DDP replicates the entire model state on every rank. Adding more GPUs gives you more copies of the exact same problem, not smaller copies.
To train models at this scale, you have to break through the memory wall by sharding states across workers. Fully Sharded Data Parallel (FSDP) and ZeRO (Zero Redundancy Optimizer) do exactly that. Communication becomes part of the training cost.
Use a hypothetical 70-billion-parameter (70B) model to follow those bytes. The sizing examples below are calculations, not measurements from a 70B training run. All capacities use decimal GB; compare against usable device bytes, not just a card's product name.
Before choosing a sharding policy, predict which memory is actually missing. One standard mixed-precision sizing convention, used in the ZeRO analysis, assumes low-precision parameters and gradients plus an FP32 master parameter copy and FP32 Adam moments.[1] Under that specific recipe, each parameter costs 16 bytes of model-state memory before activations, temporary buffers, or allocator overhead:
- 2 bytes for the BF16 (
bfloat16, short for Brain Floating Point) or FP16 (16-bit half precision) weight, used in high-throughput Tensor Core matrix multiplications. - 2 bytes for the BF16 / FP16 gradient, computed during backward propagation.
- 4 bytes for an FP32 master parameter copy in this recipe. It reduces the rounding loss from updating low-precision stored weights. It doesn't preserve arbitrarily small updates: subtracting
1e-8from a weight of1.0rounds back to1.0even in FP32. The issue is the spacing around the weight, which differs from whether the update itself is representable. - 4 bytes for Adam's first moment (), the running exponential moving average of past gradients (momentum).
- 4 bytes for Adam's second moment (), the running exponential moving average of squared gradients (an uncentered second moment).
For a 1B model, that's 16 GB of model states alone. Scale this recipe to 7B parameters and it reaches 112 GB. At 70B parameters, it is 1.12 TB before activations. Those totals describe the buffers when they exist; ordinary PyTorch AdamW creates its moment buffers lazily at the first update. The 140 GB parameter replica already explains the startup failure on an 80 GB GPU.
Try to predict which dtype preserves a decrement of 1e-4 at 1.0. This CPU cell performs subtraction in FP32, then rounds to the stored parameter dtype. It isolates rounding; it doesn't simulate AdamW's adaptive update.
import torch

for name, dtype in [("FP16", torch.float16), ("BF16", torch.bfloat16), ("FP32", torch.float32)]:
    weight = torch.tensor(1.0, dtype=dtype)
    below = torch.nextafter(weight, torch.tensor(0.0, dtype=dtype))
    gap_below = (weight - below).item()
    tiny = (weight.float() - 1e-8).to(dtype)
    larger = (weight.float() - 1e-4).to(dtype)
    assert tiny.item() == 1.0
    assert (larger.item() != 1.0) == (dtype == torch.float32)
print(f"{name}: gap_below_1={gap_below:.3e}, 1e-8_survives={tiny.item() != 1.0}, 1e-4_survives={larger.item() != 1.0}")FP16: gap_below_1=4.883e-04, 1e-8_survives=False, 1e-4_survives=False
BF16: gap_below_1=3.906e-03, 1e-8_survives=False, 1e-4_survives=False
FP32: gap_below_1=5.960e-08, 1e-8_survives=False, 1e-4_survives=TrueAt this power-of-two boundary, the gap below 1.0 is half the gap above it. With round-to-nearest-even, a decrement below half the downward gap disappears. FP32 offers finer spacing, not exact accumulation of every increment. Low-precision optimizer methods with stochastic rounding are another design choice, discussed in the preceding lesson; this sixteen-byte inventory is one convention rather than a universal requirement.
Sharding that 16 GB evenly across eight data-parallel ranks suggests 2 GB of steady-state model state per rank, not a 2 GB peak allocation. The currently gathered layer, activations, communication buffers, and allocator overhead still need their own memory budget.
The first figure tracks only model states. Activations and transient buffers stay outside the columns because sharding model states doesn't remove those costs.
The memory wall in numbers
Before reading the totals, predict which state dominates this recipe. The FP32 master and two Adam moments use twelve bytes per parameter; the compute weight uses two.
For a 70B parameter model under the FP16/BF16 parameter-and-gradient plus FP32-master-and-Adam accounting convention, the model-state math looks like this:
- Weights: 140 GB
- Gradients: 140 GB
- Adam state + FP32 master weights: 840 GB
That's about 1.12 TB of model states before activations, temporary buffers, or allocator overhead. Optimizer states and master weights () consume of this model-state inventory. It's an assumption-bound calculation, not a promise about every optimizer implementation.
The arithmetic is small enough to turn into a quick check. Use decimal GB so the computed numbers match this table.
GB = 10**9

def state_memory_gb(params_billions: float, bytes_per_param: int) -> float:
    return params_billions * 1_000_000_000 * bytes_per_param / GB

recipe_bytes = {
    "low_precision_parameters": 2,
    "low_precision_gradients": 2,
    "fp32_master_and_adam": 12,
}
weights = state_memory_gb(70, recipe_bytes["low_precision_parameters"])
gradients = state_memory_gb(70, recipe_bytes["low_precision_gradients"])
optimizer_and_master = state_memory_gb(70, recipe_bytes["fp32_master_and_adam"])
total_model_states = weights + gradients + optimizer_and_master
zero3_per_gpu = total_model_states / 256

print("bytes_per_parameter=", sum(recipe_bytes.values()))
print(f"weights={weights:.0f} GB")
print(f"optimizer_and_master={optimizer_and_master:.0f} GB")
print(f"total_model_states={total_model_states:.0f} GB")
print(f"ZeRO-3 model states per GPU on 256 GPUs: {zero3_per_gpu:.2f} GB")bytes_per_parameter= 16
weights=140 GB
optimizer_and_master=840 GB
total_model_states=1120 GB
ZeRO-3 model states per GPU on 256 GPUs: 4.38 GB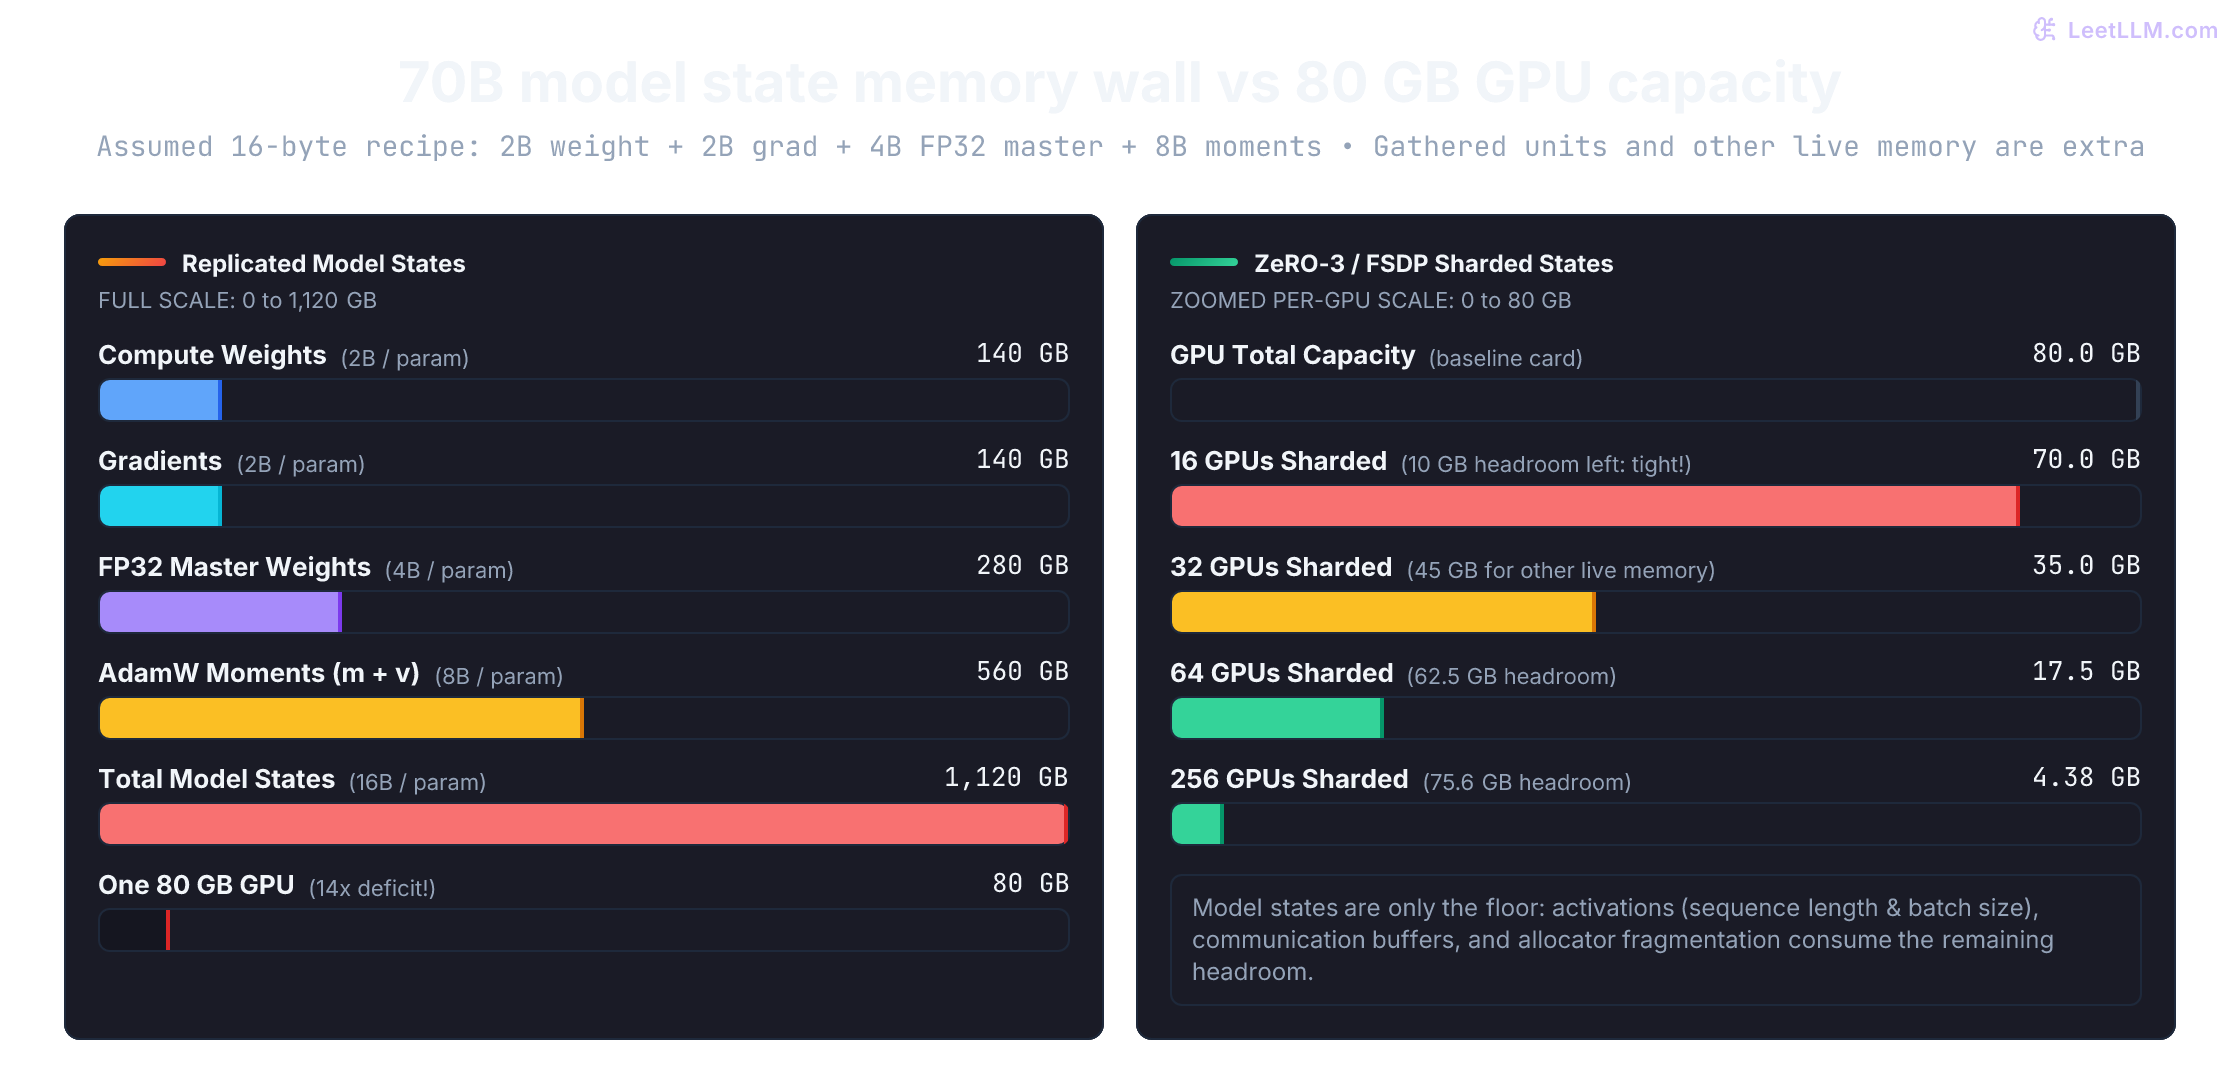
Why DDP hits a limit
Use the running 70B example to test the first instinct: if you add more data-parallel ranks, does each rank's model-state copy get smaller? It doesn't. Replication increases the number of copies while splitting only the input batch.
Ordinary DDP (Distributed Data Parallel) places a model replica on each rank, usually one process per GPU. Your sampler or input pipeline must give ranks different batches; DDP doesn't split the input for you. During backward, DDP synchronizes gradient buckets with all-reduce and, under its default behavior, averages gradients across ranks. Collectives can overlap with the remaining backward computation.[2]
For equal-size local batches and a mean loss on each rank, this produces the mean gradient of the combined batch. Unequal token counts need careful loss weighting: averaging two local means isn't generally the same as averaging all valid tokens. More ranks may improve throughput when the model fits, but don't shrink the replicated model state.
For a token-mean objective, let rank have valid targets and local loss sum . With ranks and default DDP gradient averaging, backpropagate on each rank. Equivalently, multiply its local mean by . The final average then differentiates the global token mean. The denominator counts unmasked targets, not padded sequence positions. A custom communication hook or join policy can change the averaging convention.[2]
Predict the error when one rank has one target and another has three. This CPU cell differentiates actual losses and explicitly models the averaging step in one process. It doesn't launch DDP or test collectives.
import torch

targets = [torch.tensor([1.]), torch.tensor([3., 3., 3.])]
counts = [target.numel() for target in targets]
ranks, total = len(targets), sum(counts)

def rank_gradient(target, multiplier):
    weight = torch.tensor(0., requires_grad=True)
    loss = (weight - target).square().mean() * multiplier
    return torch.autograd.grad(loss, weight)[0]

naive = torch.stack([rank_gradient(t, 1.) for t in targets]).mean()
weighted = torch.stack([
    rank_gradient(t, ranks * count / total)
    for t, count in zip(targets, counts)
]).mean()
weight = torch.tensor(0., requires_grad=True)
pooled_loss = (weight - torch.cat(targets)).square().mean()
pooled = torch.autograd.grad(pooled_loss, weight)[0]
torch.testing.assert_close(weighted, pooled)
assert naive.item() == -4. and pooled.item() == -5.
print(f"mean_of_rank_means_gradient={naive.item():.1f}")
print(f"weighted_DDP_average_gradient={weighted.item():.1f}")
print(f"pooled_target_mean_gradient={pooled.item():.1f}")mean_of_rank_means_gradient=-4.0
weighted_DDP_average_gradient=-5.0
pooled_target_mean_gradient=-5.0For accumulation, count valid targets across the whole update's micro-batches and ranks. Averaging each micro-batch independently gives it equal weight regardless of its target count. All ranks must participate in the count reduction, including a rank with zero valid targets; form a zero loss sum rather than an undefined local mean. A globally empty update needs a coordinated skip before any optimizer or scheduler update.
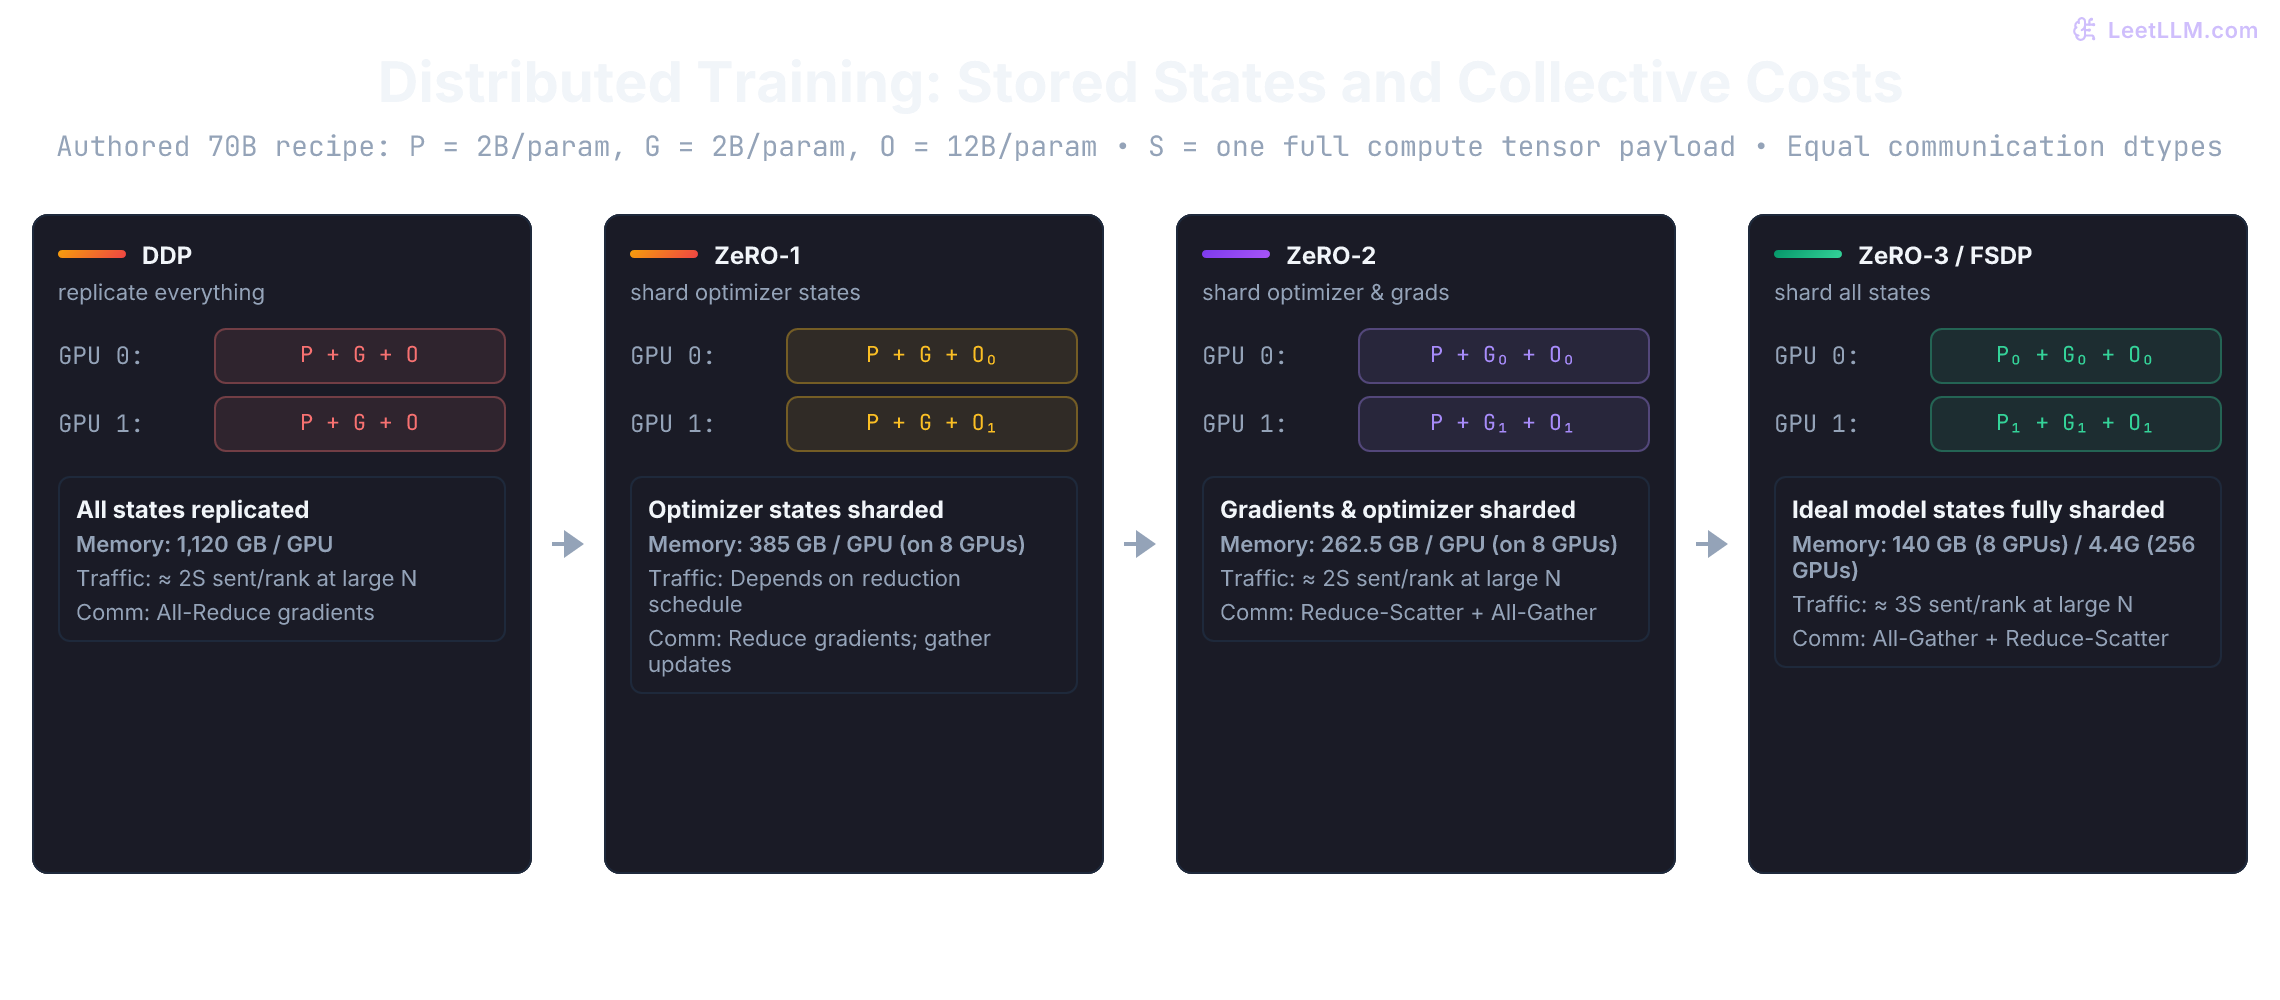
That stops helping when the model itself is the problem. DDP replicates the full 1.12 TB of 70B model states on every rank (process/GPU). Sixteen GPUs give you sixteen copies, not a smaller copy. FSDP and ZeRO attack that redundancy by sharding model states across the data-parallel group.
ZeRO partitions more of that state at each stage.[1] ZeRO-1 shards optimizer states, ZeRO-2 also shards gradients, and only ZeRO-3 shards parameters. Under ZeRO-3, each GPU keeps a fraction of the parameters and gathers the shards it needs for compute.
- DDP: Replicate everything. Simpler communication pattern, much higher memory use.
- ZeRO: Shard model states. Lower persistent memory; communication volume and scheduling depend on the stage.
ZeRO stages: removing redundancy one layer at a time
Each stage answers one storage question: which model state can stop being replicated while the rank still completes its update?
Let be the number of ranks in the data-parallel sharding group, not necessarily the whole cluster. Each stage removes another kind of redundant model state.
ZeRO stage 1: shard optimizer states
Each GPU keeps optimizer state for only of the parameters. Parameters and gradients are still replicated.
- Memory savings: Optimizer state drops from 840 GB total to roughly GB per GPU. For an 8-GPU node, that's per GPU instead of 840 GB.
- Communication: Each rank updates its owned parameter partition, then shares the updated parameters. Don't count a full gradient all-reduce plus a parameter all-gather as just : that schedule has three collective phases. The paper's analysis explicitly uses reduced gradient partitions plus a parameter all-gather for stages 1 and 2 together. Stage 1's storage policy alone doesn't determine the implementation's collectives.
ZeRO stage 2: shard optimizer + gradients
Stage 2 also shards gradients, so each GPU owns only the gradient shard that matches its optimizer shard.
- Memory savings: Optimizer states and gradients both scale down by roughly . For an 8-GPU node, gradients drop from 140 GB to per GPU.
- Communication: Reduce-scatter combines gradients across ranks and leaves each rank its owned slice. After local optimizer updates, all-gather distributes updated parameter slices so every rank again has full compute weights. In the paper's equal-dtype, large-group model, those two phases cost , matching DDP's modeled volume. Actual DeepSpeed reductions can use different bucket schedules and collectives.
ZeRO stage 3: shard everything
Stage 3 shards parameters as well. No rank owns a full persistent copy of the model states anymore.
- Memory savings: Parameters, gradients, and optimizer states are all partitioned. For the 70B example on 256 GPUs, the model-state footprint falls to about 4.4 GB per GPU before activations.
- Communication: Parameters now have to be materialized on demand for computation.
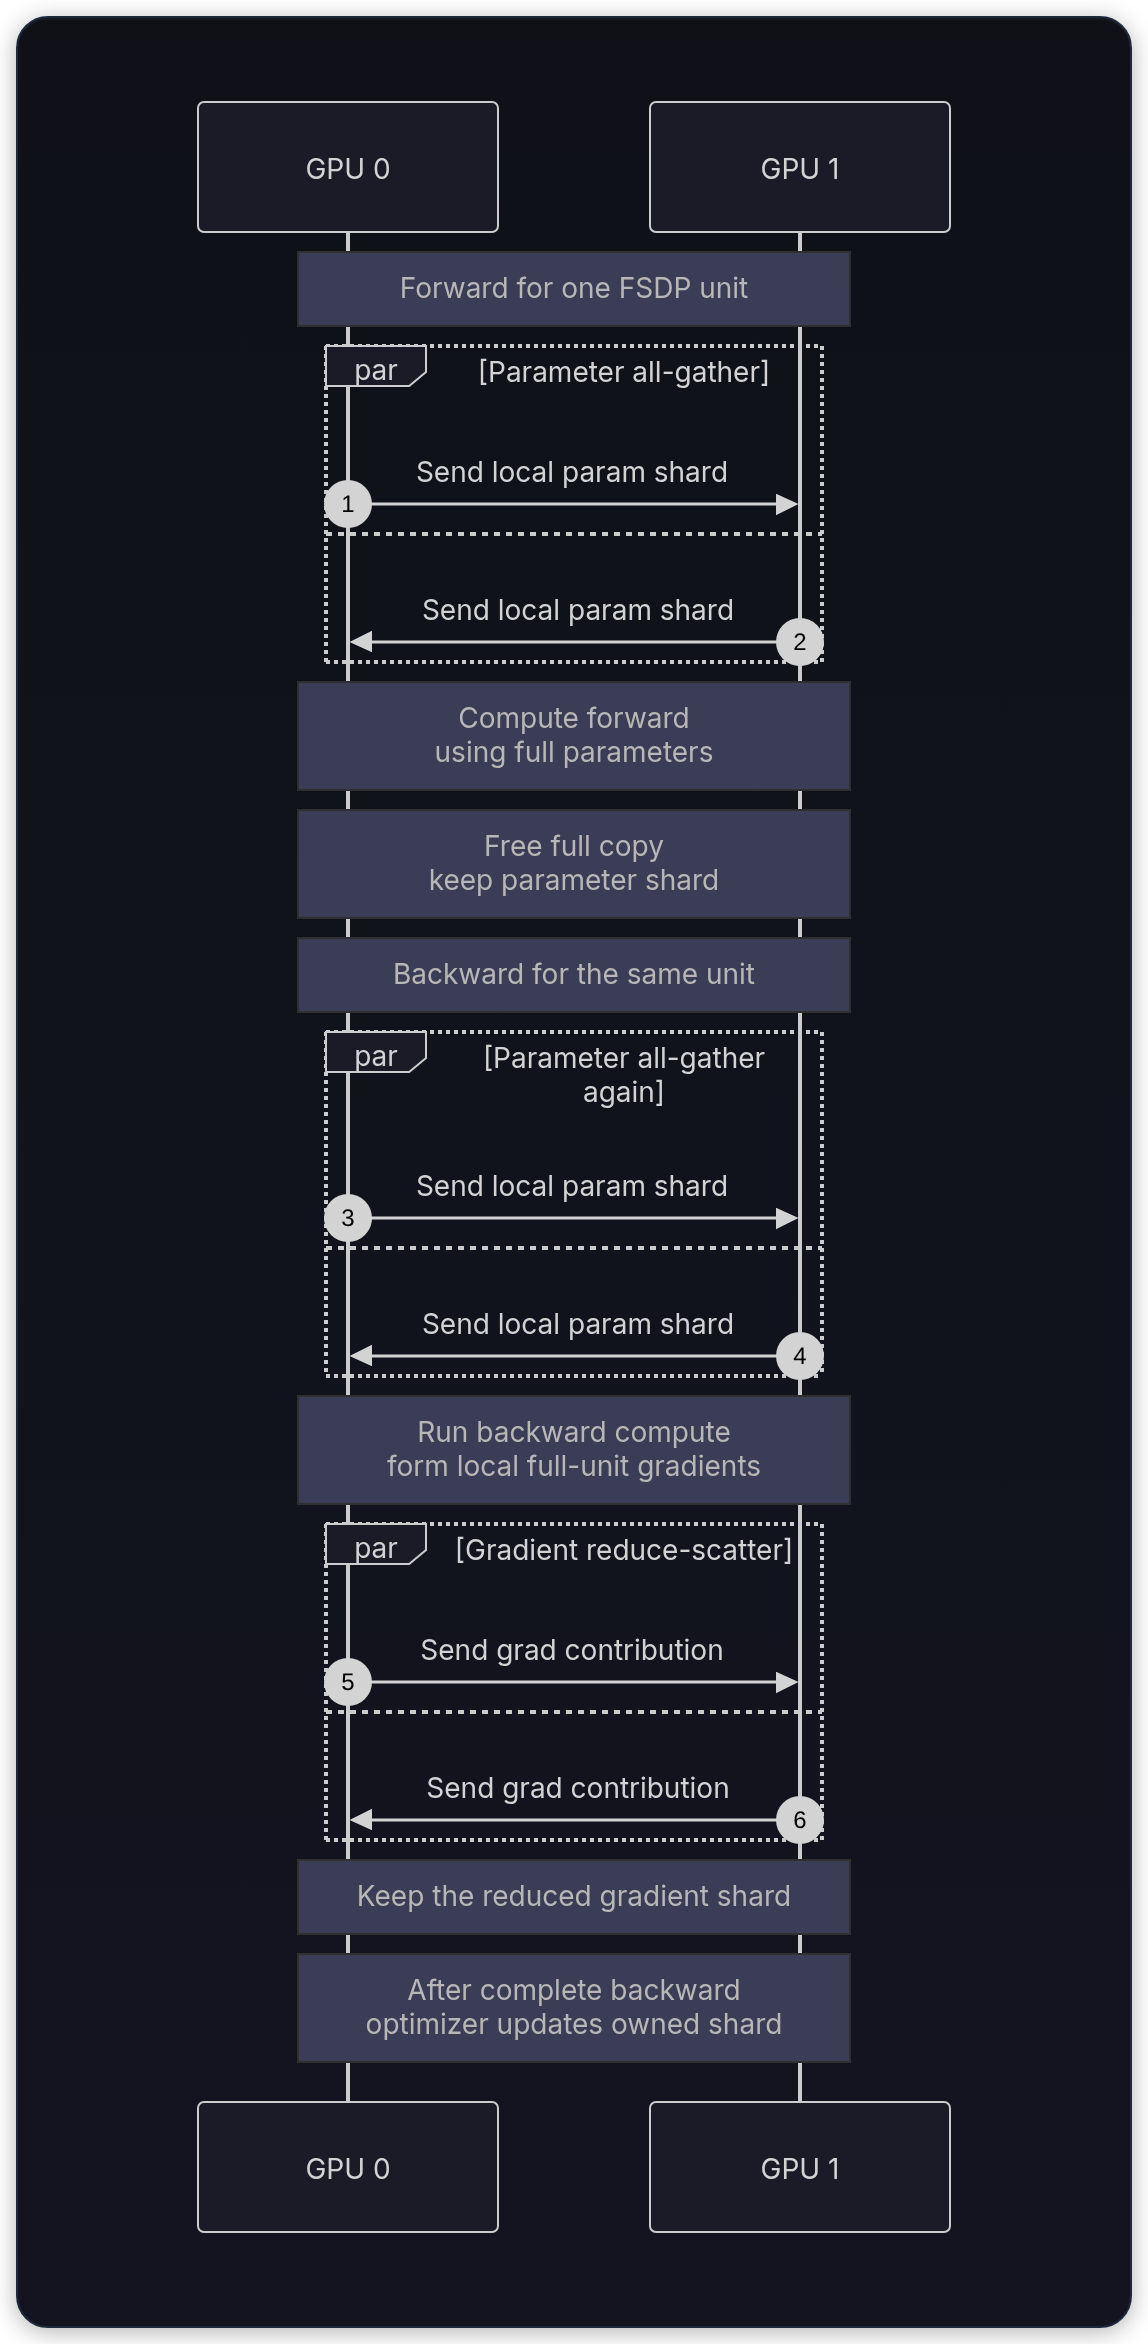
- Forward: all-gather (collect shards from all GPUs to rebuild the full tensor) the current layer or FSDP unit, run compute, then reshard.
- Backward: all-gather that unit again, compute gradients, then reduce-scatter gradient shards. After backward and any accumulation finish, each rank's optimizer updates its owned shard.
- Trade-off: Memory scales almost linearly with the data-parallel group size, but communication becomes a first-class bottleneck. Total volume climbs to , roughly 1.5x DDP.
ZeRO memory trade-off: One unreplicated copy of this recipe needs 1.12 TB. DDP on ranks stores such copies; ideal ZeRO-3 approaches one copy distributed across them. Temporary materialized units, replicated small parameters, padding, and communication buffers add to that lower bound.
Memory per GPU (70B model, 256 GPUs)
This table assumes BF16/FP16 weights and gradients with Adam states in FP32. The totals are for model states only. Activation memory is listed separately because it depends heavily on sequence length, hidden size, micro-batch size, checkpointing, and attention implementation.
| Component | DDP | ZeRO-1 | ZeRO-2 | ZeRO-3 |
|---|---|---|---|---|
| Weights | 140 GB | 140 GB | 140 GB | 0.55 GB |
| Gradients | 140 GB | 140 GB | 0.55 GB | 0.55 GB |
| Optimizer + FP32 master weights | 840 GB | 3.3 GB | 3.3 GB | 3.3 GB |
| Activations | Extra and workload-dependent | Extra and workload-dependent | Extra and workload-dependent | Extra and workload-dependent |
| Model states / GPU | 1120 GB | 283 GB | 144 GB | 4.4 GB |
ZeRO-3 or FULL_SHARD is often paired with activation checkpointing (recomputing activations during the backward pass to save memory, also called gradient checkpointing). Sharding fixes model-state memory, but activations can still dominate the actual training footprint.
The same table should be generated from a recipe rather than copied into a sizing document:
state_gb = {"parameters": 140, "gradients": 140, "optimizer_and_master": 840}
world_size = 256

def per_rank_gb(stage, ranks=world_size):
    if not isinstance(ranks, int) or ranks < 1:
        raise ValueError("ranks must be a positive integer")
    sharded = {
        0: set(),
        1: {"optimizer_and_master"},
        2: {"optimizer_and_master", "gradients"},
        3: {"optimizer_and_master", "gradients", "parameters"},
    }[stage]
    return sum(value / ranks if name in sharded else value for name, value in state_gb.items())

for stage in [0, 1, 2, 3]:
    print(f"ZeRO-{stage}: {per_rank_gb(stage):.2f} GB/model-state rank")
    assert per_rank_gb(stage, ranks=1) == 1120  # One rank has no sharing benefit.
try:
    per_rank_gb(3, ranks=0)
except ValueError:
print("zero_rank_group=rejected")ZeRO-0: 1120.00 GB/model-state rank
ZeRO-1: 283.28 GB/model-state rank
ZeRO-2: 143.83 GB/model-state rank
ZeRO-3: 4.38 GB/model-state rank
zero_rank_group=rejectedCommunication overhead analysis
Once state is sharded, the memory win has a matching communication bill. Follow one parameter shard through the collectives before comparing frameworks or networks.
ZeRO-3 doesn't delete those 1.12 TB. It spreads the persistent copies and pays the interconnect every time a block needs its full weights. The network is now part of the training system, not an afterthought.
Communication primitives you need to know
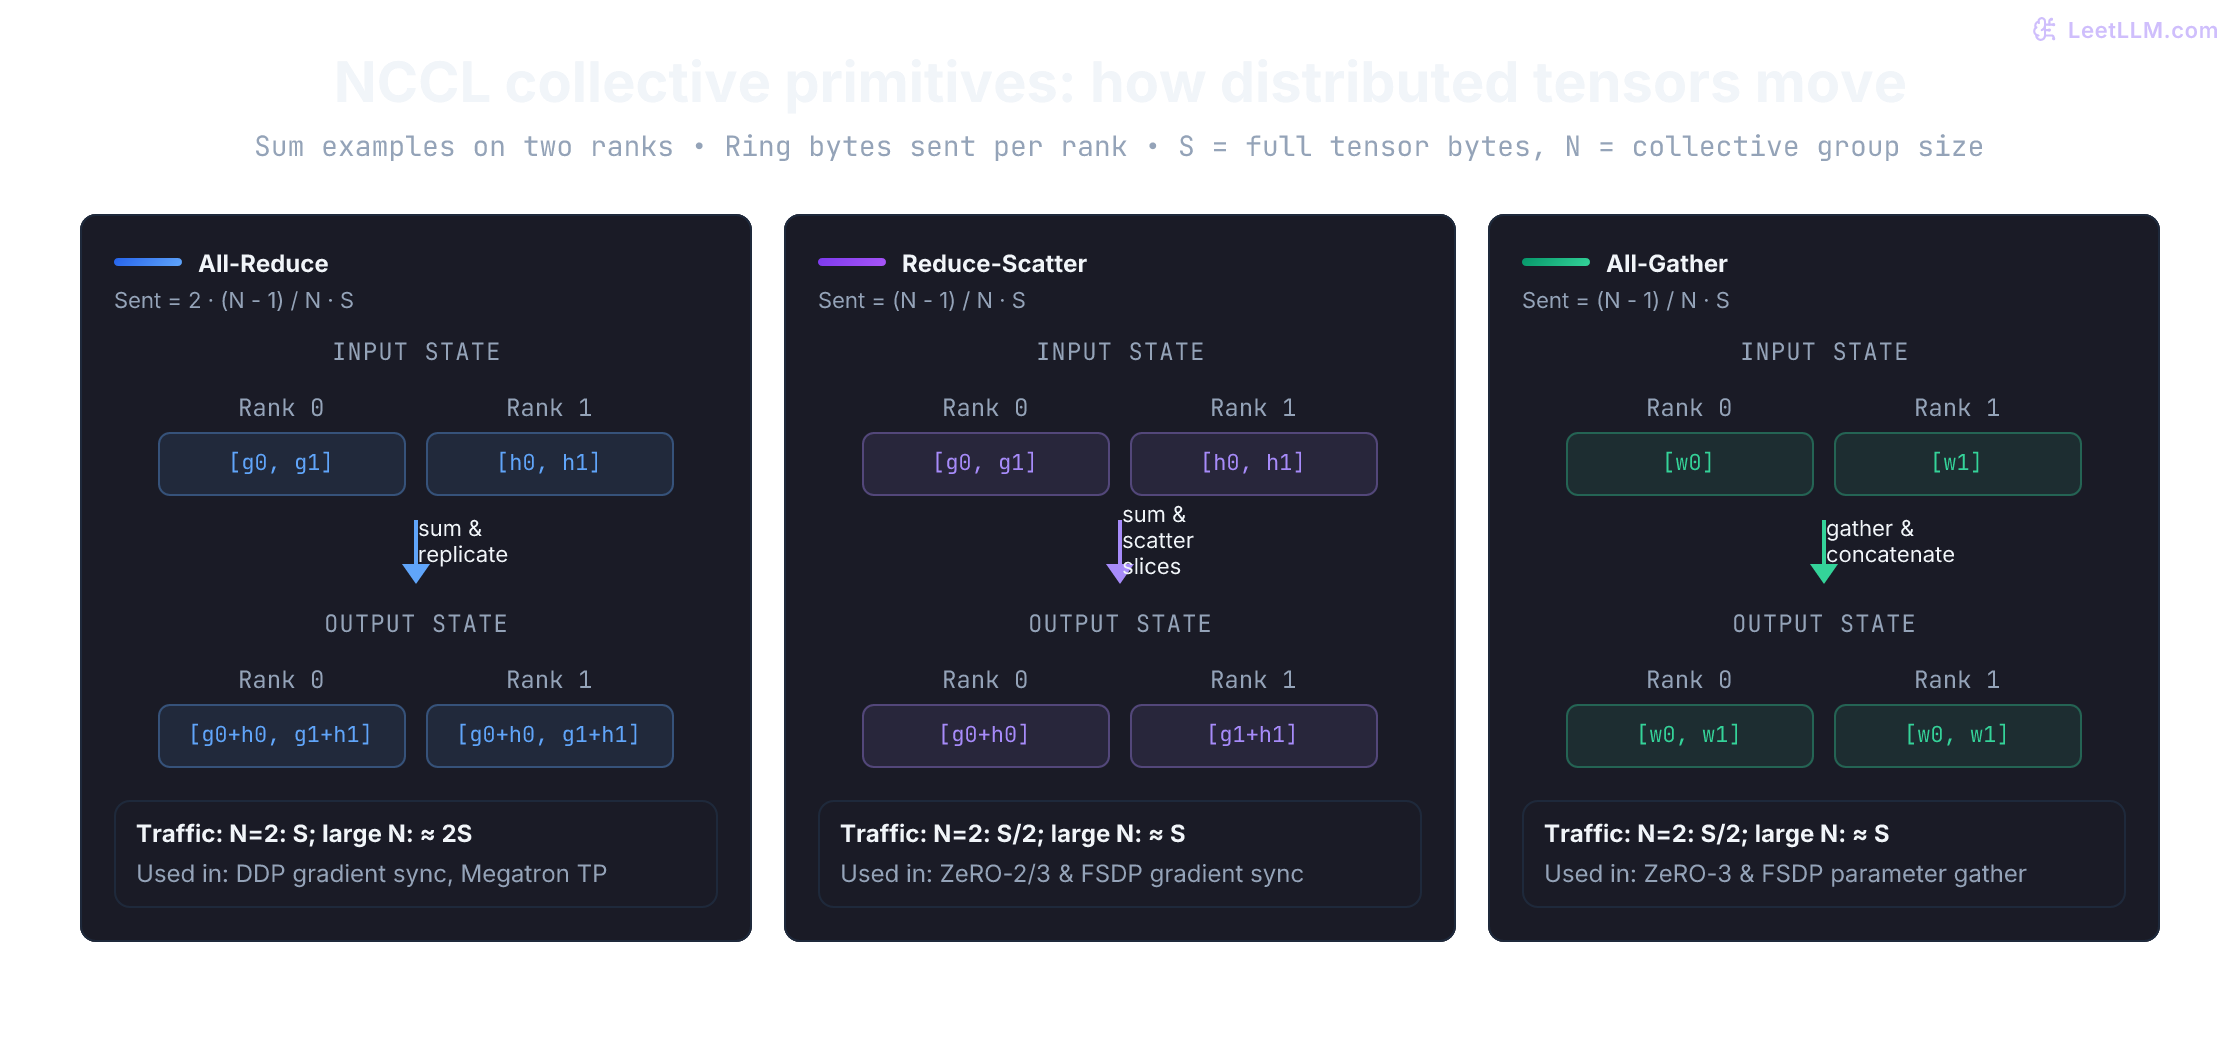
The NVIDIA Collective Communications Library (NCCL) powers inter-GPU communication across clusters.[3] Three primitives form the foundation of distributed training:
| Primitive | What it does (sum reduction shown) | Bytes sent per rank (ring model) | Where it shows up |
|---|---|---|---|
| All-reduce | Sums buffers across all ranks, then returns the full reduced sum to every rank | Classic DDP gradient sync, Megatron-LM TP RowParallel | |
| Reduce-scatter | Sums buffers across all ranks, but scatters only one chunk to each rank | ZeRO-2/3 and FSDP gradient sync | |
| All-gather | Collects shards from all ranks to reconstruct the full tensor on every rank | ZeRO-3 and FSDP parameter materialization before compute |
Here is the collective's group size, and is the full tensor size: the reduction input for all-reduce/reduce-scatter, or the reconstructed output for all-gather. Each all-gather input is only . The approximations require large and count sent bytes, excluding received bytes and protocol overhead. NCCL chooses algorithms for the operation and topology; the table isn't a measurement of every NCCL call.[4]
For the same reduction and shard layout, the primitives satisfy this mathematical identity:
A ring all-reduce uses a reduce-scatter phase followed by an all-gather phase. Bytes sent per rank total . Floating-point reductions in a different order can round differently, so an alternative implementation of the identity needn't return bit-identical values. NCCL also supports reductions other than sum; DDP's usual mean gradient includes division by the group size.
The next cell computes the collective results in one Python process. It checks the math, not networking, process-group ordering, or distributed execution.
rank_gradients = [[1, 2], [10, 20]]
summed = [sum(values) for values in zip(*rank_gradients)]

all_reduce_result = [summed.copy(), summed.copy()]
reduce_scatter_result = [[summed[0]], [summed[1]]]

parameter_shards = [["p0"], ["p1"]]
full_parameters = [token for shard in parameter_shards for token in shard]
all_gather_result = [full_parameters.copy(), full_parameters.copy()]

print("all_reduce=", all_reduce_result)
print("reduce_scatter=", reduce_scatter_result)
print("all_gather=", all_gather_result)
mean_gradient = [value / len(rank_gradients) for value in summed]
assert mean_gradient == [5.5, 11.0]
print("DDP_mean_gradient=", mean_gradient)all_reduce= [[11, 22], [11, 22]]
reduce_scatter= [[11], [22]]
all_gather= [['p0', 'p1'], ['p0', 'p1']]
DDP_mean_gradient= [5.5, 11.0]The interconnect hierarchy: NVLink vs InfiniBand
Start with the actual topology, not a rule that every server has eight interconnected GPUs. DGX H100 systems use NVLink/NVSwitch with a quoted 900 GB/s per GPU; DGX B200 quotes 1,800 GB/s. These are aggregate bidirectional GPU interconnect specifications, not measured one-way tensor-transfer rates.[5] Some servers have only PCIe peer connections. Conversely, a GB200 NVL72 joins 72 GPUs across a rack into one NVLink domain, so a fast domain needn't end at a server boundary.[6]
Across network interfaces, ConnectX-7 and ConnectX-8 offer examples of 400 Gb/s and 800 Gb/s networking.[7] Divide by eight: those line rates correspond to 50 GB/s and 100 GB/s per port in one direction, before overhead. They aren't guaranteed usable bandwidth per GPU. NIC sharing, PCIe paths, switch contention, message sizes, and collective algorithms all matter. Comparing a bidirectional aggregate NVLink number with a one-way NIC rate doesn't establish a universal slowdown factor.
GPU peer access over NVLink/PCIe and GPUDirect RDMA through a network adapter are different mechanisms. GPUDirect RDMA lets a compatible NIC transfer GPU-memory data without staging every payload through host memory; it doesn't turn the network into NVLink.[8]
Frequent per-layer collectives often benefit most from the fastest available domain. Place tensor-parallel groups there when practical, and measure whether pipeline boundaries or FSDP collectives can use the remaining network efficiently. Tensor and context parallelism can span nodes. Their feasibility depends on exposed communication and memory savings, rather than an absolute prohibition against InfiniBand or Ethernet.
The 1.5x heuristic
People often summarize ZeRO-3 communication as "about 1.5x DDP." That's a modeled volume ratio, not a throughput guarantee.[1]
First use the 140 GB low-precision weights above. If gradients also occupy 140 GB, a large-group estimate sends about 280 GB per rank for DDP and 420 GB for full sharding. The ratio is 1.5. It assumes one forward/backward pair, parameters freed after forward, and equal parameter and gradient communication dtypes.
Writing the element count as , the paper's simplified accounting is:
- DDP implements gradient all-reduce as reduce-scatter plus all-gather, modeled as moved per rank per step.
- ZeRO with optimizer and gradient partitioning replaces gradient all-reduce with reduce-scatter, then all-gathers updated parameters: in the same model. Check the actual stage-1 implementation before assigning it this schedule.
- ZeRO-3 / FULL_SHARD adds a second parameter all-gather so backward can run after the forward copy was freed. Two all-gathers plus one gradient reduce-scatter land at .
That gives . A ring-style all-gather or reduce-scatter actually sends a fraction of a full payload per rank; all-reduce has two such phases. Here "traffic" counts bytes sent, not sent plus received. Changing the algorithm, reduction dtype, resharding, or gradient-accumulation schedule changes the accounting.
Scheduling also matters. DDP groups gradients into buckets; full sharding introduces parameter gathers at communication-unit boundaries. Small collectives can become latency-bound, and waiting for a gather can expose communication that wasn't on the step's critical path before.
ZeRO-3 is most attractive when memory is the hard constraint. If the model already fits and the network is weak, DDP or ZeRO-2 style sharding can be faster.
parameter_gb = 140
gradient_gb = 140
ranks = 256
ring_fraction = (ranks - 1) / ranks
ddp_modeled_gb = 2 * gradient_gb * ring_fraction
full_shard_modeled_gb = (2 * parameter_gb + gradient_gb) * ring_fraction

print("DDP_modeled_traffic_GB=", ddp_modeled_gb)
print("FULL_SHARD_modeled_traffic_GB=", full_shard_modeled_gb)
print("byte_ratio=", full_shard_modeled_gb / ddp_modeled_gb)
print("warning=latency_and_overlap_still_determine_step_time")
fp32_gradient_gb = 280
mixed_ratio = (2 * parameter_gb + fp32_gradient_gb) / (2 * fp32_gradient_gb)
assert mixed_ratio == 1.0
print("BF16_gathers_FP32_reductions_ratio=", mixed_ratio)DDP_modeled_traffic_GB= 278.90625
FULL_SHARD_modeled_traffic_GB= 418.359375
byte_ratio= 1.5
warning=latency_and_overlap_still_determine_step_time
BF16_gathers_FP32_reductions_ratio= 1.0Why can ZeRO-3 be slower than DDP even if the back-of-the-envelope byte ratio is only about 1.5x?
Answer
Because the real cost isn't total bytes alone. ZeRO-3 and FSDP break communication into many layer-level all-gathers and reduce-scatters. On a weak or high-latency interconnect, those smaller, more frequent collectives can hurt throughput more than the simple 3P versus 2P byte model suggests.
FSDP (Fully Sharded Data Parallel)
ZeRO names the sharding strategy; FSDP is PyTorch's native way to express much of that strategy in a model and training loop.[9] The choice now becomes an API and composition decision, not another memory formula.
Current docs start new designs on torch.distributed.fsdp.fully_shard (FSDP2): per-parameter DTensor shards, no FlatParameter wrapper, and a clean migration path from FullyShardedDataParallel (FSDP1). The tutorial marks FSDP1 deprecated. You'll still read FSDP1 in older repos; start new work on fully_shard.[10][11]
People pick FSDP when they want PyTorch-native profilers, checkpointing, and DeviceMesh composition. torch.compile guidance is still to compile the highest-level train or eval step, or the top-level module, and to fall back to the inner module if a distributed wrapper causes issues. FSDP1 compile also needs use_orig_params=True. FSDP2 always uses original parameters, so that flag is gone.[12][13]
FSDP solves model-state memory. It doesn't solve activation memory. Long sequences and large micro-batches still push activations up, which is why FSDP is often paired with activation checkpointing.
How full sharding materializes one unit: the FSDP lifecycle
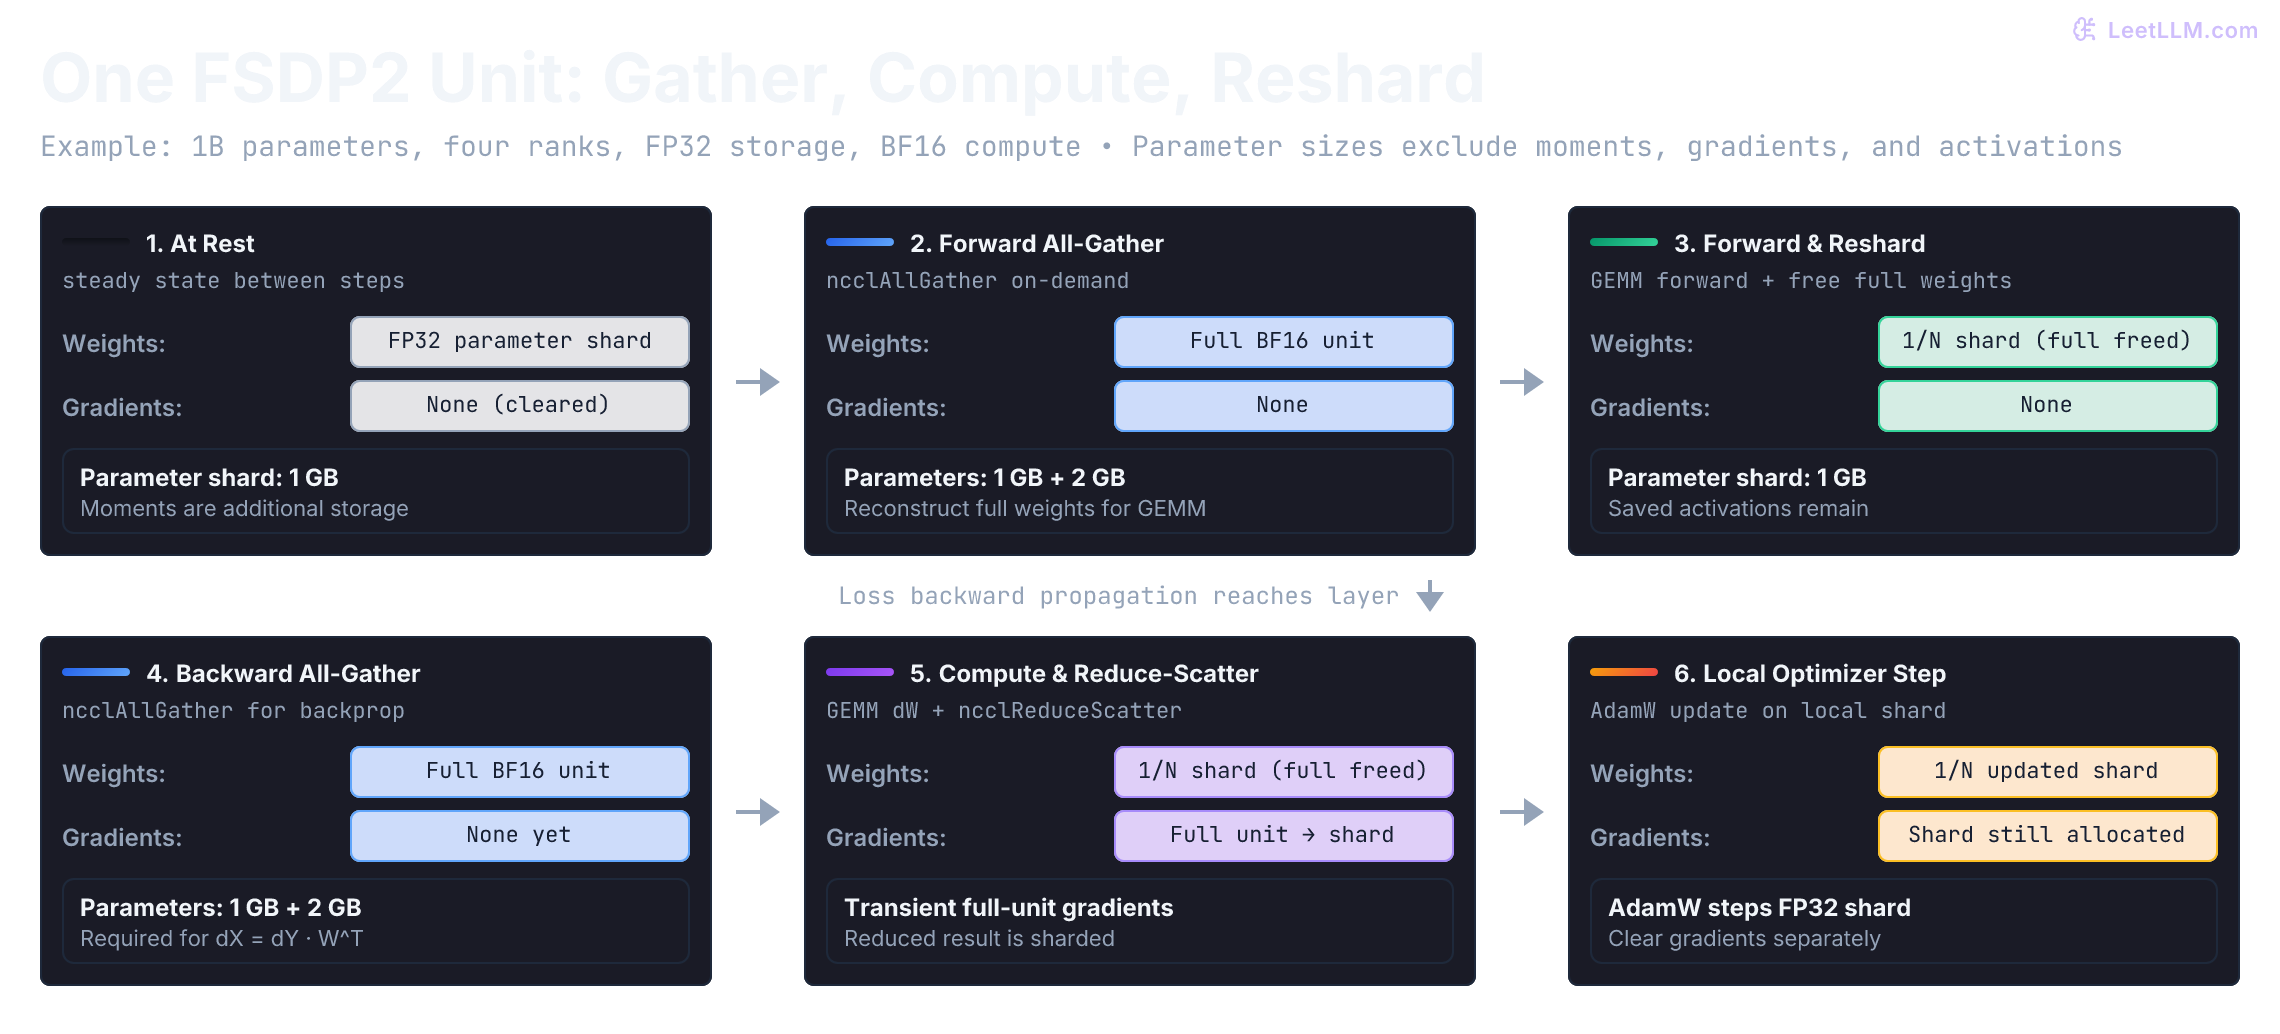
Follow one block with reshard_after_forward=True. For this example, stored parameter shards are FP32, the gathered compute copy is BF16, gradients reduce in FP32, and no CPU offload or accumulation is enabled.[10][11]
- At rest: Each rank holds its parameter shard and matching optimizer moments. After
zero_grad(set_to_none=True),.gradisNone, rather than an allocated zero tensor. Moment buffers exist after the first optimizer update. - Forward all-gather: Shards are gathered into full unit parameters in the policy's compute dtype. Wrapping each block separately prevents this from gathering the entire model at once.
- Forward compute and reshard: The block computes with full parameters and saves what backward needs. FSDP releases the unsharded parameter copy after forward. Activations, other units' prefetched parameters, and allocator reservations can remain; process memory needn't return to an exact baseline.
- Backward all-gather: The unit's full parameters are gathered again. For a linear layer, weights are needed for when computing its input gradient.
- Backward compute and reduce-scatter: Each rank computes local unsharded parameter gradients, such as . They temporarily exist before reduce-scatter combines contributions and leaves each rank its reduced gradient shard. Full parameters can be released after their backward uses finish. Sharding the stored gradient result doesn't eliminate these transient full-unit gradients.
- Optimizer update: After backward and required synchronization, ordinary AdamW updates each owned shard using its gradient and moments. Pure full sharding needs no additional parameter synchronization for this local update. Other operations can still communicate: global gradient-norm clipping needs a distributed norm, and hybrid sharding also synchronizes replica gradients.
optimizer.step()doesn't clear.grad; callzero_gradwhen appropriate.
Prefetching: overlapping communication with compute
Executing compute and collectives strictly in sequence exposes every transfer. FSDP2 starts with implicit prefetching: the CPU can enqueue the next unit's all-gather on a communication stream while the current unit's kernels run on the compute stream. Backward prefetch follows the reverse recorded forward order.[11]
The useful question is whether the next parameters arrive before compute needs them. In an ideal overlap window, exposed transfer time is . A 4 ms gather launched at the start of a 6 ms window can be hidden; launched only 1 ms before the next layer, it still exposes 3 ms. Different streams don't guarantee simultaneous progress: CPU issue delays, shared communication resources, and memory contention can shorten the window.
Start by profiling implicit prefetching. Explicit set_modules_to_forward_prefetch and set_modules_to_backward_prefetch can help CPU-bound workloads or gather multiple future units, at a cost in live parameter memory. The first gather also needs an earlier launch opportunity to overlap; there isn't always previous layer compute to hide it behind.
This sequence diagram traces communication for one wrapped unit in a two-GPU job with resharding after forward. Arrows summarize a collective, not NCCL's wire protocol; both ranks must enter matching operations.
FSDP2: fully_shard on DTensors
If you construct the optimizer before sharding, it sees the wrong parameter representation. Predict the safe order: shard blocks, shard the root, then create the optimizer over the resulting DTensor parameters.
For new code, apply fully_shard bottom-up: each transformer block becomes one communication group, then the root call shards leftover embeddings and heads. Build the optimizer after that, over the resulting DTensor parameters.[10][11]
reshard_after_forward controls the old sharding-strategy trade-off. True releases the full unit after forward and gathers again for backward (FULL_SHARD behavior). False retains unsharded parameters until backward finishes (SHARD_GRAD_OP behavior). With the current default None, PyTorch selects True for non-root modules and False for the root. This avoids a redundant root gather at the forward/backward boundary.
PyTorch 2.14 also allows an integer that is a proper divisor of the shard-group size. In an eight-rank group, reshard_after_forward=4 keeps larger partial parameter shards after forward and gathers within four-rank groups for backward. This trades more retained memory for a smaller backward gather group; it doesn't add an independent data-parallel replica axis.[10]
MixedPrecisionPolicy continues the previous chapter's dtype split. param_dtype is the unsharded compute and all-gather dtype. reduce_dtype is the gradient reduce-scatter dtype, and it can differ. Persistent sharded parameters stay in the original dtype, which is what the optimizer steps. Current docs are explicit: this setup doesn't add a second FP32 master copy on top of already-high-precision shards.[10][11]
This is an integration fragment, not a complete training program. Under torchrun, first select LOCAL_RANK's CUDA device and initialize the NCCL process group. Supply your model class with a blocks collection; the shown path assumes it starts in FP32 and fits host initialization memory. A 70B model needs a separate meta-device/sharded initialization path. The learning rate is illustrative, not a tuned SFT value.
import torch
import torch.distributed as dist
from torch.distributed.fsdp import MixedPrecisionPolicy, fully_shard

assert dist.is_initialized(), "initialize the process group before sharding"
mp_policy = MixedPrecisionPolicy(
    param_dtype=torch.bfloat16,
    reduce_dtype=torch.float32,
)

model = TransformerModel()
for block in model.blocks:
    fully_shard(block, mp_policy=mp_policy, reshard_after_forward=True)
fully_shard(model, mp_policy=mp_policy, reshard_after_forward=False)

optimizer = torch.optim.AdamW(model.parameters(), lr=2e-5)
Write the two recipes down before you size a cluster. The ZeRO paper's 16-byte convention stores low-precision parameters and gradients plus an FP32 master. FSDP2 mixed precision keeps the high-precision shard as the optimizer parameter, so you don't add that extra master on top.
params_billions = 70

def state_gb(bytes_per_param: int) -> int:
    return params_billions * bytes_per_param

zero_paper = {
    "stored_param": 2,
    "stored_grad": 2,
    "fp32_master": 4,
    "adam_moments": 8,
}
fsdp2_persistent = {
    "sharded_param_original_dtype": 4,
    "adam_moments": 8,
}
fsdp2_after_backward = {**fsdp2_persistent, "fp32_sharded_grad": 4}

print("zero_paper_bytes_per_param=", sum(zero_paper.values()))
print("zero_paper_states_GB=", state_gb(sum(zero_paper.values())))
print("fsdp2_persistent_param_and_adam_GB=", state_gb(sum(fsdp2_persistent.values())))
print("fsdp2_extra_master_bytes=", 0)
print("fsdp2_with_gradients_GB=", state_gb(sum(fsdp2_after_backward.values())))
assert sum(fsdp2_after_backward.values()) == 16
print("unsharded_bf16_copy=transient_around_compute")zero_paper_bytes_per_param= 16
zero_paper_states_GB= 1120
fsdp2_persistent_param_and_adam_GB= 840
fsdp2_extra_master_bytes= 0
fsdp2_with_gradients_GB= 1120
unsharded_bf16_copy=transient_around_computeThe 840 GB subtotal counts FP32 parameters and two FP32 moments before gradients. Once FP32 gradient shards exist, this FSDP2 recipe also totals 1,120 GB across the shard group. It reaches sixteen bytes differently: 4-byte parameters + 4-byte gradients + 8-byte moments. Gathered BF16 compute parameters are extra temporary storage. zero_grad(set_to_none=True) can release gradient storage between updates; retaining or accumulating gradients changes the live inventory.
Accumulation has a separate communication choice. FSDP2's set_requires_gradient_sync(False) suppresses gradient reductions, retaining unsharded accumulated gradients until synchronization resumes. Keeping reductions enabled preserves sharded gradient accumulation but pays for each reduction. set_reshard_after_backward(False) instead retains full parameters to avoid the next gather. These controls affect different buffers; disabling synchronization doesn't by itself suppress parameter gathers.[10]
| Feature | FSDP1 (FullyShardedDataParallel) | FSDP2 (fully_shard) |
|---|---|---|
| How it applies sharding | Wrapper module with flat parameters | In-place hooks on original modules |
| Sharding representation | FlatParameter groups | Per-parameter DTensor, usually Shard(0) |
| Parameter names | Flattened internals; state-dict APIs translate original names | Original fully qualified parameter names stay intact |
| Composition with TP / frozen params | More awkward | Better fit with DeviceMesh and frozen params |
| Prefetch / rate limits | backward_prefetch, limit_all_gathers | Implicit prefetch by default; set_modules_to_forward_prefetch / set_modules_to_backward_prefetch when you need explicit control. limit_all_gathers is gone because FSDP2 dropped that CPU sync. |
| CPU offload | CPUOffload(offload_params=True) offloads parameters and gradients; optimizer runs on CPU | CPUOffloadPolicy(): parameters, gradients, and optimizer states on host; optimizer step runs on CPU |
| Checkpointing style | Full and sharded state dict APIs | DTensor state dicts; Distributed Checkpoint (DCP) saves and reloads shards |
| Gradient clipping | fsdp_model.clip_grad_norm_() for sharded strategies | torch.nn.utils.clip_grad_norm_(model.parameters(), ...) works on DTensors |
FSDP2 also handles mixed frozen and trainable parameters in one communication group without FSDP1's extra gradient-memory cost for that mixture. Frozen weights still need materialization for computation, and can be needed to propagate input gradients. LoRA reduces what gets updated; it doesn't automatically remove all parameter gathers.
FSDP1 you'll still meet
Older code wraps FullyShardedDataParallel. The same three rules still matter:
- Wrap transformer blocks, not the whole model as one unit.
- Create the optimizer after wrapping.
- Don't treat
limit_all_gathers=Trueas an overlap knob.backward_prefetchis the overlap control;limit_all_gatherscaps in-flight all-gathers to control peak memory.[13]
This legacy integration fragment assumes torch.distributed.init_process_group() has already run under torchrun and that each rank has selected its local CUDA device. Its small attention stack demonstrates wrapping, not an SFT model: a language-model run also needs causal masking, token embeddings, labels, and a loss.
import torch
import torch.nn as nn
import functools
from torch.distributed.fsdp import (
    BackwardPrefetch,
    FullyShardedDataParallel as FSDP,
    MixedPrecision,
    ShardingStrategy,
)
from torch.distributed.fsdp.wrap import transformer_auto_wrap_policy

class TransformerDecoderLayer(nn.Module):
    def __init__(self, d_model=1024, n_heads=16):
        super().__init__()
        self.self_attn = nn.MultiheadAttention(d_model, n_heads, batch_first=True)
        self.ffn = nn.Sequential(
            nn.Linear(d_model, 4 * d_model),
            nn.GELU(),
            nn.Linear(4 * d_model, d_model),
        )
        self.norm1 = nn.LayerNorm(d_model)
        self.norm2 = nn.LayerNorm(d_model)

    def forward(self, x, mask=None):
        attn_out, _ = self.self_attn(x, x, x, attn_mask=mask, need_weights=False)
        x = self.norm1(x + attn_out)
        ffn_out = self.ffn(x)
        x = self.norm2(x + ffn_out)
        return x

my_auto_wrap_policy = functools.partial(
    transformer_auto_wrap_policy,
    transformer_layer_cls={TransformerDecoderLayer},
)

mixed_precision_policy = MixedPrecision(
    param_dtype=torch.bfloat16,
    reduce_dtype=torch.bfloat16,
    buffer_dtype=torch.bfloat16,
)

model = nn.Sequential(*[
    TransformerDecoderLayer(d_model=1024, n_heads=16)
    for _ in range(8)
])

fsdp_model = FSDP(
    model,
    auto_wrap_policy=my_auto_wrap_policy,
    sharding_strategy=ShardingStrategy.FULL_SHARD,
    mixed_precision=mixed_precision_policy,
    backward_prefetch=BackwardPrefetch.BACKWARD_PRE,
    limit_all_gathers=True,
    device_id=torch.cuda.current_device(),
)

optimizer = torch.optim.AdamW(fsdp_model.parameters(), lr=2e-5)
The most important FSDP choice is usually sharding granularity. Use transformer blocks as communication units. If one root unit owns the entire model, every all-gather becomes too large and peak memory shoots back up.
Use a smaller four-block stack to isolate granularity. Each block has an assumed 3.5 GB compute-weight payload. This calculation counts only gathered copies; persistent shards, activations, and prefetched neighboring blocks are additional:
block_parameter_gb = [3.5, 3.5, 3.5, 3.5]

root_only_peak_full_materialization = sum(block_parameter_gb)
blockwise_peak_full_materialization = max(block_parameter_gb)

print("root_only_active_parameters_GB=", root_only_peak_full_materialization)
print("blockwise_active_parameters_GB=", blockwise_peak_full_materialization)
print("modeled_reduction=", root_only_peak_full_materialization / blockwise_peak_full_materialization)root_only_active_parameters_GB= 14.0
blockwise_active_parameters_GB= 3.5
modeled_reduction= 4.0Sharding strategy names
| Behavior | FSDP1 | FSDP2 | What it does |
|---|---|---|---|
| Full shard | FULL_SHARD | reshard_after_forward=True | Shards parameters, gradients, and optimizer states. Frees the full unit after forward. |
| Keep params through backward | SHARD_GRAD_OP | reshard_after_forward=False | Unshards for forward, keeps them until backward finishes, then reshards. Higher peak, fewer all-gathers. |
| Hybrid shard | HYBRID_SHARD | 2D DeviceMesh plus reshard_after_forward=True | Shard across mesh dimension 1, replicate across dimension 0. Rank placement must map dimension 1 to the intended fast-link group. |
| Replicate | NO_SHARD | Don't shard; use DDP | Full model states on every rank. No sharded parameter materialization. |
Hybrid sharding saves cross-node communication by giving up some memory savings. With four nodes of eight GPUs, full sharding across all 32 ranks gives the 70B recipe a 35 GB model-state lower bound per GPU. Sharding only within each eight-GPU node gives 140 GB per GPU instead: 1120 / 8, not 1120 / 32. Four replicas of the shard group remain. That hybrid arrangement doesn't fit the assumed 80 GB capacity without another change.
Checkpointing, resume, and fault recovery
An out-of-memory fix that can't resume faithfully is still an incomplete training system. Treat the checkpoint as the state needed to take the next optimizer step, not as a copy of weights for inference.
Nodes can reboot, instances can be preempted, and jobs can be rescheduled. A weights-only checkpoint restores the model, but not Adam's update history or the next data batch.[14]
For a real resume point, the checkpoint usually needs at least:
| Must-save state | Why it matters on resume |
|---|---|
| Model weights | Restores current parameters |
| Optimizer state | Preserves momentum and adaptive moments |
| Scheduler state | Keeps warmup and decay aligned with training step |
| Gradient-scaler / AMP state, if used | Preserves mixed-precision control state across resume |
| Consumed step or token count | Lets logs, schedulers, and stop rules stay honest |
| Sampler / dataloader cursor | Prevents replaying or skipping large data regions |
| RNG state | Keeps dropout, shuffling, and sampling reproducible when needed |
In a sharded system, the safest default is to save sharded checkpoints, not to gather everything onto rank 0 first. FSDP2 and distributed checkpoint APIs are pushing in that direction because the "collect all weights on one machine and write a giant file" pattern eventually becomes the bottleneck or the failure point.[10][14]
DeepSpeed's Universal Checkpointing supports topology changes through an explicit workflow: save an ordinary ZeRO checkpoint, convert it with ds_to_universal.py, then load with checkpoint.load_universal enabled. The destination still needs compatible model tensors and a valid topology; this isn't an arbitrary model-conversion tool.[15]
The operational rule is simple:
- Save checkpoints by training step and consumed tokens, not vague names like
latest-final. - Test one real resume path early in the run, before trusting a week-long job to it.
- Compare the next batch, loss, gradients, updated parameters, and optimizer counters with an uninterrupted run, using tolerances appropriate to the kernels and dtype.
Save at a completed optimizer-step boundary for the simplest resume contract. A checkpoint taken mid-accumulation also needs accumulated gradients and the microstep position. Changing world size can change batch grouping and floating-point reduction order even when tensor reshaping succeeds.
The CPU experiment below tests one part of that contract with real PyTorch updates. A small layer with dropout takes three AdamW steps, saves to an in-memory checkpoint, then takes a fourth step. A restored run must reproduce that fourth update. A weights-only restore sees the same pre-update loss but takes a different update because it lost Adam's moments and step counter.
import io
import torch
from torch import nn

torch.set_num_threads(1)
torch.manual_seed(7)
x = torch.tensor([[1., 0.], [0., 1.], [1., 1.], [-1., 2.]])
y = torch.tensor([[1.], [-1.], [0.], [-3.]])

def make_run():
    model = nn.Sequential(nn.Linear(2, 4), nn.Tanh(), nn.Dropout(0.25), nn.Linear(4, 1))
    return model, torch.optim.AdamW(model.parameters(), lr=0.01)

def step(model, optimizer):
    optimizer.zero_grad(set_to_none=True)
    loss = (model(x) - y).square().mean()
    loss.backward()
    optimizer.step()
    return loss.detach()

model, optimizer = make_run()
for _ in range(3):
    step(model, optimizer)
buffer = io.BytesIO()
torch.save({"model": model.state_dict(), "optimizer": optimizer.state_dict(),
            "rng": torch.get_rng_state(), "completed_steps": 3}, buffer)
expected_loss = step(model, optimizer)
expected_params = torch.cat([p.detach().flatten() for p in model.parameters()])

def restore(include_optimizer):
    buffer.seek(0)
    saved = torch.load(buffer, weights_only=True)
    restored, restored_optimizer = make_run()
    restored.load_state_dict(saved["model"])
    if include_optimizer:
        restored_optimizer.load_state_dict(saved["optimizer"])
    # Model construction consumed RNG; restore it after construction and loading.
    torch.set_rng_state(saved["rng"])
    loss = step(restored, restored_optimizer)
    params = torch.cat([p.detach().flatten() for p in restored.parameters()])
    return loss, params

resumed_loss, resumed_params = restore(True)
weights_only_loss, weights_only_params = restore(False)
torch.testing.assert_close(resumed_loss, expected_loss, rtol=0, atol=0)
torch.testing.assert_close(resumed_params, expected_params, rtol=0, atol=0)
torch.testing.assert_close(weights_only_loss, expected_loss, rtol=0, atol=0)
assert not torch.equal(weights_only_params, expected_params)
print("full_resume_next_update_equal=", torch.equal(resumed_params, expected_params))
print("weights_only_same_loss=", torch.equal(weights_only_loss, expected_loss))
print("weights_only_same_update=", torch.equal(weights_only_params, expected_params))full_resume_next_update_equal= True
weights_only_same_loss= True
weights_only_same_update= FalseThis is a CPU checkpoint round trip, not an FSDP or DeepSpeed restore test. A distributed test must also exercise shard loading on every rank, per-rank RNG and data position, scheduler state, and the intended world size. Matching the first resumed loss alone would miss the broken weights-only case above.
DeepSpeed ZeRO
If native sharding solves persistent GPU memory but the run still needs host or NVMe capacity, the unresolved question is where those states should live and what transfer cost the step can tolerate.
DeepSpeed is an open-source training runtime originally developed at Microsoft. It implements ZeRO and offloading through ZeRO-Offload and ZeRO-Infinity.[1][16] Consider it when you need that memory hierarchy or already use a Megatron-DeepSpeed integration.
One important DeepSpeed-specific detail is that ZeRO-3 depends on consistent module execution order across ranks. Dynamic routing patterns such as Mixture of Experts (MoE) can deadlock parameter all-gathers if different ranks enter different submodules, which is why DeepSpeed exposes the idea of ZeRO-3 leaf modules.[17]
This integration fragment configures a small, non-causal attention stack through the DeepSpeed launcher. It isn't a complete language-model training script. The config optimizer name is AdamW; under the shown default CPU-offload path, DeepSpeed selects DeepSpeedCPUAdam with AdamW mode internally. That class name isn't the config type. CPU Adam's compiled extension and BF16-capable accelerators must be available.[18]
The bucket settings count elements, not bytes: 500 million BF16 values alone occupy 1 GB, before extra buffers. These values are illustrative defaults to tune, not a memory recommendation.[19] With micro-batch 1 and accumulation 8, the effective example batch is 8 * data_parallel_size sequences per optimizer update.
import deepspeed
import torch.nn as nn

ds_config = {
    "train_micro_batch_size_per_gpu": 1,
    "gradient_accumulation_steps": 8,
    "bf16": {
        "enabled": True,
    },
    "optimizer": {
        "type": "AdamW",
        "params": {
            "lr": 2e-5,
            "betas": [0.9, 0.999],
            "eps": 1e-8,
            "weight_decay": 0.01,
        },
    },
    "zero_optimization": {
        "stage": 3,
        "offload_optimizer": {
            "device": "cpu",
            "pin_memory": True,
        },
        "offload_param": {
            "device": "cpu",
            "pin_memory": True,
        },
        "overlap_comm": True,
        "contiguous_gradients": True,
        "reduce_bucket_size": 500_000_000,
        "stage3_prefetch_bucket_size": 50_000_000,
        "stage3_param_persistence_threshold": 100_000,
    }
}

class SimpleTransformer(nn.Module):
    def __init__(self, d_model=1024, n_layers=4):
        super().__init__()
        self.layers = nn.ModuleList([
            nn.TransformerEncoderLayer(d_model, nhead=16, batch_first=True)
            for _ in range(n_layers)
        ])
        self.proj = nn.Linear(d_model, 1000)

    def forward(self, x):
        for layer in self.layers:
            x = layer(x)
        return self.proj(x)

model = SimpleTransformer(d_model=1024, n_layers=4)

model_engine, optimizer, _, _ = deepspeed.initialize(
    model=model,
    config=ds_config,
    model_parameters=model.parameters(),
)

# for batch in dataloader:
#     outputs = model_engine(batch)
#     loss = compute_loss(outputs)
#     model_engine.backward(loss)
#     model_engine.step()
With the current default managed_gradient_accumulation=True, call model_engine.step() after every micro-batch as shown. The engine updates only at the configured boundary and backward(loss) applies its accumulation scaling. Dividing the same mean loss by eight yourself would scale it twice. Unmanaged accumulation transfers boundary ownership to the caller; variable target counts still require the intended token weighting, rather than a mean of micro-batch means.[17]
ZeRO-Infinity: CPU and NVMe offloading
DeepSpeed extends ZeRO-3 with ZeRO-Infinity, which allows offloading sharded parameters and optimizer states to CPU RAM or even NVMe SSDs.[16]
| Tier | What lives there | Transfer boundary to measure | Example use |
|---|---|---|---|
| GPU | HBM | Device-memory traffic under the actual kernels | Active parameters, activations, temporary buffers |
| CPU | Host RAM | Host DRAM bandwidth and separately the GPU-host link, such as PCIe or NVLink-C2C | Offloaded parameter/gradient shards and optimizer states |
| NVMe | Local storage | Sustained reads/writes at the intended queue depth, plus storage-host and host-GPU transfers | State spillover when host RAM is insufficient |
Avoid treating host DRAM bandwidth as GPU-host transfer bandwidth. Even GPU specifications vary: the cited HGX reference lists H100 SXM memory bandwidth at 3.35 TB/s and B200 at up to 8 TB/s.[20] Neither number is a measured offload rate. Storage generation alone also doesn't determine a drive array's throughput.
This makes some otherwise impossible training runs feasible, but it doesn't make offload free. Once parameters or optimizer state spill into CPU or NVMe, throughput becomes constrained by PCIe bandwidth, host memory bandwidth, storage latency, and how well the runtime can overlap data movement with compute.
DeepSpeed's current configuration reference supports AutoTP training with ZeRO stages 0 through 3, while PipelineModule excludes ZeRO-2 and ZeRO-3.[21][22] Checked October 10, 2026: accumulation uses the 0.19.8 API docs, and the pipeline restriction appears in the stable 0.19.7 reference. Older releases and some historical tutorial text have narrower AutoTP support; record the installed version and test the intended combination.
The following local gate encodes only the documented stage restrictions checked for this lesson. allowed=True means "this particular restriction didn't reject it," not "the runtime initialized successfully." Model support, topology, installed version, and other features still need a launch test.
requested_runs = [
    {"feature": "AutoTP", "zero_stage": 2},
    {"feature": "AutoTP", "zero_stage": 3},
    {"feature": "PipelineModule", "zero_stage": 2},
]

def supported(run):
    if run["feature"] == "AutoTP":
        return run["zero_stage"] in {0, 1, 2, 3}
    if run["feature"] == "PipelineModule":
        return run["zero_stage"] in {0, 1}
    return False

for run in requested_runs:
print(run["feature"], f"ZeRO-{run['zero_stage']}", "stage_gate_pass=", supported(run))AutoTP ZeRO-2 stage_gate_pass= True
AutoTP ZeRO-3 stage_gate_pass= True
PipelineModule ZeRO-2 stage_gate_pass= FalseFSDP vs DeepSpeed comparison
Both frameworks solve the same core problem, but they optimize for different operational constraints. FSDP optimizes for staying close to standard PyTorch. DeepSpeed optimizes for a wider set of large-scale runtime features.
| Feature | FSDP | DeepSpeed ZeRO |
|---|---|---|
| Runtime model | Native PyTorch distributed stack | Separate DeepSpeed runtime |
| ZeRO stages | ZeRO-2-like and ZeRO-3-like sharding modes | Native ZeRO-1/2/3 |
| CPU offloading | FSDP2 CPUOffloadPolicy() moves parameters, gradients, and optimizer states to host memory; optimizer runs on CPU. FSDP1 CPUOffload(offload_params=True) also offloads gradients and runs the optimizer on CPU. | CPU and NVMe via ZeRO-Offload / ZeRO-Infinity |
| NVMe offloading | No built-in FSDP policy | Supported by ZeRO-Infinity |
| Compile story | Compile the train step or top-level module first; fall back to the inner module if the wrapper causes issues. FSDP1 needs use_orig_params=True | Depends on integration path |
| Pipeline parallel | Compose with PyTorch distributed pipelining separately from FSDP | Built-in, but PipelineModule excludes ZeRO-2/3 |
| Tensor parallel | FSDP2 composes with TP on a DeviceMesh; not a Megatron replacement | AutoTP or Megatron integration (AutoTP supports ZeRO-0/1/2/3) |
| Checkpointing / tooling | Standard PyTorch APIs | DeepSpeed-specific runtime APIs |
| Debugging | Standard PyTorch stack traces and profiler | More runtime-specific behavior |
Which stack to start with
- Use FSDP when you want the PyTorch-native path,
DeviceMeshcomposition, and standard profilers and checkpoints. GPU memory after sharding, or FSDP2's CPU offload, is enough. - Use DeepSpeed when NVMe spillover is non-negotiable, you need ZeRO-Infinity's host/storage hierarchy, or you're already in a DeepSpeed or Megatron-DeepSpeed stack whose TP/PP requirements fit the current stage-compatibility rules.
You already know the model-state math fits once sharded. What question decides whether you stay with FSDP or reach for DeepSpeed?
Answer
Ask what requirement remains unsolved after sharding. If you mainly want native PyTorch tooling and standard checkpointing, stay with FSDP. If you still need NVMe offload, ZeRO-Infinity, or the rest of the stack already depends on DeepSpeed-specific runtime features, DeepSpeed becomes the better operational fit.
Beyond data parallelism: 4D parallelism
When sharding alone leaves either one layer or one sequence too large, data-parallel sharding hits hard limits:
- Batch constraints: With equal local micro-batches, , where is the number of accumulated micro-batches per optimizer update. Pure DP on 1,024 ranks with at least one sequence per rank implies at least 1,024 sequences per update. That may exceed the desired token batch, but it doesn't automatically make training unstable. Check the optimization budget and learning-rate recipe.
- One unit is too large: Full sharding still gathers each wrapped unit. As a hypothetical example, a BF16 matrix of shape alone occupies about 2.15 GB. Several matrices, transient gradients, and activations can coexist. Splitting the matrix computation is a different memory intervention from sharding its persistent storage.
- A sequence is too large: Materializing attention scores uses memory. FlashAttention avoids that full matrix with tiled exact attention, but saved tensors and layer outputs still grow with sequence length, and dense attention's arithmetic remains quadratic. Whether 128k or 1M tokens fit depends on model shape, implementation, checkpointing, and available memory.
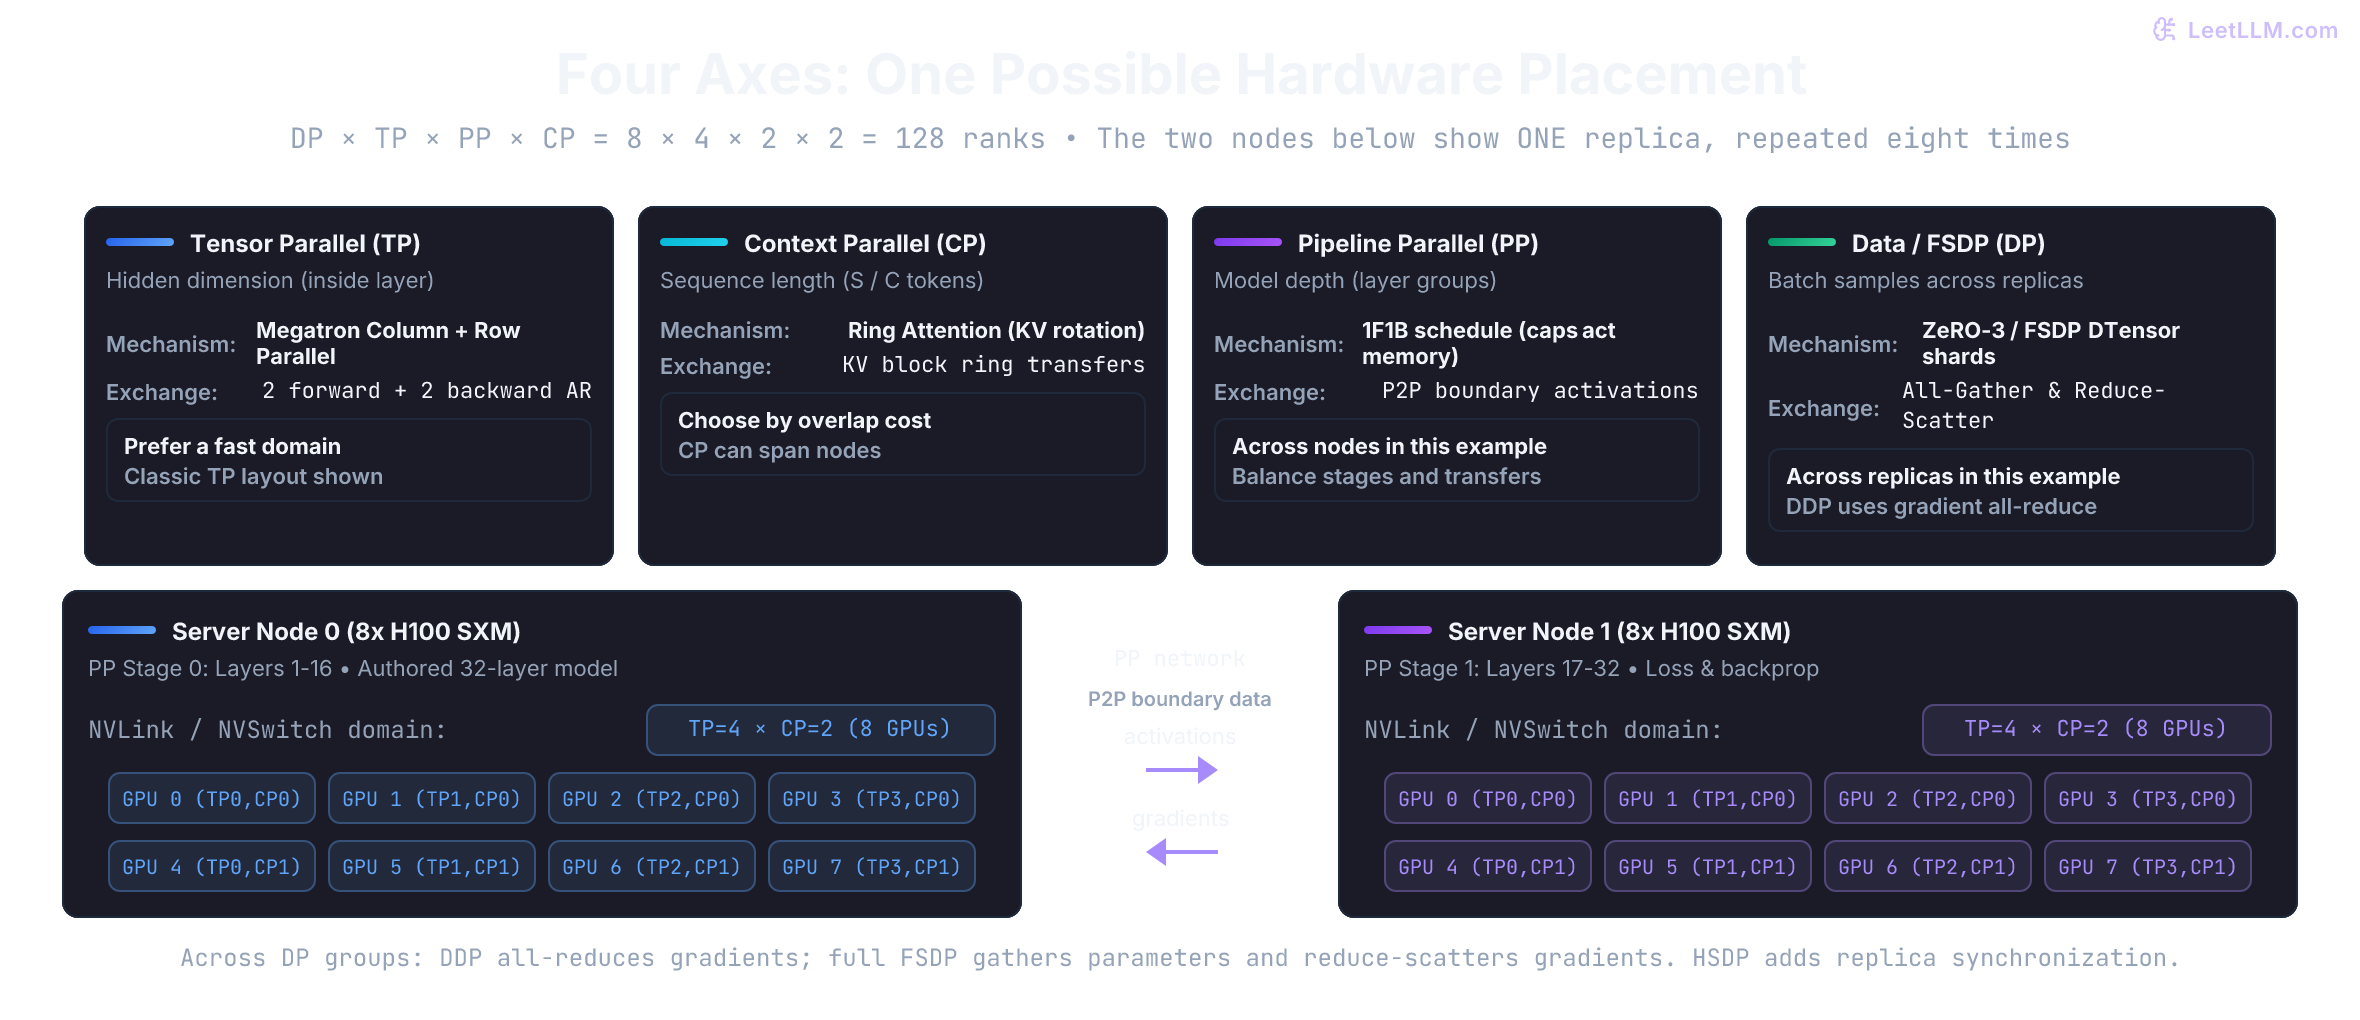
These constraints motivate combining four axes, often called 4D parallelism:[23][24][25]
This formula assumes a regular Cartesian mesh with one process per device and no extra expert-parallel axis. Here DP counts independent sequence replicas. TP, PP, and CP cooperate on each replica's data; multiplying any of them doesn't add independent examples to the global batch. Some frameworks include CP ranks in gradient-reduction groups, so distinguish group membership from this batch-counting definition.
Tensor parallelism (Megatron-LM ColumnParallel & RowParallel)
Tensor parallelism (TP) splits individual weight matrices inside a transformer block across multiple GPUs.[23] Shoeybi et al. designed a pairing of column-parallel and row-parallel linear layers that minimizes collective communication:
The MLP block decomposition
In a standard transformer MLP, activations pass through two linear layers: .
- ColumnParallelLinear (): The weight matrix is sliced along its columns into shards: , where each shard has size .
- Input is duplicated across all TP ranks.
- Each rank computes its slice of the output: .
- Because the activation function operates elementwise, each rank evaluates locally without any cross-GPU communication!
- RowParallelLinear (): The second weight matrix is sliced along its rows: , where each shard has size .
- Each rank computes partial product .
- To produce the final layer output , the ranks execute an All-Reduce!
The Self-Attention block decomposition
For classic multi-head attention with replicated token inputs and complete heads on each TP rank:
- Projections are ColumnParallelLinear: attention heads are partitioned across ranks (e.g. 32 heads across 4 GPUs = 8 heads per GPU). Each rank computes attention for its assigned heads without a TP exchange inside that attention calculation. Adding CP introduces a separate exchange of sequence information.
- Output projection is RowParallelLinear, followed by a single All-Reduce to sum attention outputs across heads.
This classic Megatron layout uses two all-reduces in forward and two in backward per transformer layer.[24] It assumes the replicated-input/output layout just described. Sequence parallelism and other layouts can replace those collectives with all-gather/reduce-scatter patterns. Frequent per-layer synchronization makes placement and overlap important, but it doesn't impose a particular NVLink bandwidth as a correctness requirement.
Pipeline parallelism & 1F1B bubble mechanics
Pipeline parallelism (PP) partitions the model across depth by assigning consecutive layer ranges to different devices or server nodes (e.g. Stage 0 holds layers 1-16; Stage 1 holds layers 17-32).[24]
Pipeline boundaries usually use point-to-point transfers: stage sends activations to stage in forward and receives their gradients in backward. A job combining PP with DP or TP also has the collectives required by those axes.
The GPipe bubble problem
GPipe schedules all forward micro-batches before their backward passes. Each stage retains what backward needs for those micro-batches; recomputation can reduce the bytes per micro-batch, but the retained inventory still grows with .
For balanced stages with per-micro-batch forward/backward times and , ignoring transfer and optimizer time, useful work is and the fill/drain bubble is .[24] Two ratios answer different questions:
With eight stages and one micro-batch, overhead is 700%, while the idle fraction is 87.5%. A fraction of elapsed time can't exceed 100%.
The 1F1B schedule (One Forward, One Backward)
One forward, one backward (1F1B) appeared in PipeDream before the 2021 Megatron paper.[26] Megatron's default PipeDream-Flush variant finishes the batch's backwards before the optimizer update, preserving synchronous update semantics. It differs from the original asynchronous PipeDream weight-versioning scheme.[24]
For the classic non-interleaved flush schedule, number stages from :
- Warmup: stage runs forward micro-batches before its alternating phase.
- Steady state: run one forward, then one backward for an earlier micro-batch.
- Drain: finish the remaining backward passes before the batch update.
The maximum outstanding forwards on stage is , including a steady-state forward before its paired backward. The current Megatron implementation reflects the warmup count and releases completed entries.[27] This limits the number of retained micro-batch activation sets; it isn't a guarantee about total allocator memory or every interleaved schedule.
Plain 1F1B reduces activation retention; it has the same ideal fill/drain bubble as GPipe. Increasing reduces that bubble for either schedule. At , the idle fraction is . The general choice gives an idle fraction below 20%, not always below 18%.
for stages, microbatches in [(8, 1), (8, 32), (64, 256)]:
    overhead = (stages - 1) / microbatches
    idle_fraction = (stages - 1) / (microbatches + stages - 1)
    assert 0 <= idle_fraction < 1
    print(f"p={stages}, m={microbatches}: overhead={overhead:.2%}, elapsed_idle={idle_fraction:.2%}")

assert 63 / 319 > 0.18  # m = 4p doesn't always put idle time below 18%.
stages, microbatches = 4, 8
warmup = [min(microbatches, stages - stage - 1) for stage in range(stages)]
live = [min(microbatches, stages - stage) for stage in range(stages)]
print("warmup_forwards=", warmup)
print("max_outstanding_forwards=", live)p=8, m=1: overhead=700.00%, elapsed_idle=87.50%
p=8, m=32: overhead=21.88%, elapsed_idle=17.95%
p=64, m=256: overhead=24.61%, elapsed_idle=19.75%
warmup_forwards= [3, 2, 1, 0]
max_outstanding_forwards= [4, 3, 2, 1]Interleaving multiple model chunks per device can reduce the ideal bubble, while increasing boundary transfers. Choosing a schedule requires memory and timing evidence, including stage imbalance, rather than the 1F1B name alone.
Context parallelism & Ring Attention
If one sequence is too large, context parallelism (CP) can partition its tokens across devices. Each rank owns roughly query positions but still needs information from other sequence blocks for global attention.[25]
Ring Attention coordinates this sequence partition without materializing full attention matrices:
- Query tokens remain stationary on each local GPU.
- Key and value blocks rotate around a logical ring. PyTorch implementations can use asynchronous point-to-point transfers; the original paper's JAX implementation uses
lax.ppermute. - Block attention computes while transfers for subsequent blocks progress. Online softmax statistics combine the blocks without constructing the full matrix.
Hiding transfers requires sufficient block compute time and a suitable schedule. Short blocks, limited bandwidth, and workload imbalance can expose communication. CP also includes implementations with other exchange patterns. It isn't restricted to intra-node NVLink: the Ring Attention paper evaluates a 32-A100 InfiniBand setup. Longer feasible context is a memory benefit, not proof of unchanged step time or improved task quality.
| Parallelism | What is divided | Example communication | Placement question |
|---|---|---|---|
| Data / FSDP (DP) | Independent sequences; FSDP also shards model states | DDP all-reduce, or FSDP all-gather/reduce-scatter | Can collectives overlap across the chosen group? |
| Tensor (TP) | Matrices and computation inside layers | Classic layout: 2 forward + 2 backward all-reduces per layer | What is the exposed per-layer exchange cost? |
| Pipeline (PP) | Layer groups | Boundary activations and their gradients | Are stage compute times balanced? |
| Context (CP) | Tokens of one sequence | Ring KV transfers, or another supported exchange | Can block compute hide exchange time? |
Each topology degree multiplies into the required world size. Calculate it before reserving hardware:
topology = {
    "data_parallel": 8,
    "tensor_parallel": 4,
    "pipeline_parallel": 2,
    "context_parallel": 2,
}

world_size = 1
for degree in topology.values():
    world_size *= degree

print("world_size=", world_size)
print("ranks_per_data_replica=", topology["tensor_parallel"] * topology["pipeline_parallel"] * topology["context_parallel"])
assert world_size == 128
micro_batch_sequences = 1
accumulated_microbatches = 4
global_batch_sequences = micro_batch_sequences * accumulated_microbatches * topology["data_parallel"]
assert global_batch_sequences == 32
print("global_batch_sequences=", global_batch_sequences)world_size= 128
ranks_per_data_replica= 16
global_batch_sequences= 32Debugging & profiling distributed training
Distributed training turns a local symptom into a coordination question. Before changing a config, decide whether the first failure is a rank mismatch, a memory peak, a data stall, or a communication schedule.
Distributed training fails in ways that single-GPU training doesn't. Jobs hang instead of crash. One bad rank can stall everybody else. Performance regressions often come from communication scheduling, not math kernels.
Common failure modes
- NCCL timeouts or hangs: A rank may have died earlier or entered a different collective pattern. Find the first error across rank logs.
TORCH_NCCL_BLOCKING_WAITchanges whetherwait()blocks; it isn't a general hang fix. Timeout dumps require bothTORCH_NCCL_DUMP_ON_TIMEOUT=1and a positiveTORCH_NCCL_TRACE_BUFFER_SIZE.[28] - Startup OOM: Large models can OOM before training starts if you materialize full parameters too early. Lazy or meta-device initialization (
torch.device("meta")) matters. - Wrong gradient clipping: With an FSDP1 sharded strategy, use
fsdp_model.clip_grad_norm_()because it computes across sharded gradients. FSDP2's DTensor-based parameters instead supporttorch.nn.utils.clip_grad_norm_(model.parameters(), ...)in the current tutorial.[13][11]
Profiling tools
Throughput (tokens/sec) only moves after you know whether the step is compute-bound or communication-bound. A credible comparison records accelerator model and count, topology, model and sequence shape, micro-batch and accumulation, dtype, sharding and prefetch settings, warmup and steady-state window, exact baseline, and correctness or convergence checks.
Count unique input tokens across independent DP replicas. TP and PP ranks share those examples, and CP ranks split their tokens; summing a replicated token counter over every rank overstates throughput. Report whether padding is included. Collective durations can overlap compute and each other, so their sum isn't the communication time exposed on the iteration's critical path.
Report the boundary you changed with the result. "FSDP is faster" isn't reproducible evidence until another engineer can reconstruct the workload and verify that both runs reached the same loss or task quality.
torch.profiler: Look atncclAllGather,ncclReduceScatter, and gaps where GPUs wait for communication. For FSDP1, tune wrapping granularity andbackward_prefetch; uselimit_all_gathers=Truefor peak-memory rate limiting, not as the overlap knob. For FSDP2, use its module prefetch APIs when implicit scheduling is insufficient.[13][10]- DeepSpeed's FLOPs Profiler estimates model compute and module timing. Pair it with communication logs and device/CPU traces to attribute collective waits or offload transfers; FLOP counts alone don't separate those costs.
For hard distributed bugs, capture one clean repro run with NCCL_DEBUG=INFO and TORCH_DISTRIBUTED_DEBUG=DETAIL instead of trying to reason from high-level symptoms alone.
Training observability signals that matter
Once the job runs, you still need to know why it's slow or unstable. Good training dashboards separate data, compute, communication, and memory instead of showing only one loss curve.[29]
| Signal | What it answers | Bad symptom |
|---|---|---|
| tokens/sec | Is end-to-end throughput improving? | flat or falling throughput after adding GPUs |
| step time split | Is time spent in data load, forward, backward, optimizer, or checkpoint save? | one phase dominates without explanation |
| all-gather / reduce-scatter share | Is sharding traffic now bottlenecking the job? | communication time grows faster than compute time |
| dataloader wait time | Are GPUs starved by CPU preprocessing or storage? | GPU idle gaps before forward |
| peak HBM and reserved memory | Are you close to OOM or fragmenting memory? | retries, allocator spikes, sudden OOM at checkpoint save |
| MFU or FLOP utilization | Are expensive kernels doing useful math? | very low utilization despite full memory use |
| checkpoint save duration | Is fault tolerance becoming a throughput tax? | long pauses every save interval |
If you only watch training loss, a run can look healthy while throughput quietly collapses. Distributed training needs systems telemetry, not ML telemetry alone.
Training-system bottleneck map
Strong distributed-training debugging connects the abstraction to the bottleneck. A useful answer names the split, the communication primitive, and the symptom you would measure.
| Topic | What to explain | Debug signal |
|---|---|---|
| Data parallelism | each rank owns a batch shard and synchronizes gradients | all-reduce time rises with parameter size |
| Tensor parallelism | one layer is split across ranks | frequent collectives inside attention and MLP blocks |
| Pipeline parallelism | different ranks own different layer ranges | idle bubbles when micro-batching is too small |
| ZeRO / FSDP | optimizer states, gradients, and parameters are sharded | all-gather and reduce-scatter dominate step time |
| Activation checkpointing | save memory by recomputing activations in backward | lower peak memory, higher compute time |
| NCCL bottlenecks | collectives depend on rank order, topology, and matching calls | hangs, timeouts, or wide gaps in profiler traces |
| FlashAttention | reduce attention memory traffic with tiled kernels | better long-context throughput when attention is memory-bound |
A practical debugging loop is:
- Reproduce on the smallest rank count that still fails.
- Confirm every rank enters the same collective sequence.
- Capture profiler traces and separate compute, communication, and idle time.
- Check peak memory before and after forward, backward, and optimizer step.
- Change one axis at a time: sharding granularity, micro-batch size, checkpointing, or placement.
For the 70B example, a backward OOM after persistent states fit points you toward gathered units and activations. A low-memory run with long gaps before each block points toward exposed communication. Those symptoms call for different experiments.
A worked sizing exercise
The earlier table explains why sharding helps. Now use the same recipe to answer a hardware question, then separate a mathematical lower bound from a runnable plan.
A common sizing prompt is: "How many 80 GB GPUs do you need to train a 70B model with ZeRO-3?" Walk through it step by step.
Step 1: count the model states
Reuse the specific mixed-precision Adam recipe from the opening:
- 2 bytes (BF16 weight)
- 2 bytes (BF16 gradient)
- 12 bytes (FP32 master weight + Adam moments)
Total: 16 bytes per parameter.
For 70B parameters: of model states.
Step 2: compute the model-state lower bound
If you looked only at model states, the absolute lower bound on 80 GB GPUs would be:
So 14 GPUs is the math-floor for model states alone.
The same calculation is worth making executable:
import math

total_state_gb = 70 * 16
gpu_memory_gb = 80

raw_floor = math.ceil(total_state_gb / gpu_memory_gb)
print("raw_lower_bound_gpus=", raw_floor)

for gpus in [14, 16, 24]:
    per_gpu = total_state_gb / gpus
    headroom = gpu_memory_gb - per_gpu
print(f"{gpus:>2} GPUs -> {per_gpu:5.1f} GB states/GPU, {headroom:5.1f} GB before activations")raw_lower_bound_gpus= 14
14 GPUs -> 80.0 GB states/GPU, 0.0 GB before activations
16 GPUs -> 70.0 GB states/GPU, 10.0 GB before activations
24 GPUs -> 46.7 GB states/GPU, 33.3 GB before activationsStep 3: add overhead
The raw model-state math says a 70B-style run needs about 14 GPUs with ZeRO-3, but you only have sixteen 80 GB cards. Why is that still a shaky plan?
Answer
Because 14 GPUs is only the lower bound for model states. On 16 GPUs, model states still land around 70 GB per card, leaving little room for activations, communication buffers, and allocator overhead. ZeRO-3 shrinks memory by sharding optimizer states, gradients, and parameters, but it doesn't remove the need for headroom.
The math above is for model states only. Real training also needs:
- Activations (depends on sequence length and batch size)
- Communication buffers for all-gather and reduce-scatter
- CUDA allocator overhead and fragmentation
There isn't one fixed headroom percentage: context length, accumulation, and prefetching can change the peak. For a sensitivity calculation, assume 18 GB of additional live memory at every candidate topology. This number is invented for the exercise, not measured. A real run must determine the joint peak; adding unrelated phase maxima can overestimate it, while ignoring gathered parameters can underestimate it.
state_total_gb = 1120
gpu_capacity_gb = 80
assumed_extra_peak_gb = 18  # Exercise assumption, not a measured workload result.

def fits(world_size):
    state_per_gpu = state_total_gb / world_size
    peak = state_per_gpu + assumed_extra_peak_gb
    return state_per_gpu, peak, peak <= gpu_capacity_gb

for world_size in [16, 24, 32]:
    state, peak, ok = fits(world_size)
print(f"{world_size} GPUs -> states={state:.1f} GB peak_estimate={peak:.1f} GB fits={ok}")16 GPUs -> states=70.0 GB peak_estimate=88.0 GB fits=False
24 GPUs -> states=46.7 GB peak_estimate=64.7 GB fits=True
32 GPUs -> states=35.0 GB peak_estimate=53.0 GB fits=TrueStep 4: answer the question
Fourteen GPUs is only the ideal model-state lower bound under the 16-byte recipe. Sixteen fail the exercise's assumed peak, while 24 pass its arithmetic. Neither result proves a real job fits or trains efficiently. Measure the intended workload, including gathered units, and check throughput and convergence before selecting the cluster. Activation checkpointing, a smaller micro-batch, or another parallel axis may change that choice.
Common pitfalls
Each failure below has a recovery path: identify what was split, observe the first failing boundary, then change one memory or topology axis and rerun the smallest faithful case.
Misidentifying which axis is split
- Symptom: A team says they "added ZeRO-3 for tensor parallelism," but profiler traces still show whole-layer matmuls on each rank and the real change is only lower model-state memory.
- Cause: ZeRO and FSDP shard model states across data-parallel ranks. They don't split the matrix multiply itself. Tensor parallelism splits layer computation, and pipeline parallelism splits model depth.
- Fix: Check what moved in the trace or memory profile before naming the technique. If weights, gradients, and optimizer states shrank per rank, that's sharding. If one layer's matmul is split across devices, that's tensor parallelism.
Wrapping the whole model as one FSDP unit
- Symptom: You enable FSDP full sharding, but peak memory is still unexpectedly high and you get OOM during the forward pass.
- Cause: You wrapped the entire model as a single FSDP unit instead of wrapping individual transformer layers. When the whole model is one unit, FSDP all-gathers every parameter at once. That defeats the purpose of layer-by-layer sharding.
- Fix: Apply
fully_shardto each transformer block, then the root. In FSDP1 code, useauto_wrap_policythe same way. The code examples earlier show both.
Thinking FSDP1 limit_all_gathers=True creates overlap
- Symptom: You set
limit_all_gathers=Trueand expect faster training, but throughput doesn't improve. - Cause:
limit_all_gathersis a CPU-side rate limiter. It caps how many all-gathers are in flight at once to control peak memory. That can affect throughput, but it doesn't directly select which unit to prefetch. - Fix: In FSDP1, use
backward_prefetchand communication-unit granularity for overlap. In FSDP2, use its prefetch methods when needed; it doesn't expose FSDP1'slimit_all_gathersargument.
Treating SHARD_GRAD_OP as identical to ZeRO-2
- Symptom: You switch from ZeRO-2-style reasoning to FSDP
SHARD_GRAD_OP, then wonder why peak memory is higher than expected even though gradients are sharded. - Cause: The names are similar, but the parameter lifetime differs. PyTorch's
SHARD_GRAD_OP, and FSDP2'sreshard_after_forward=False, keep parameters unsharded through forward and backward, then reshard after backward.[13][11] That changes peak memory even when the high-level mental model sounds like ZeRO-2. - Fix: Confirm the actual parameter lifetime in docs and profiler traces before sizing memory. If you need the lowest parameter footprint, compare against
FULL_SHARDorreshard_after_forward=Truerather than assuming the ZeRO-2-like name matches DeepSpeed stage 2.
Ignoring activation memory
- Symptom: The model-state math says everything should fit, but you still OOM.
- Cause: Activations can be larger than model states for long sequences. A single forward pass with a long context can generate gigabytes of intermediate tensors.
- Fix: Pair ZeRO-3 or FSDP with activation checkpointing. Trade compute for memory by recomputing activations during the backward pass instead of storing them.
Assuming every DeepSpeed feature composes with every ZeRO stage
- Symptom: You configure
PipelineModulewith ZeRO-3 and the job fails during initialization. - Cause: DeepSpeed has documented compatibility limits. AutoTP supports ZeRO stages 0 through 3, but
PipelineModuleisn't compatible with ZeRO-2 or ZeRO-3. - Fix: Check the stage-compatibility matrix before you design your training topology. Don't assume that because DeepSpeed supports both features, they work together.