Personalize this lesson
Adapt explanations and teaching visuals to your background and preferred voice.
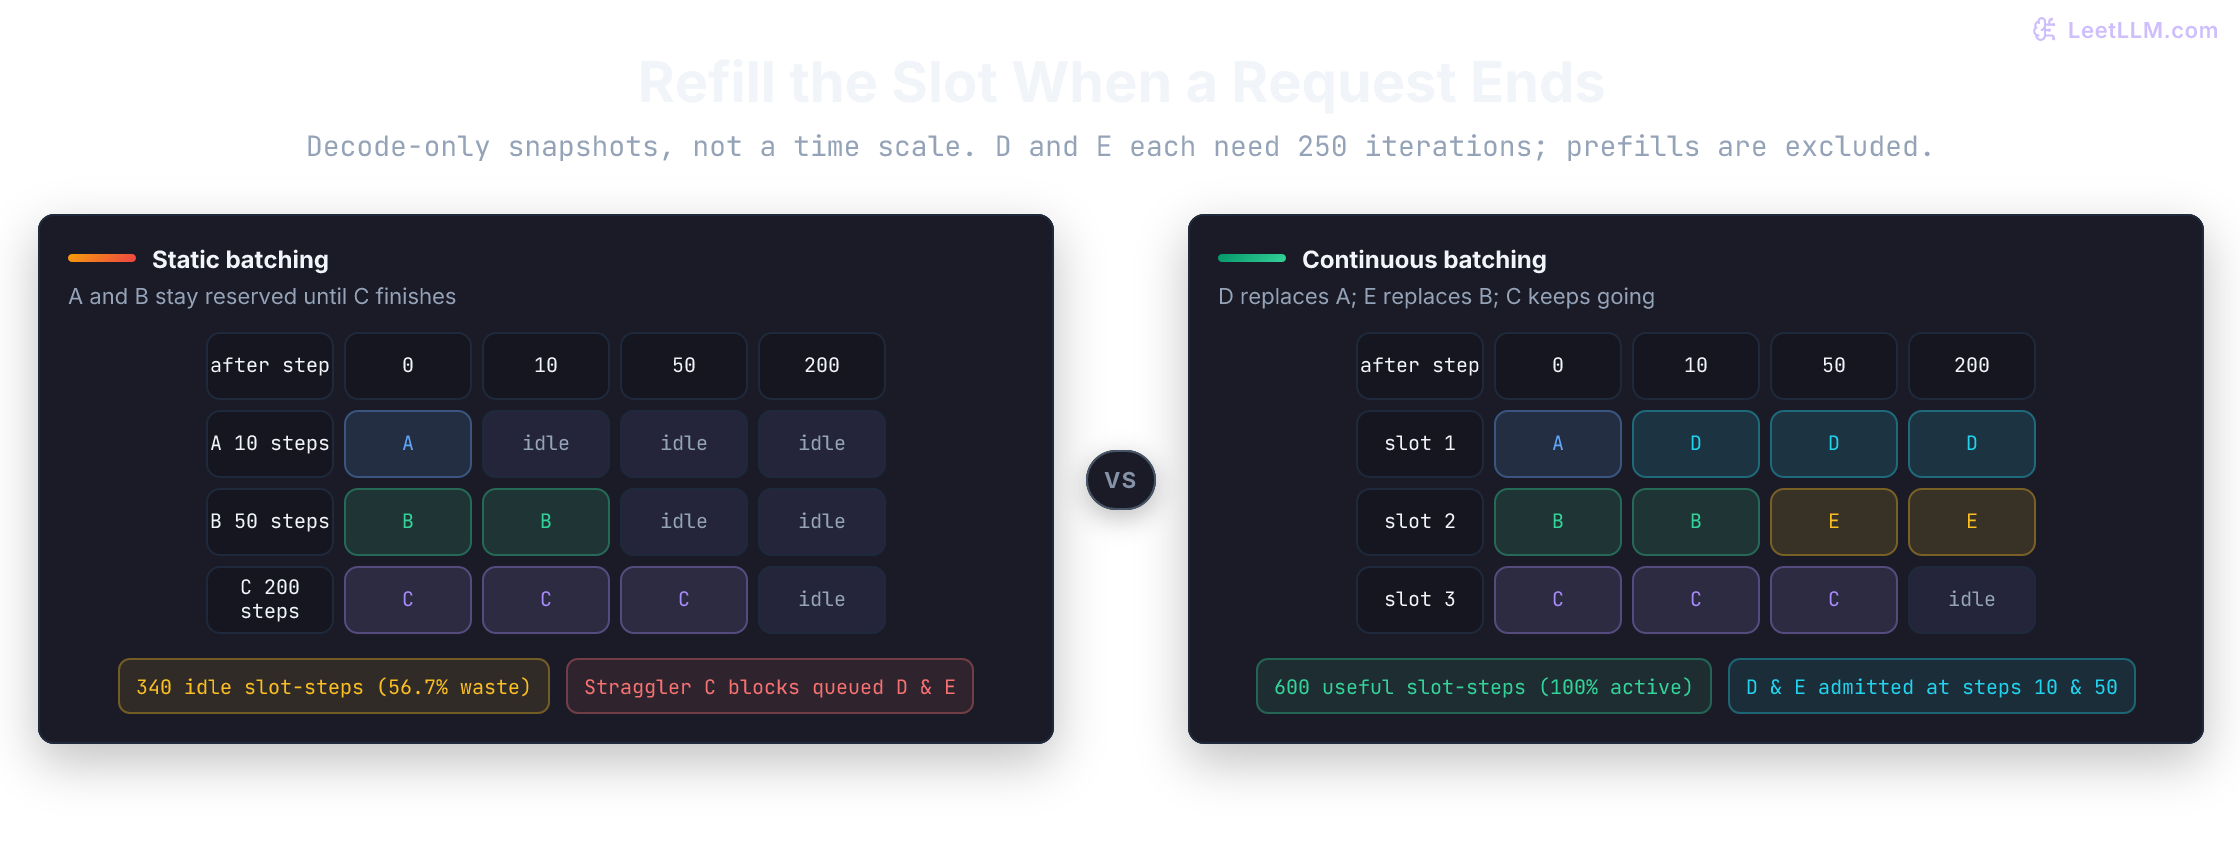
Continuous batching lets an LLM server replace finished requests before the rest of a batch completes. Take a shared code-assistant GPU receiving three requests: a one-line completion (A), an explanation of a failing test (B), and a migration plan (C). In our synthetic trace they require exactly 10, 50, and 200 remaining generation iterations. More work is already queued.
If the server starts those requests together, A disappears after 10 generation steps and B after 50. Their seats still belong to the batch while C runs for another 150 steps. The user-visible choice is simple but consequential: protect streams already producing tokens, or admit work that hasn't produced its first token?
FlashAttention makes one attention kernel cheaper. It doesn't decide who shares the next forward pass.
Static batching treats the trio as one job: fill a batch, run it, and wait for the longest completion before anyone new can start. Continuous batching (iteration-level scheduling) rebuilds the active set after every token step. When A stops, queued request D can take that slot on the next iteration. The model doesn't change. The GPU just keeps more useful work in flight.[1][2]
Admission still depends on available compatible KV-cache storage. Paged KV management is one way to allocate that storage flexibly; iteration-level scheduling doesn't require paging specifically.
First isolate the refill decision: assume all prompts are already processed, each active request advances by one token per iteration, and replacement requests have ready KV state. These are remaining decode iterations, excluding any first token supplied by prefill. Iterations count work, not milliseconds. Later we put prefill and memory pressure back into the schedule. No CPU example here measures GPU throughput.
Why LLM batches don't stay the same shape
Image classifiers usually have a fixed input shape and finish in one forward pass. Autoregressive LLMs don't.
Prefill reads the prompt. The prefill phase can process those tokens in parallel and normally supplies logits for the first output token. Ordinary decode then emits one new token per subsequent step. A one-liner might have ten decode steps left. A migration plan might have two hundred.
The engine also doesn't know the output length up front. Generation stops on an end-of-sequence token or a length limit, so the scheduler can't freeze a batch shape that will still make sense 200 steps later.
Those two facts are why a request-level batch wastes capacity on mixed traffic. Once A is done, its seat is empty, but static batching still owns the whole group until C finishes.
| Request | Task | Remaining decode iterations | Static fate |
|---|---|---|---|
| A | One-line completion | 10 | Done at step 10, waits 190 more |
| B | Failing-test explanation | 50 | Done at step 50, waits 150 more |
| C | Migration plan | 200 | Finishes at step 200 |
With three decode seats, this static schedule spends seat-steps to do useful tokens. The other 340 seat-steps are idle. Even an implementation that frees A's and B's memory early can't admit D and E if it only schedules whole request-level batches.
Count each active output token as one useful slot-iteration:
remaining_iterations = [10, 50, 200]
batch_slots = len(remaining_iterations)
static_capacity = max(remaining_iterations) * batch_slots
useful_work = sum(remaining_iterations)
idle_work = static_capacity - useful_work

print(f"useful slot-iterations: {useful_work}")
print(f"static idle slot-iterations: {idle_work}")
print(f"static slot occupancy: {useful_work / static_capacity:.1%}")useful slot-iterations: 260
static idle slot-iterations: 340
static slot occupancy: 43.3%Slot utilization isn't GPU utilization. 43.3% is batch-seat occupancy: how often a request-shaped seat is busy. Filling every seat still leaves tensor cores idle when decode is limited by memory bandwidth, and HBM can be nearly full while model FLOPs utilization (MFU) stays low.
| Regime | Seat occupancy | Typical decode MFU |
|---|---|---|
| Static batch, mixed lengths | Low after short finishes | Still often bandwidth-bound |
| Continuous batch, full seats | High | Still often low MFU on pure decode |
| Larger token budget / chunked prefill co-batch | High, more prefill tokens per step | Higher arithmetic intensity on that mixed step |
Continuous batching is a capacity win because it keeps more useful work in flight. It doesn't promise that SM occupancy or MFU jump to 100%. The open question is how the server actually refills those seats without waiting for C.
Continuous batching: schedule every iteration
Orca named this iteration-level scheduling: after each generation step (or after each prefill chunk in engines that chunk prefills), the server checks who finished, frees their slots, and admits waiting work if memory and token-budget constraints allow.[1]
Start with [A, B, C]. After iteration 10, A finishes and D joins for iteration 11. After iteration 50, B finishes and E joins for iteration 51. Give D and E 250 remaining iterations each, so both are still active when C finishes. Those lengths let us trace the refills; the real scheduler doesn't know them in advance.
| Completed iterations | Next active set | What changed |
|---|---|---|
| 0 | A, B, C | Initial batch |
| 10 | D, B, C | A done, D joins |
| 50 | D, E, C | B done, E joins |
| 200 | D, E, (C done) | C leaves; next queued work can take the seat |
That loop has one invariant: at every boundary, rebuild the active set before the next forward pass. First retire finished sequences and free their KV. Then admit waiting work that fits the batch and token budgets.
If the projected next token would exceed the KV budget, preempt a victim before running the pass. Otherwise, run one forward pass. The order makes the trade-off visible: reuse freed capacity, protect the next token from an OOM, then do useful work.
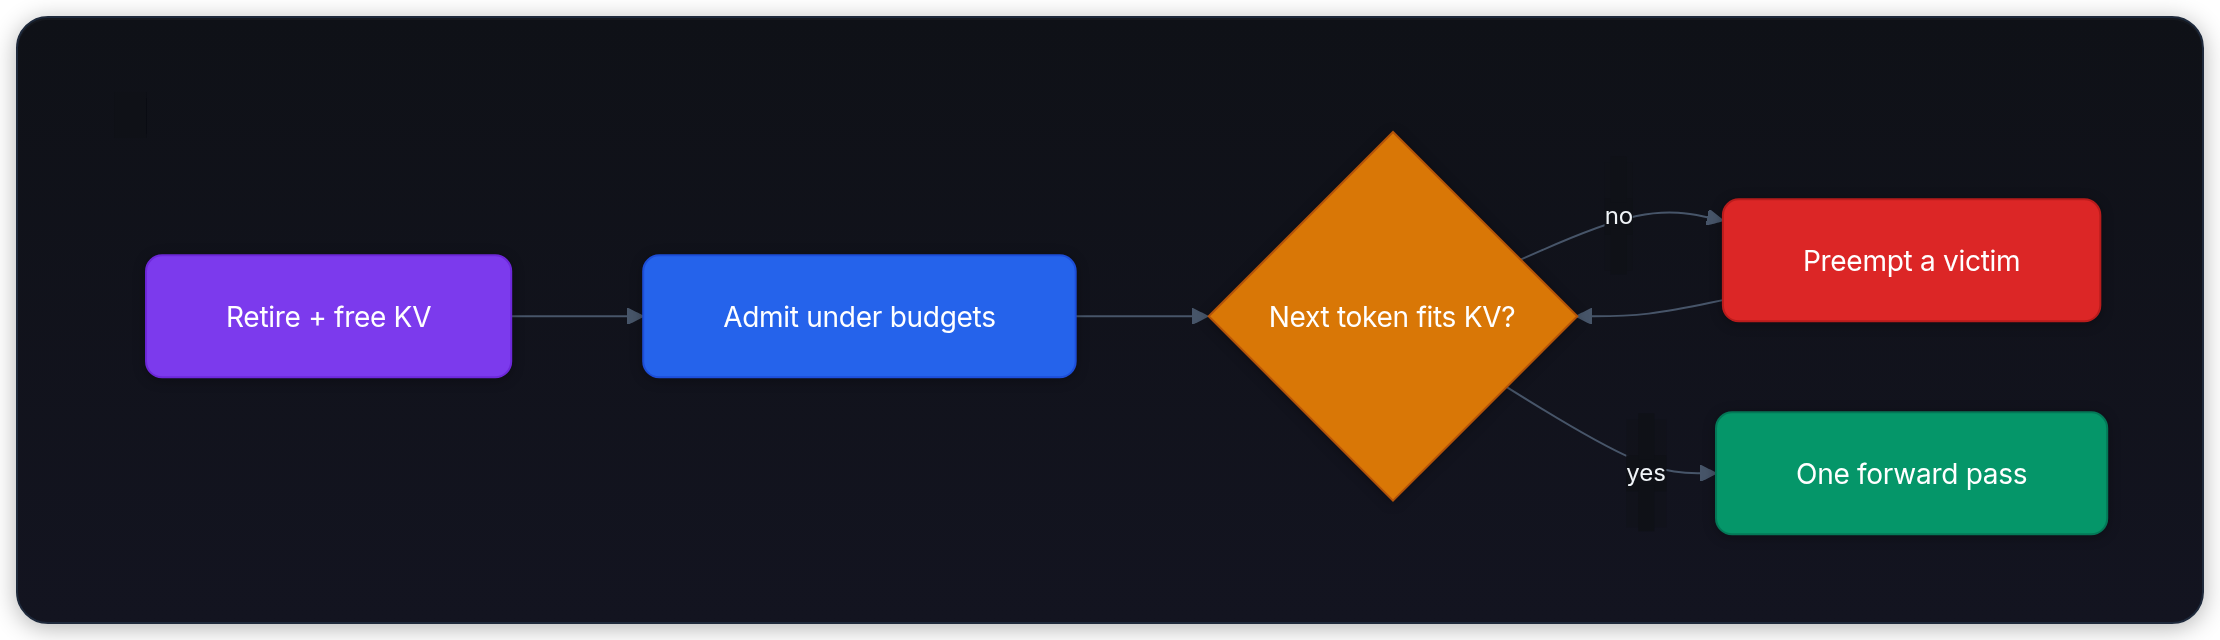
Real engines add prefix-cache hits, cancellations, and speculative drafts on top of this loop. The invariant stays the same: the active set is allowed to change at every iteration boundary.
Seat count is the wrong capacity knob, though. One long prefill can consume more scheduler work than many short decode-only streams. Modern schedulers cap a per-step token budget (vLLM's max_num_batched_tokens) and a KV-cache block budget, not only max_num_seqs.
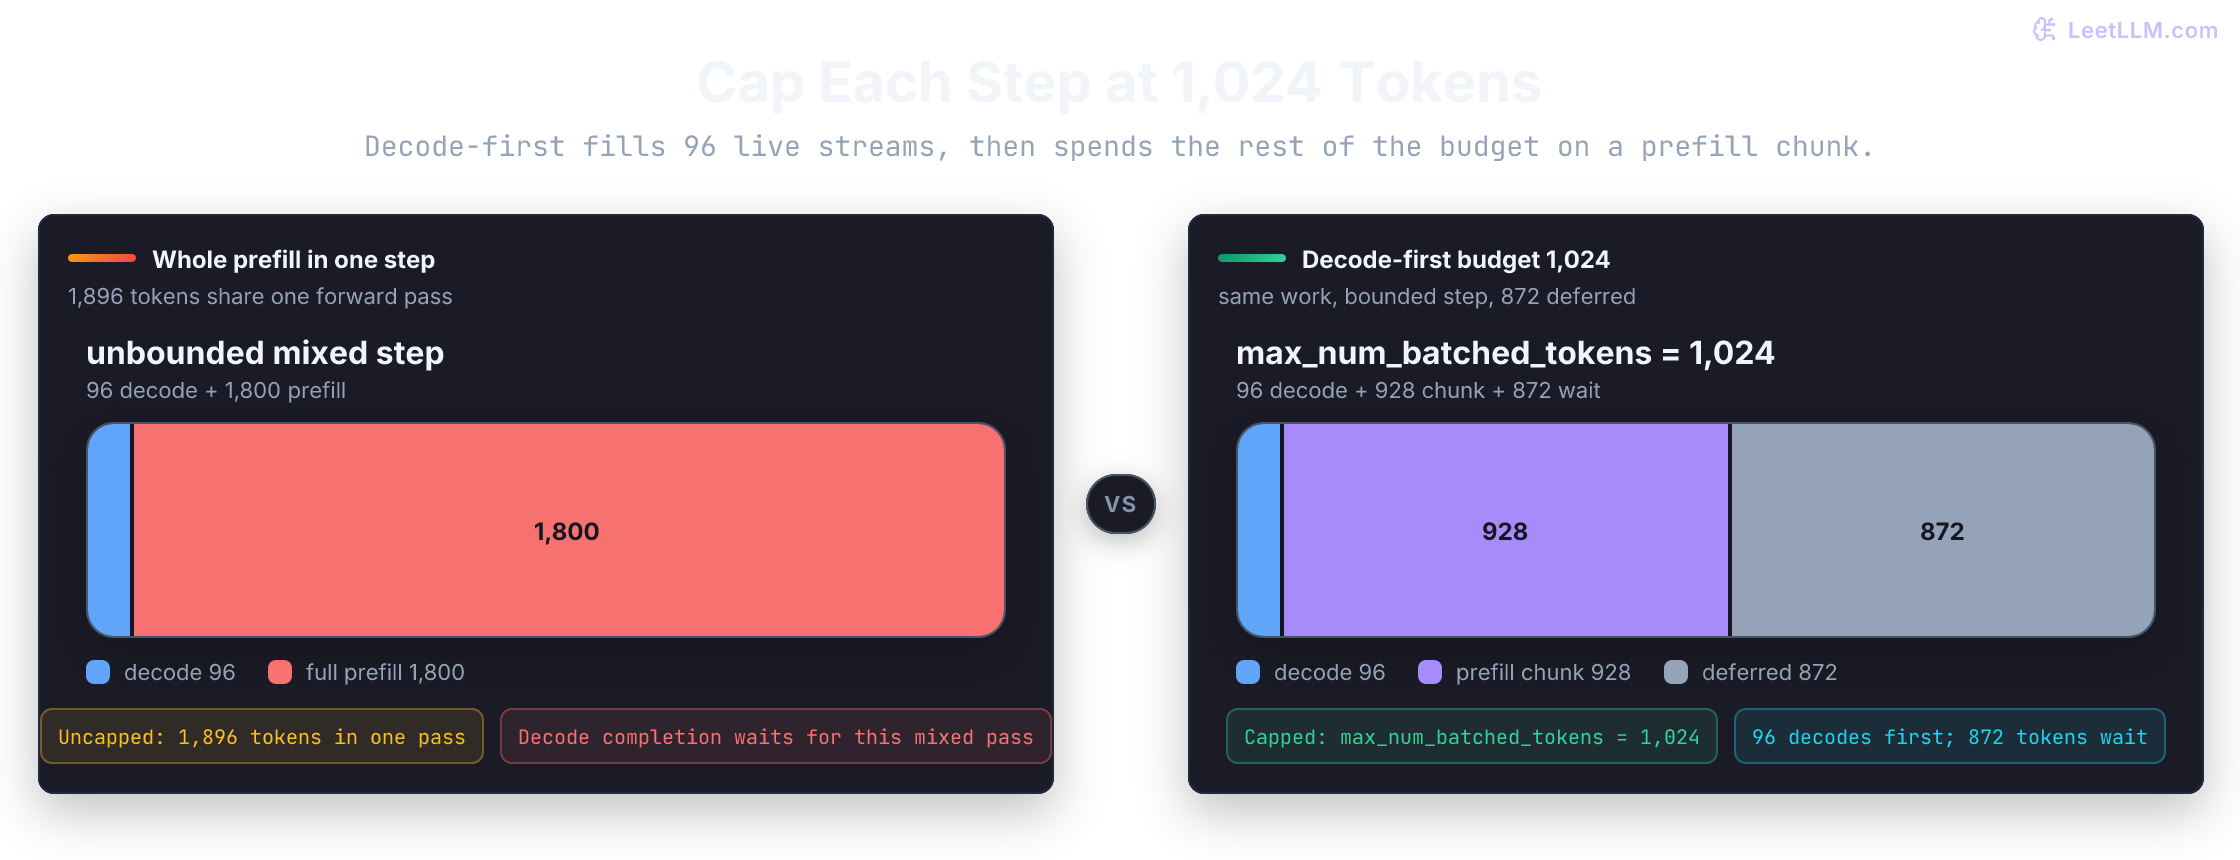
An available compatible prefix-cache hit reduces uncached prefill work; it doesn't guarantee faster decode. A decode-first policy then spends leftover budget on a bounded prefill chunk.
Suppose 96 live completions already need a decode token each, and a 1,800-token test-log prefill is waiting. With max_num_batched_tokens = 1024, decode takes 96 slots first. The remaining 928 tokens can run as a prefill chunk. The other 872 prompt tokens wait for later steps.
max_num_batched_tokens = 1024
decode_requests = 96
pending_prefill_tokens = 1800
prefill_budget = max_num_batched_tokens - decode_requests
assert 0 <= decode_requests <= max_num_batched_tokens
scheduled_prefill = min(pending_prefill_tokens, prefill_budget)

print(f"decode tokens scheduled first: {decode_requests}")
print(f"prefill tokens scheduled now: {scheduled_prefill}")
print(f"prefill tokens left for later: {pending_prefill_tokens - scheduled_prefill}")decode tokens scheduled first: 96
prefill tokens scheduled now: 928
prefill tokens left for later: 872This arithmetic assumes one input position per ordinary decode and sufficient KV space. If decode alone exceeds the token budget, select a subset; a negative prefill allowance isn't a schedule. Token count bounds work admitted to an iteration, not its wall-clock duration. KV-block capacity separately bounds resident state.
Paged KV makes freed memory reusable
During decode, the model stores a KV cache: attention keys and values for every token so far. Under continuous batching, sequences join and leave at unpredictable times. A contiguous max_seq_len reservation per request then fails in two ways:
- Internal fragmentation. A maximum-length reservation can greatly exceed the request's actual prompt plus generated history.
- External fragmentation. When A leaves, it can punch a hole that D's prompt doesn't fit into, even if the GPU has enough free bytes overall.
The KV cache for a sequence grows with every decode step. For Qwen3.6-27B's published Gated Attention geometry (16 full-attention layers, 4 KV heads, head dimension 256, FP16 cache), each new token adds about 64 KiB of KV state.[3] A 4,096-token test log therefore needs roughly 0.25 GiB. If those same 16 layers stored separate K/V tensors for all 24 query heads instead of GQA, the cache would grow to roughly 1.5 GiB at 4K tokens. Modest over-allocation can strand enough VRAM to block D.
is the number of full-attention layers that store K/V, is sequence length, is KV heads, is head dimension, and is bytes per element (2 for FP16). The leading 2 counts key and value tensors. Qwen3.6-27B has 64 layers total, but 48 use Gated DeltaNet; only the 16 full-attention layers grow this cache. The 0.25 GiB counts attention K/V only, not the linear-attention layers' recurrent state, block rounding, model weights, or workspace. It isn't the whole model's serving-memory requirement.
layers, kv_heads, head_dim, bytes_per_value = 16, 4, 256, 2
tokens = 4096
bytes_per_token = 2 * layers * kv_heads * head_dim * bytes_per_value
cache_bytes = bytes_per_token * tokens

print(f"KV state per token: {bytes_per_token / 1024:.0f} KiB")
print(f"KV state at {tokens:,} tokens: {cache_bytes / 1024**3:.2f} GiB")KV state per token: 64 KiB
KV state at 4,096 tokens: 0.25 GiBWhich term makes KV-cache memory grow during decoding?
Answer
, the cached sequence length in ordinary full attention. Processing a new token adds its K/V. Recurrent or sliding-window layers have different state-growth rules.
PagedAttention[2] combines paged KV management with attention kernels that read those pages. It splits KV into fixed-size blocks and maps logical block indices to physical GPU pages through a per-request block table. Block size depends on the engine and backend; use 16 tokens in this example. When A leaves, exclusively owned pages can return to the free list. D can take nonadjacent free pages. Pages shared with another sequence or retained in a prefix cache need separate reference and eviction accounting.
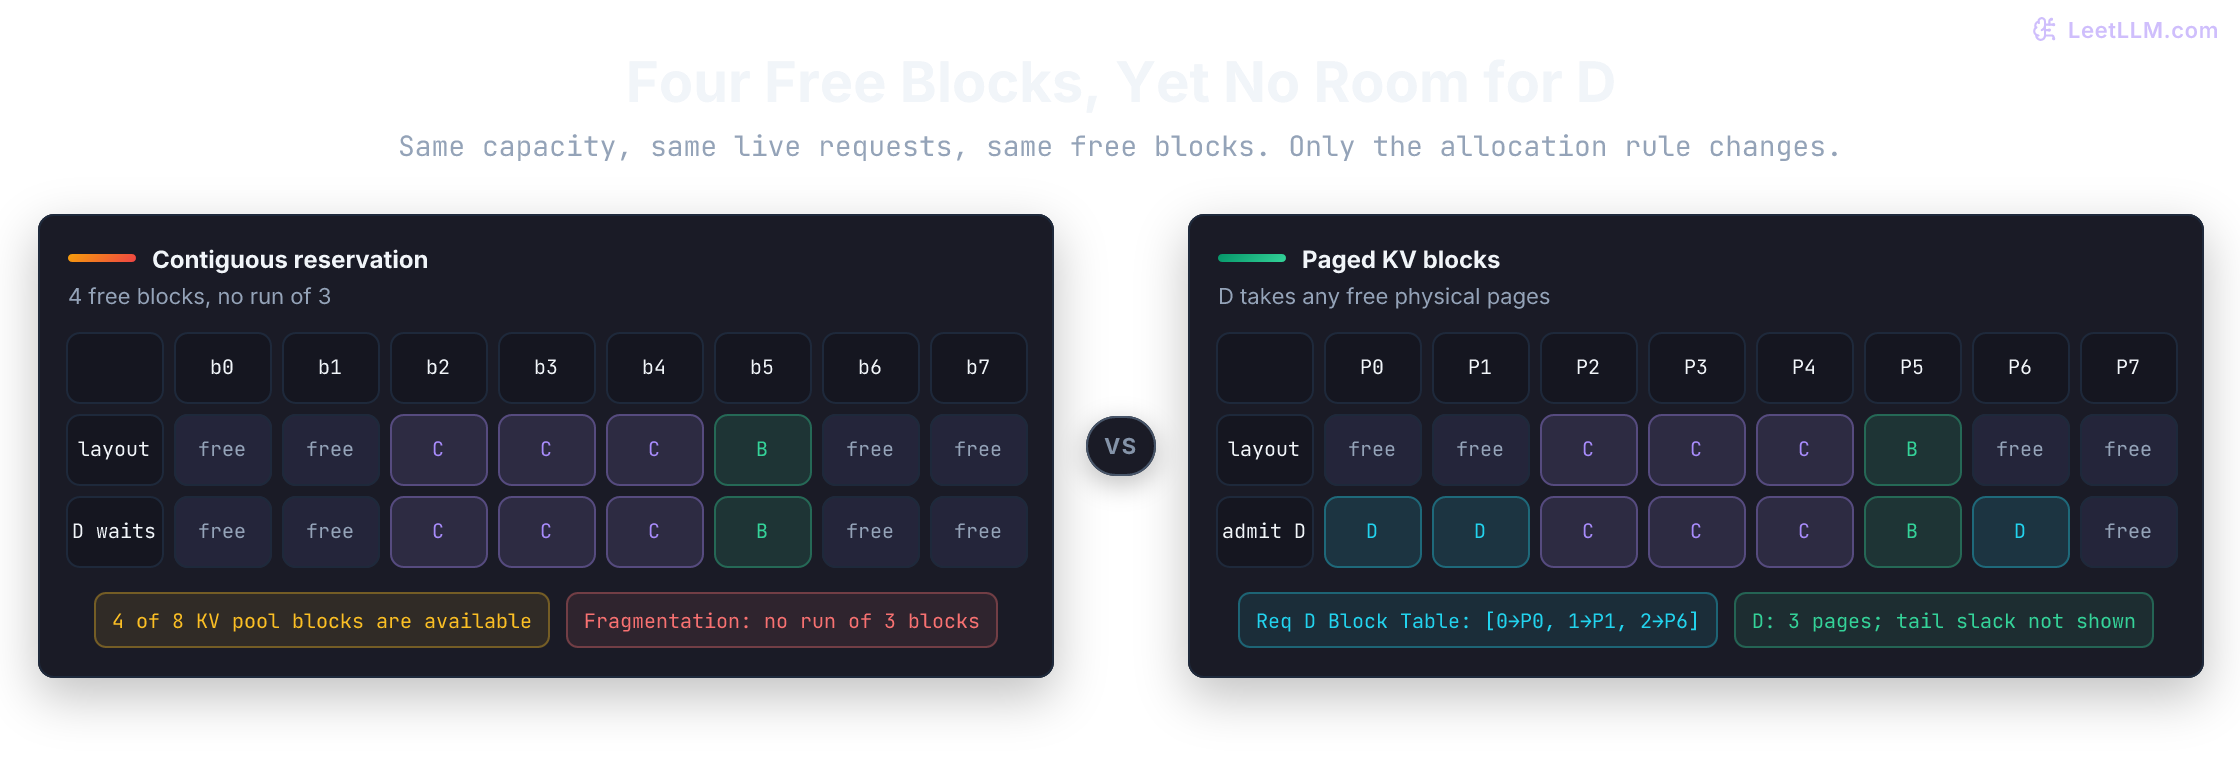
The vLLM paper reports near-zero KV-cache waste in its evaluated design versus large reservation waste in the baselines.[2] That claim is about dropping max_seq_len over-allocation, not about last-block rounding. Fixed blocks still leave slack in the final page of each sequence. On short sequences that slack looks large. On long ones it's at most block_size - 1 tokens per request.
block_size = 16
sequence_lengths = [17, 31, 48, 65]
reserved = sum(((length + block_size - 1) // block_size) * block_size for length in sequence_lengths)
used = sum(sequence_lengths)
slack = reserved - used

print(f"active tokens: {used}")
print(f"reserved block slots: {reserved}")
print(f"last-block slack: {slack} tokens ({slack / reserved:.1%})")active tokens: 161
reserved block slots: 192
last-block slack: 31 tokens (16.1%)Paged KV management decides where state lives; FlashAttention avoids full attention intermediates. Engines can combine them through compatible kernels. Allocation, kernel layout, and scheduling must agree; combining names alone doesn't establish a speedup.
Memory is now flexible enough to refill seats. The next fight is that prefill and decode want different things from the same GPU.
Prefill and decode fight over the same step
LLM serving has two phases with opposing bottlenecks:
Prefill (prompt processing)
- Processes input tokens in parallel.
- Often compute-heavy because many prompt tokens hit matrix multiplies.
- Runs once per request at the start (or in chunks).
- Latency goal: Time To First Token (TTFT).
Decode (token generation)
- Emits tokens one at a time.
- Often memory-bandwidth limited at practical batch sizes: each step reads model weights and KV to produce few new tokens.
- Runs once per subsequent output token in ordinary autoregressive decoding.
- Latency goal: inter-token latency (ITL), also called time between tokens (TBT). TPOT is related but not identical. DistServe defines TPOT as the average time per output token after the first.[4]
| Phase | Arithmetic intensity | Bottleneck | What you want to batch |
|---|---|---|---|
| Prefill | Often high | Frequently compute | Prompt tokens |
| Decode | Often lower | Frequently memory bandwidth | Active streams |
Mixing a full 4k test-log prefill with those 96 live streams can stall ITL. Every in-flight completion waits for the whole prompt before its next token. Chunked prefill, disaggregated pools, and decode-first priority are three ways to bound that interference.
Measure TTFT from the client's request start to the first received token, including queueing and transport. For received tokens, TPOT is : the mean of the inter-token gaps. Report single-token completions separately because that denominator is zero. A good mean TPOT can hide one very long gap.
Who gets the next seat
The scheduler rebuilds the active set every iteration. Policy decides which waiting work wins.
First-come-first-served (FCFS)
Admit in arrival order. Easy to reason about, usually fair, and a long migration plan at the head of the queue can block many one-liners.
Shortest-job-first (SJF)
Prioritize estimated service cost. Remaining output length matters, but so do prefill length, context-dependent attention, and batch composition. Prompt buckets can approximate one part of that cost. Tenant priority and token caps are policy/resource controls, not inherently SJF estimates.
Unknown lengths turn scheduling into a fairness problem too. A stream of short requests can keep winning an estimate-based SJF queue while a long request waits forever. Use estimates as hints, age waiting requests, or allocate per-tenant shares; cap consecutive wins when a class is falling behind.
Track p99 and maximum queue wait by request class. If short-job latency improves while long-job wait grows, the scheduler is trading fairness for mean completion time, not finding free capacity.
For a single serial worker, with every job ready at time zero and no preemption, known job lengths let SJF minimize average completion time. The following is that idealized queue, not a prediction for a GPU that co-batches jobs with unequal iteration costs:
jobs = [("long", 50), ("quick", 5), ("medium", 20)]

def average_completion(order):
    elapsed = 0
    completion_times = []
    for _, tokens in order:
        elapsed += tokens
        completion_times.append(elapsed)
    return sum(completion_times) / len(completion_times)

fcfs = average_completion(jobs)
oracle_sjf = average_completion(sorted(jobs, key=lambda job: job[1]))
print(f"FCFS average completion: {fcfs:.1f} steps")
print(f"oracle SJF average completion: {oracle_sjf:.1f} steps")
print("production caveat: output length is not known up front")FCFS average completion: 60.0 steps
oracle SJF average completion: 35.0 steps
production caveat: output length is not known up frontDecode-first and priority
Users notice ITL jitter immediately. That makes decode-first scheduling reasonable: protect streams already producing tokens, then spend leftover budget on new prefills. Per-tenant priorities and SLO-aware admission make that preference explicit.[4]
Decode-first still needs a backstop when live streams exhaust the work or memory budget. Age waiting work or reserve an admission opportunity. Fairness can't make an infeasible deadline achievable; under overload, rejection or expiration may be necessary.
As checked October 10, 2026, vLLM V1 exposes --scheduling-policy choices for FCFS and priority scheduling.[5] Its priority queue processes smaller priority values first, breaking ties by arrival time.[6] The teaching fixture below deliberately defines larger integers as more urgent; translate the convention before applying a real engine's flag.
Preemption when KV is full
When GPU KV blocks run out, the scheduler has to pause work, drop state, or stop admitting. Two recovery designs:
- Recompute. Drop the victim's KV and replay its token history when it's rescheduled, including already-generated tokens. Preserve the output and generation count; rebuild state without sampling or streaming those tokens again.
- Pros: no CPU copy; simple.
- Cons: spends GPU compute; replay cost grows with the cached history, not just the original prompt.
- Swap-out. Move the victim's KV from GPU VRAM to CPU RAM.
- Pros: keeps progress; can beat replay when the prompt is long.
- Cons: burns host-device bandwidth and adds resume latency.
These are design options, not universal defaults. Current vLLM V1 defaults to RECOMPUTE; its guide says legacy KV swapping is no longer required for preemption.[7][5] V1 also offers optional KV offloading through connectors, a separate mechanism.[8] Read the selected engine's current policy and trace its actual state transfers.
The CPU scheduler below models swap-out bookkeeping. It stores block counts, not tensors, and performs no prefill, model forward pass, or host-device copy. schedule_step reserves capacity before a pass; finish_decode_step records one generated token per active request. It conservatively reserves a position for that new token, even though a real decoder normally creates its KV when the token is consumed by the following pass.
To make progress testable, admission rejects requests whose maximum token history couldn't fit even when running alone. This is a deliberately conservative policy, not a vLLM implementation. Prefills and swap transfers are assumed complete at admission. Calls are serialized at safe iteration boundaries.
from dataclasses import dataclass

@dataclass
class Request:
    id: str
    prompt_len: int
    max_new_tokens: int
    priority: int = 0  # Higher value = higher priority
    generated_tokens: int = 0
    allocated_blocks: int = 0
    swapped_to_cpu: bool = False
    canceled: bool = False
    eos: bool = False

    @property
    def total_tokens(self) -> int:
        return self.prompt_len + self.generated_tokens

    def is_finished(self) -> bool:
        """Check if request has reached EOS or max_new_tokens."""
        return self.canceled or self.eos or self.generated_tokens >= self.max_new_tokens

class ContinuousBatchScheduler:
    """
    Simplified iteration-level scheduler.

    Real engines also track per-request token budgets, prefix-cache hits,
    EOS detection, and beam-search groups. This example focuses on the core
    loop: retire finished requests, resume paused work, admit new work, then
    preempt if the next decode step would overflow KV-cache capacity.
    """
    BLOCK_SIZE = 16

    def __init__(self, max_batch_size: int, max_memory_blocks: int):
        if any(type(value) is not int or value <= 0
               for value in (max_batch_size, max_memory_blocks)):
            raise ValueError("capacities must be positive integers")
        self.max_batch_size = max_batch_size
        self.max_memory_blocks = max_memory_blocks
        self.running: list[Request] = []  # Currently generating on GPU
        self.waiting: list[Request] = []  # Queued requests
        self.swapped: list[Request] = []  # Preempted to CPU RAM
        self.used_memory_blocks = 0
        self.preemptions = 0
        self.in_flight = False
        self.seen_ids: set[str] = set()

    def submit(self, req: Request) -> None:
        if not isinstance(req.id, str) or not req.id or req.id in self.seen_ids:
            raise ValueError("request IDs must be unique nonempty strings")
        if (any(type(value) is not int
                for value in (req.prompt_len, req.max_new_tokens, req.priority))
                or req.prompt_len < 1 or req.max_new_tokens < 1):
            raise ValueError("use positive integer lengths and an integer priority")
        if req.generated_tokens or req.allocated_blocks or req.swapped_to_cpu or req.is_finished():
            raise ValueError("submit only fresh requests")
        maximum = self._blocks_for_tokens(req.prompt_len + req.max_new_tokens)
        if maximum > self.max_memory_blocks:
            raise ValueError("request cannot finish within the KV capacity")
        self.seen_ids.add(req.id)
        self.waiting.append(req)

    def cancel(self, request_id: str) -> None:
        # Mark now; release at a safe boundary, not during a GPU read.
        for req in self.running + self.waiting + self.swapped:
            if req.id == request_id:
                req.canceled = True

    def schedule_step(self) -> list[Request]:
        if self.in_flight:
            raise RuntimeError("finish the previous pass first")
        # 1. Retire finished requests and free their KV cache.
        active = []
        for req in self.running:
            if req.is_finished():
                self._free_kv_cache(req)
            else:
                active.append(req)
        self.running = active
        self.waiting = [r for r in self.waiting if not r.is_finished()]
        self.swapped = [r for r in self.swapped if not r.is_finished()]

        # 2. Prefer resumption. This alone doesn't guarantee fairness.
        self._admit(self.swapped, from_cpu=True)

        # 3. Admit fresh waiting requests.
        self._admit(self.waiting, from_cpu=False)

        # 4. Preempt only if the next decode step would exceed the safe budget.
        while self.running and not self._can_run_next_decode_step(self.running):
            victim = min(self.running, key=lambda r: (r.priority, r.generated_tokens))
            self.running.remove(victim)
            self._swap_out_to_cpu(victim)
            victim.swapped_to_cpu = True
            self.swapped.append(victim)
            self.preemptions += 1

        for req in self.running:
            growth = self._projected_growth_for_next_token(req)
            req.allocated_blocks += growth
            self.used_memory_blocks += growth
        assert self.used_memory_blocks <= self.max_memory_blocks
        self.in_flight = True
        return list(self.running)

    def finish_decode_step(self, eos_ids: frozenset[str] = frozenset()) -> None:
        # Call this after the model emits one token for each running request.
        if not self.in_flight:
            raise RuntimeError("schedule a pass first")
        if not eos_ids <= {req.id for req in self.running}:
            raise ValueError("EOS must belong to this pass")
        for req in self.running:
            req.generated_tokens += 1
            req.eos = req.id in eos_ids
        self.in_flight = False

    def _admit(self, queue: list[Request], from_cpu: bool) -> None:
        queue.sort(key=lambda r: r.priority, reverse=True)

        while (
            queue
            and len(self.running) < self.max_batch_size
            and self._can_allocate_current_state(queue[0])
        ):
            req = queue.pop(0)
            if from_cpu:
                self._swap_in_from_cpu(req)
            else:
                self._allocate_kv_cache(req)
            req.swapped_to_cpu = False
            self.running.append(req)

    def _blocks_for_tokens(self, token_count: int) -> int:
        return (token_count + self.BLOCK_SIZE - 1) // self.BLOCK_SIZE

    def _can_allocate_current_state(self, req: Request) -> bool:
        return self.used_memory_blocks + self._blocks_for_tokens(req.total_tokens) <= self.max_memory_blocks

    def _allocate_kv_cache(self, req: Request) -> None:
        req.allocated_blocks = self._blocks_for_tokens(req.total_tokens)
        self.used_memory_blocks += req.allocated_blocks

    def _free_kv_cache(self, req: Request) -> None:
        self.used_memory_blocks -= req.allocated_blocks
        req.allocated_blocks = 0

    def _swap_out_to_cpu(self, req: Request) -> None:
        self._free_kv_cache(req)

    def _swap_in_from_cpu(self, req: Request) -> None:
        self._allocate_kv_cache(req)

    def _projected_growth_for_next_token(self, req: Request) -> int:
        next_blocks = self._blocks_for_tokens(req.total_tokens + 1)
        return max(0, next_blocks - req.allocated_blocks)

    def _can_run_next_decode_step(self, batch: list[Request]) -> bool:
        growth = sum(self._projected_growth_for_next_token(req) for req in batch)
        return self.used_memory_blocks + growth <= self.max_memory_blocks

scheduler = ContinuousBatchScheduler(max_batch_size=3, max_memory_blocks=16)
for request in [
    Request("req_A", prompt_len=8, max_new_tokens=3),
    Request("req_B", prompt_len=8, max_new_tokens=1),
    Request("req_C", prompt_len=8, max_new_tokens=2),
    Request("req_D", prompt_len=8, max_new_tokens=2),
    Request("req_E", prompt_len=8, max_new_tokens=1),
]:
    scheduler.submit(request)

timeline: list[list[str]] = []
peak_blocks = 0
for _ in range(6):
    active = scheduler.schedule_step()
    timeline.append([req.id for req in active])
    peak_blocks = max(peak_blocks, scheduler.used_memory_blocks)
    scheduler.finish_decode_step()
    peak_blocks = max(peak_blocks, scheduler.used_memory_blocks)

print(timeline[:3])
print(f"peak blocks: {peak_blocks}/{scheduler.max_memory_blocks}")

assert timeline[0] == ["req_A", "req_B", "req_C"]
assert timeline[1] == ["req_A", "req_C", "req_D"]
assert "req_E" in timeline[2]
assert peak_blocks <= scheduler.max_memory_blocks

# A tight KV-block budget forces an actual preemption before decode.
pressure = ContinuousBatchScheduler(max_batch_size=2, max_memory_blocks=2)
for request in [
    Request("urgent", prompt_len=16, max_new_tokens=2, priority=1),
    Request("background", prompt_len=16, max_new_tokens=2, priority=0),
]:
    pressure.submit(request)
active_under_pressure = pressure.schedule_step()
print([req.id for req in active_under_pressure], f"preemptions={pressure.preemptions}")
assert [req.id for req in active_under_pressure] == ["urgent"]
assert pressure.preemptions == 1

# Finish urgent, then resume background without losing generated progress.
for _ in range(5):
    pressure.finish_decode_step()
    pressure.schedule_step()
pressure.finish_decode_step()
assert not pressure.running and not pressure.swapped
assert pressure.used_memory_blocks == 0

# EOS and cancellation release at the next boundary, including queued work.
retirement = ContinuousBatchScheduler(2, 4)
for name in ["eos", "cancel", "queued"]:
    retirement.submit(Request(name, 8, 8))
retirement.schedule_step()
retirement.cancel("cancel")
retirement.cancel("queued")
retirement.finish_decode_step(frozenset({"eos"}))
assert retirement.schedule_step() == []
retirement.finish_decode_step()
assert retirement.used_memory_blocks == 0

try:
    retirement.submit(Request("too-large", 64, 1))
except ValueError as error:
    print(error)
else:
    raise AssertionError("oversize request was silently queued")
print("resume, cancellation, EOS, and capacity checks passed")[['req_A', 'req_B', 'req_C'], ['req_A', 'req_C', 'req_D'], ['req_A', 'req_D', 'req_E']]
peak blocks: 3/16
['urgent'] preemptions=1
request cannot finish within the KV capacity
resume, cancellation, EOS, and capacity checks passedschedule_step() rebuilds the active set every iteration: retire, admit under the batch and KV budgets, then preempt if the next token wouldn't fit.
The assertions exercise refill, preemption, resumption, EOS, queued and active cancellation, and impossible admission. They test state transitions only. This trusted sequential fixture retains mutable Request objects; callers must not change admitted accounting fields. Resumption-first and checking only the queue head can delay fresh or smaller work. The example omits transfer failures, shared pages, device completion, arrivals, and latency-based fairness. A real engine must wait for in-flight readers before reusing blocks and suppress a canceled request's late output.
Make that queue-head trade-off concrete. Two of three KV blocks belong to a resident stream throughout this short trace. The oldest waiting request needs two blocks; a newer one needs one. Strict head order admits neither. Scanning for a fitting request can use the free block, but continuous one-block arrivals can keep winning while the two-block request waits. The original SGLang scheduling algorithm scans candidates against available state capacity; that mechanism alone doesn't establish a fairness guarantee.[9]
def admit(queue, free_blocks, bypass_head):
    selected = []
    for name, blocks in queue:
        if blocks > free_blocks:
            if not bypass_head:
                break
            continue
        selected.append(name)
        free_blocks -= blocks
    return selected

queue = [("older-large", 2), ("newer-small", 1)]
strict = admit(queue, free_blocks=1, bypass_head=False)
fitting = admit(queue, free_blocks=1, bypass_head=True)
assert strict == [] and fitting == ["newer-small"]
print("head order / fit scan:", strict, "/", fitting)

# Each small request finishes before the next boundary. The resident stream
# still holds two blocks; this trace deliberately offers no second free block.
small_completed = 0
for iteration in range(4):
    candidates = [("older-large", 2), (f"small-{iteration}", 1)]
    chosen = admit(candidates, free_blocks=1, bypass_head=True)
    assert "older-large" not in chosen
    small_completed += len(chosen)
print(f"small completions: {small_completed}; older request still waiting")head order / fit scan: [] / ['newer-small']
small completions: 4; older request still waitingTo admit the older request before the resident stream ends, the scheduler needs two blocks at once. Raising its priority can't manufacture the missing block. A policy may preempt the resident, or preserve enough freed capacity as it becomes available rather than immediately refilling it. Compare replay or transfer cost, per-class wait, and SLO attainment when choosing that policy. Bypassing a blocked head is a capacity choice with a fairness obligation, not a universal fix.
A capacity of 1.5 requests is not a valid budget. Python type annotations don't enforce integer inputs, and booleans count as integers unless explicitly excluded. Verify rejection before allowing either value into the accounting:
rejected = 0
for capacities in (
    (1.5, 4), (2, 2.5), (True, 4), (2, True),
    (float("nan"), 4), (2, float("inf"))
):
    try:
        ContinuousBatchScheduler(*capacities)
    except ValueError:
        rejected += 1
    else:
        raise AssertionError("noninteger capacity accepted")

for malformed in (
    Request("fractional-prompt", 1.5, 1),
    Request("fractional-output", 1, 1.5),
    Request("boolean-prompt", True, 1),
    Request("fractional-priority", 1, 1, priority=1.5),
    Request(17, 1, 1),
):
    fresh = ContinuousBatchScheduler(2, 4)
    try:
        fresh.submit(malformed)
    except ValueError:
        assert not fresh.waiting and not fresh.seen_ids
        rejected += 1
    else:
        raise AssertionError("malformed request accepted")
assert rejected == 11
print(f"invalid capacity/token/ID fixtures rejected: {rejected}")invalid capacity/token/ID fixtures rejected: 11Recomputation needs a different counter: tokens already computed into KV. Reset that counter, not the accepted output. This minimal history example makes the distinction executable:
prompt_ids = [101, 102, 103]
output_ids = [201, 202]  # Already sent to the client; never resample these.
history = prompt_ids + output_ids
computed_tokens = len(history) - 1  # Last sampled token has no KV yet.
before = output_ids.copy()

computed_tokens = 0  # Preemption discarded all cached state.
replay_ids = history[:-1]
computed_tokens += len(replay_ids)  # Model this replay; no sampling or emission.
next_decode_input = history[computed_tokens]

assert output_ids == before
assert replay_ids == [101, 102, 103, 201]
assert next_decode_input == 202
print(f"rebuild {computed_tokens} cached positions; next decode input: {next_decode_input}")
print(f"accepted output is unchanged: {output_ids}")rebuild 4 cached positions; next decode input: 202
accepted output is unchanged: [201, 202]Swap-out pays host-device bandwidth to keep KV. Recompute pays forward-pass work to rebuild it. Choose from measured history length, transfer bandwidth, and preemption frequency. Neither policy should restart the answer or duplicate tokens already delivered.
Continuous batching times speculative decoding
Speculative decoding isn't only a per-request speedup. It changes the token-budget math for the whole batch:
- More work per scheduled request. A target verification pass processes multiple input positions, and an accepted draft may yield up to
k + 1output tokens including a bonus token. Budget the engine's scheduled verification positions and reserve its required KV lookahead. Accepted output count isn't the same quantity as scheduled input-token work. - ITL jitter from acceptance variance. High acceptance packs more useful tokens per step. Rejects free partial work unevenly and can stall one stream while neighbors look fine, even when mean TPOT looks healthy.
- Mixed work. In an engine that mixes verification widths or speculative and plain streams, those positions share the work budget. Large verification batches can delay other work. Check what the runtime actually supports rather than assuming every request can independently enable speculation.
The accept/reject rule lives in speculative decoding. Keep the iteration loop and token budget from this lesson when you read it.
Why does continuous batching usually schedule by token or KV-cache budget instead of only request count?
Answer
Requests have different prompt lengths and generated lengths. One long prompt can consume far more prefill work and KV-cache memory than many short chats, so request count alone misstates GPU capacity.
Serving engines
The same ideas show up across stacks. Some rows are production engines. DistServe is a research system that shaped later pool-splitting designs:
| System | Mechanism | Connection to this lesson |
|---|---|---|
| vLLM[7] | Continuous batching, paged KV, chunked prefill | Current V1 token-budget and preemption controls |
| SGLang[9] | Continuous batching and prefix reuse (RadixAttention) | Available cached work changes admission and prefill demand |
| TensorRT-LLM[10] | NVIDIA runtime with in-flight batching and paged KV | Scheduler and kernel features must match the installed build |
| Sarathi-Serve[11] | Chunked-prefills and stall-free scheduling | Research design admitting new work without pausing ongoing decodes |
| DistServe[4] | Phase separation and bandwidth-aware placement | Optimizes SLO-qualified per-GPU capacity |
| Mooncake[12] | Disaggregated KV store using DRAM/SSD and RDMA | Cache placement, state transfers, and early rejection are scheduling inputs |
Feature matrices move quickly. Check current docs before you pick an engine.
Throughput vs goodput
A server can win raw tokens/sec and still feel slow for long prompts or live streams. Judge it by whether your mix of one-liners, test logs, and long plans stays inside TTFT, TPOT, and ITL targets.
| Source | What it measured | Why it matters |
|---|---|---|
| Orca[1] | Iteration-level scheduling against request-level baselines | Per-iteration scheduling can raise throughput and cut latency together |
| vLLM[2] | PagedAttention plus continuous batching against prior serving systems | Shows why memory allocation and iteration-level scheduling must be evaluated together |
| DistServe[4] | Phase-disaggregated serving under TTFT/TPOT SLOs | Treats prefill/decode placement as an SLO and goodput decision, not a raw-TPS contest |
Raw tokens/sec can look great while a large fraction of requests miss their latency target. DistServe optimizes goodput per provisioned GPU.[4] For a fixed deployment, find the maximum offered rate that keeps the required fraction within chosen TTFT/TPOT objectives, then normalize by GPU count:
Here is the whole deployment's offered requests per second for a fixed GPU count. Divide by that count when comparing per-GPU goodput. The original DistServe form uses TTFT and TPOT. When smooth streaming is part of your product contract, extend the acceptance predicate with ITL:
Define ITL aggregation before measuring: per-stream p99 ITL or a required fraction of tokens under are different tests. , , and are the chosen limits; is the attainment fraction, for example 90%. Raise offered load and keep the highest rate whose attainment stays at or above . Optimize tokens/sec only after those targets exist.
One 10-second window doesn't establish that maximum. It can still report observed SLO-compliant throughput, which is what you use when raw TPS is hiding latency failures:
window_seconds = 10
latencies_ms = [
    {"ttft": 120, "tpot": 25},
    {"ttft": 450, "tpot": 22},
    {"ttft": 180, "tpot": 42},
    {"ttft": 190, "tpot": 27},
]
ttft_target, tpot_target = 300, 30
within_slo = [
    item for item in latencies_ms
    if item["ttft"] <= ttft_target and item["tpot"] <= tpot_target
]

print(f"raw throughput: {len(latencies_ms) / window_seconds:.2f} req/s")
print(f"observed SLO-compliant throughput: {len(within_slo) / window_seconds:.2f} req/s")
print(f"SLO-compliant requests: {len(within_slo)}/{len(latencies_ms)}")raw throughput: 0.40 req/s
observed SLO-compliant throughput: 0.20 req/s
SLO-compliant requests: 2/4Why doesn't this 10-second window establish goodput?
Answer
It measures compliant completions at one offered load. Establishing goodput requires sweeping offered request rates and finding the maximum rate that still meets the chosen SLO-attainment target.
The toy window checks TTFT and TPOT only. A streaming endpoint should add its ITL rule to the same acceptance test, then hold that rule fixed across scheduler configurations.
Turn a mixed-load trace into an operating point
The 10-second window has one useful job: it makes SLO filtering concrete. It doesn't create an arrival process, queue pressure, or output-length mix, so it can't identify an endpoint's capacity. A hand-picked batch can pass while live traffic fails between iterations.
Predict possible failure signatures before you run it. As offered arrival rate rises, queue wait and TTFT may climb while a decode-first policy keeps ITL steady. A different policy may admit more prefills and hurt ITL first. Past a sustainable operating point, queues grow or requests are rejected. An open-loop client sends according to preassigned timestamps. A closed-loop client that waits for responses can hide overload by slowing its own arrivals. Record scheduled and actual send times: a saturated load generator must not quietly shift arrivals forward and erase its own queueing delay.
MLPerf's Server/Interactive rules make this workload distinction explicit: its load generator sends queries with a Poisson arrival process, tests multiple offered QPS values, and reports the maximum supported rate under scenario latency and quality requirements. It also samples the performance trace from a fixed library with a deterministic seed.[13] Use that discipline for an API benchmark without claiming MLPerf compliance: replay a public or production trace, or publish a fixed-seed distribution with the realized prompt and output lengths.
Freeze the contract before tuning. Otherwise a scheduler change can quietly change the workload it's being judged on:
| Contract item | Record before the sweep |
|---|---|
| Endpoint and system | Endpoint URL and protocol, streaming mode, model and tokenizer revision, engine commit, GPU model/count/topology, driver/runtime, and precision or quantization |
| Workload | A replayable public/production trace or fixed-seed distribution; prompt-length and output-length buckets, sampling and stop rules, and the exact request order |
| Arrival and concurrency | Open-loop arrival timestamps or the named arrival process at each offered ; client concurrency, max in-flight requests, and observed server concurrency |
| Warmup and window | Warmup requests or duration until compilation, allocators, and chosen caches are steady; measurement duration, drain time, and the samples excluded from warmup |
| Baseline | The exact scheduler/engine configuration being compared, with equivalent tuning and the same trace, system, and SLOs |
| Correctness | Deterministic or fixed-seed decoding where available, output validity, reference outputs or task-quality checks, token-count checks, and error, cancel, and timeout counts |
| Metrics and operating point | Queue wait, TTFT, per-token ITL, TPOT, raw throughput, p50 and p99 for each latency signal, KV pressure, preemptions, SLO attainment, and goodput; report the highest that passes every latency and correctness gate plus its neighboring pass/fail points |
One synthetic fixture is enough to expose why one uniform batch is weak: 60% short requests with 128-256 prompt tokens and 16-64 output tokens, 30% medium requests with 512-2,048 prompt tokens and 128-512 output tokens, and 10% long requests with 2,048-4,096 prompt tokens and 512-2,048 output tokens. Those proportions are a test fixture, not a claim about production traffic. A public trace or measured workload can replace it, but keep the realized lengths and arrival timestamps so every scheduler sees the same work.
For streaming, p50 alone can hide a stutter. Etalon shows why TTFT, TPOT, and related averages don't fully capture user-facing behavior, and proposes a fluidity-index for that gap.[14] You don't have to adopt its metric, but you do need an explicit ITL aggregation and a p99 report if smooth token delivery is an SLO.
Read the curve with the trace. Stable p50 with rising p99 suggests queue variance or starvation; confirm it with per-class waits. Rising TTFT with stable ITL can suggest admission or prefill wait. Rising p99 ITL can suggest prefill interference or oversized iterations, but transfer stalls and client buffering can look similar. Mark the operating point from measured SLO attainment, not from one latency signature alone.
With that contract in place, chunked prefill is the usual next knob when colocated prefill still stalls decode.
Chunked prefill keeps streams moving
An unchunked 4,000-token test log can make a mixed iteration too slow for live streams. Its duration depends on model, hardware, context, and batch; 4,000 tokens alone doesn't establish a millisecond stall. The decode results still wait for that iteration's work to complete.
The 2023 SARATHI paper combines chunked-prefills and decode-maximal batching.[15] Sarathi-Serve's 2024 scheduler develops stall-free admission: new prefills join without pausing ongoing decodes.[11] This names a scheduling property, not guaranteed constant ITL or universal SLO satisfaction.
For a decode-first illustration, slice the prompt into chunks such as 512 tokens and admit a chunk within leftover budget:
The mixed step amortizes weight reads across more tokens and can use compute that small decode batches underuse. Prefill still adds work, including attention over earlier chunks. A fixed token count does not make every chunk equally costly, and the extra wall-clock cost needn't be negligible.
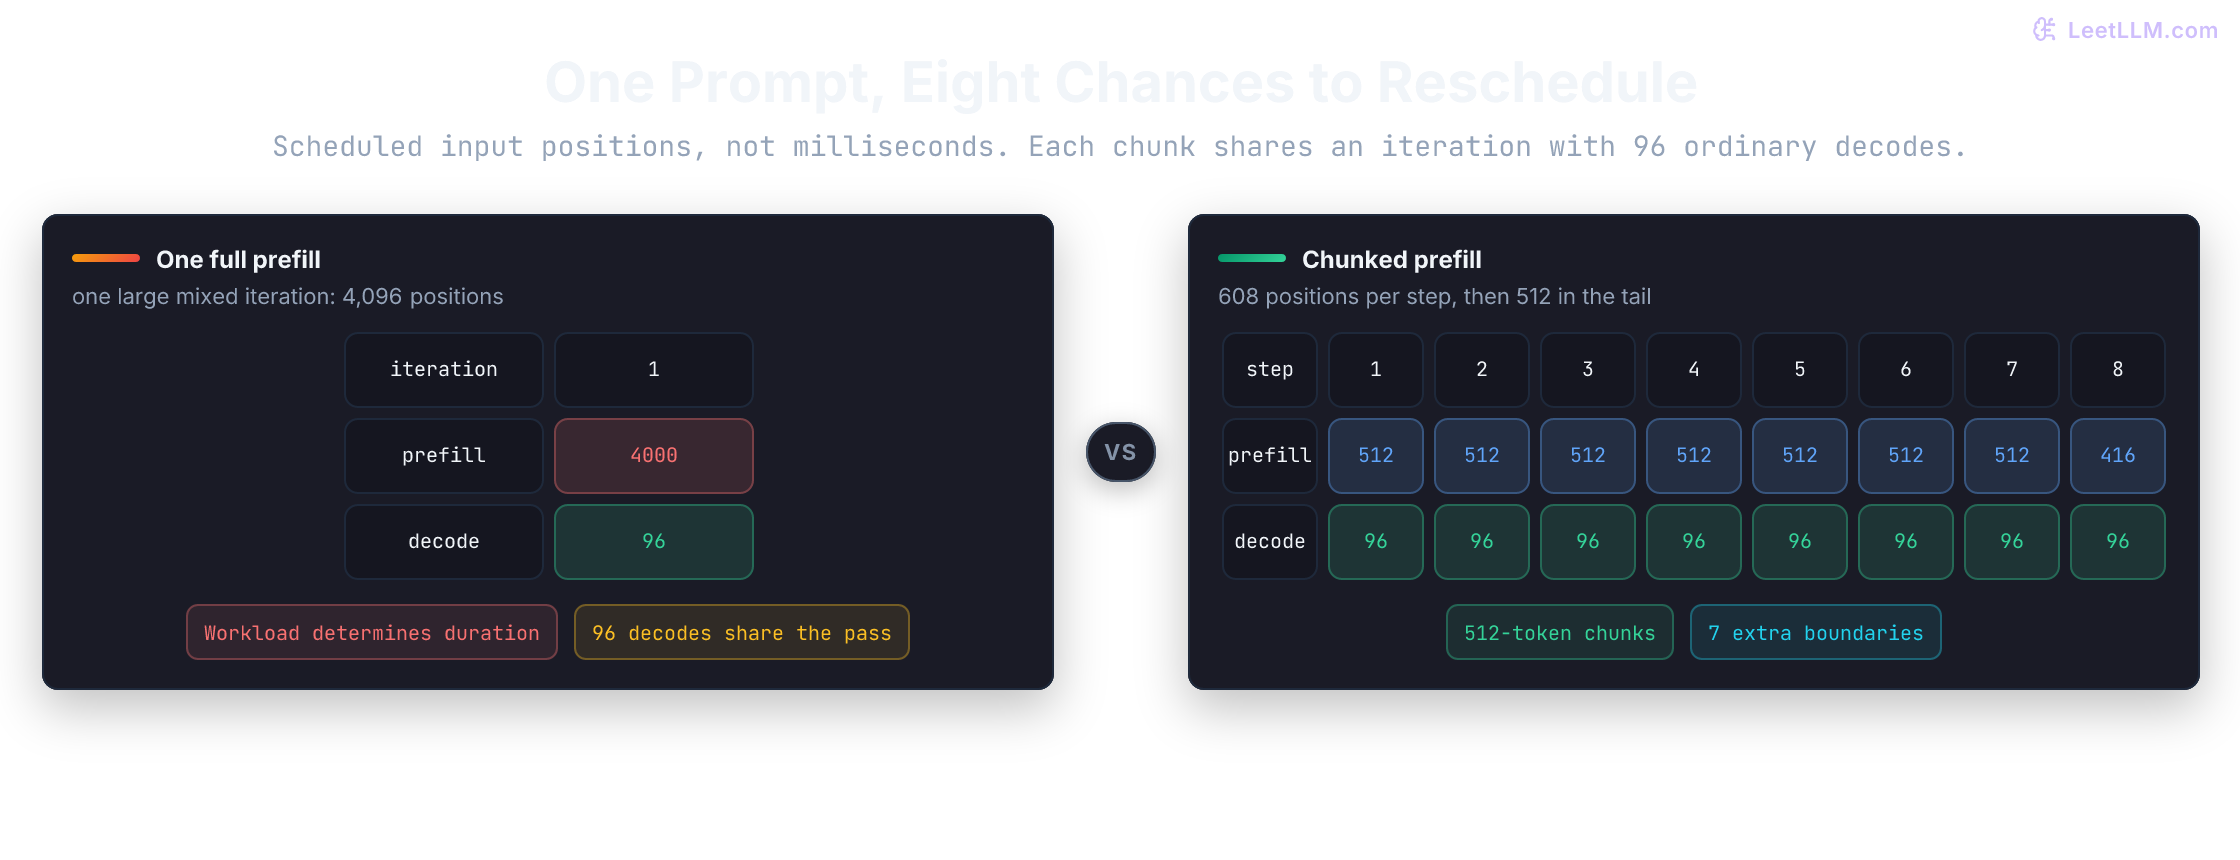
Without chunking, concurrent decode requests wait for the whole prompt. Average TBT can still look fine while the stream hitch is obvious in the UI.
With a 512-token chunk, the log becomes eight pieces (seven 512-token chunks plus a 416-token tail). Each illustrative step also schedules 96 decode positions, giving 608 positions in the first seven and 512 in the last. The scheduler re-evaluates at each boundary. Extra launches, repeated state access, and context-dependent attention can increase prefill cost. Streams get more chances to advance; their measured gaps may still miss an ITL target.
Current inference engines like vLLM V1 enable chunked prefill by default whenever possible: decode requests run first, leftover max_num_batched_tokens budget goes to prefills, and any prefill exceeding that allowance is chunked.[7] Larger budgets favor prefill throughput and TTFT; tighter budgets protect ITL smoothness. These are tuning tendencies, not latency guarantees.
prompt_tokens = 4000
chunk_size = 512
chunks = []
remaining = prompt_tokens
while remaining:
    current = min(chunk_size, remaining)
    chunks.append(current)
    remaining -= current

print(f"chunk count: {len(chunks)}")
print(f"first/last chunk: {chunks[0]}/{chunks[-1]} tokens")
print(f"decode scheduling boundaries: {len(chunks) - 1}")chunk count: 8
first/last chunk: 512/416 tokens
decode scheduling boundaries: 7Chunking still shares one GPU between phases. When prefill and decode want different hardware, the next move is to split the pools.
Disaggregated prefill and decode
Disaggregated serving (phase splitting) runs prefill and decode on separate worker pools. Splitwise[16] and DistServe[4] study this split directly: prefill often wants dense matrix throughput, decode often wants KV capacity and memory bandwidth.
Chunking doesn't remove shared capacity or all phase interference:
- HBM contention. Long prefills and growing streams compete for state capacity. Admission controls can defer work; preemption thrashing isn't inevitable.
- Different operating points. Prompt-heavy and decode-heavy workloads can favor different batching and parallelism. Neither phase is always bound by one resource; context, model architecture, and achieved batch size matter.
Separate workers can be on different nodes or different GPUs within one node. A connector hands off compatible state. Model/tokenizer revisions, exact token positions, cache layout/dtype, and other recurrent state must agree or be converted/reconstructed. Direct GPU-to-GPU network transfer is one transport choice, not the definition of disaggregation.[17]
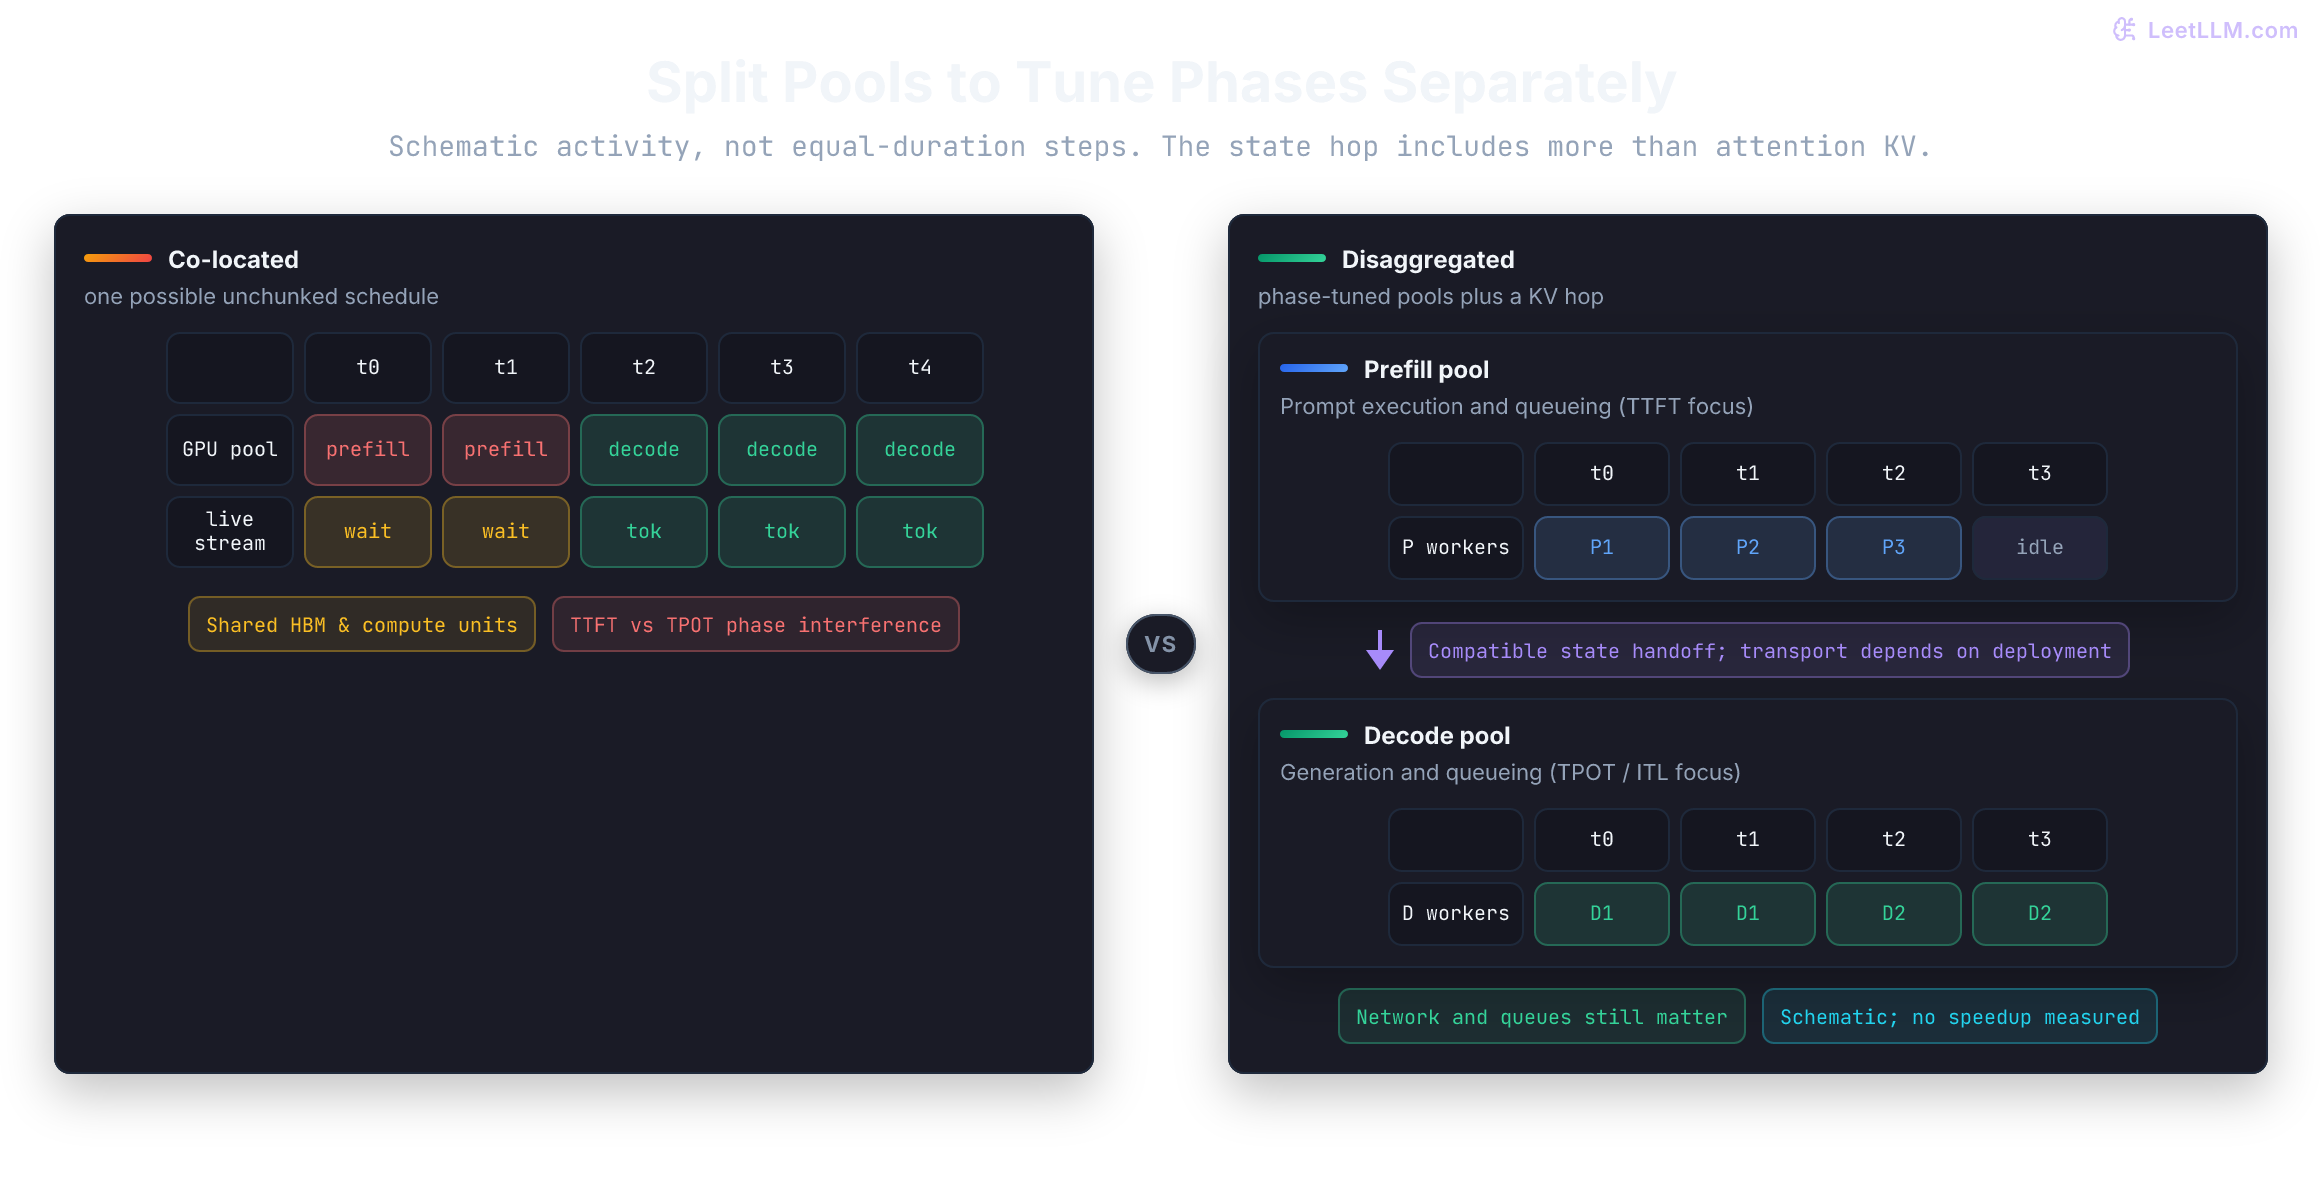
For a simplified serial handoff, readiness for the next decode includes both queues:
Layer-wise transfer can overlap work, so count the exposed handoff delay on the critical path rather than always summing complete stage durations. First-token delivery is a separate choice: prefill may supply a token before handoff completes, leaving a large first-to-second-token gap. A gateway that buffers it until the decode worker is ready instead pays that delay in TTFT. Measure both.
For a chosen payload and available payload bandwidth, the ideal serialization component is:
This excludes setup, queueing, layout conversion, and other state. At theoretical 10/25 Gbit/s line rates, 0.25 GiB alone takes about 215/86 ms, before overhead. A faster link can help, but no universal interconnect threshold establishes whether splitting is worthwhile. DistServe's testbed actually used 25 Gbit/s cross-node links and placed corresponding prefill/decode stages within a node to use NVLink.[4]
The paper reports up to 7.4× higher supported request rates versus DeepSpeed-MII in its chatbot comparison, under the evaluated OPT models, A100 deployment, and TTFT/TPOT targets with over 90% attainment.[4] It doesn't specify a universally optimal TP=4/TP=1 split. Current vLLM disaggregation documentation focuses on separate latency tuning and explicitly warns that the feature doesn't improve throughput by itself.[17]
layers, kv_heads, head_dim, bytes_per_value = 16, 4, 256, 2
prompt_tokens = 4096
link_gib_per_second = 50
kv_bytes = 2 * layers * kv_heads * head_dim * bytes_per_value * prompt_tokens
transfer_ms = kv_bytes / (link_gib_per_second * 1024**3) * 1000

print(f"attention KV portion: {kv_bytes / 1024**3:.2f} GiB")
print(f"idealized transfer time at {link_gib_per_second} GiB/s: {transfer_ms:.1f} ms")
print("not total handoff time: add other model state and transfer overhead")
for line_gbps in (10, 25):
    line_bytes_per_second = line_gbps * 1e9 / 8
    floor_ms = kv_bytes / line_bytes_per_second * 1000
print(f"serialization floor at {line_gbps} Gbit/s: {floor_ms:.1f} ms")attention KV portion: 0.25 GiB
idealized transfer time at 50 GiB/s: 5.0 ms
not total handoff time: add other model state and transfer overhead
serialization floor at 10 Gbit/s: 214.7 ms
serialization floor at 25 Gbit/s: 85.9 msPredict which latency moves when a gateway buffers the first token. These authored stage durations isolate delivery policy; they aren't a measured engine trace:
prefill_queue, prefill = 20, 60
handoff, decode_queue, next_decode = 40, 15, 10
prefill_done = prefill_queue + prefill
decode_ready = prefill_done + handoff + decode_queue
second_token = decode_ready + next_decode

for policy, first_token in (
    ("early", prefill_done), ("buffered", decode_ready)
):
    gap = second_token - first_token
    meets_targets = first_token <= 90 and gap <= 30
    print(f"{policy}: TTFT={first_token} ms, first gap={gap} ms, targets met={meets_targets}")
assert second_token == 145
print(f"second token arrives at {second_token} ms under both policies")early: TTFT=80 ms, first gap=65 ms, targets met=False
buffered: TTFT=135 ms, first gap=10 ms, targets met=False
second token arrives at 145 ms under both policiesNeither delivery policy satisfies the 90 ms TTFT and 30 ms gap targets here. Buffering changes where the delay is visible; it doesn't create capacity or finish the second token earlier.
Read the failure signature
A scheduler usually reveals its bottleneck in the trace long before it fails in headline throughput:
-
Symptom 1: High raw TPS, but P99 ITL spikes violently. Check: Correlate long gaps with admitted prefill positions and measured iteration duration. Transfers, device stalls, or buffered delivery can produce similar symptoms. Try: Chunk prefills and reduce the mixed-step budget, then remeasure both ITL and TTFT. More boundaries don't guarantee uniform gaps.
-
Symptom 2: Stable P50 ITL, but P99 TTFT inflates under load while decode throughput stays high. Check: Inspect prefill wait by request class and whether decode consumes all available work or state capacity. Offered overload can resemble policy starvation. Try: Age waiting work or reserve admission opportunities within the budgets. Reject or expire requests whose deadlines can't be met; aging alone cannot guarantee TTFT.
-
Symptom 3: Out-of-memory crashes or sudden preemption thrashing mid-generation. Check: Trace resident blocks, projected growth, workspace, and preemption counts. A request-count cap alone misses variable state cost; other allocations can also cause OOM. Try: Enforce state headroom and lower admitted work/concurrency. Compare replay and transfer costs for the actual histories and engine instead of assuming recomputation is always faster.
-
Symptom 4: Disaggregated serving exhibits worse TTFT than colocated serving. Check: Break down prefill queue, execution, exposed state handoff, decode queue, and first-token delivery. Placement, conversion, and unbalanced pools matter alongside link bandwidth. Try: Improve locality or the measured transfer path, rebalance pools, and compare the complete critical path with colocation. GPUDirect RDMA is an option, not a proof that the split is beneficial.
A chat stream and a background summarizer can have different targets, but neither target is served by a chart that omits queue wait.
What to carry into a serving design
Static batching leaves holes when lengths differ. Continuous batching can refill them when queued work and compatible state capacity are available. The scheduler must reserve headroom and rebuild the active set at each iteration.
When prefill and decode interfere, chunking bounds each prefill slice. When their hardware needs diverge, disaggregation trades a KV handoff for separate pools.
Judge each step on SLO-qualified goodput under the traffic you actually serve, not raw tokens/sec.
That's the progression: request-level batches, iteration-level refills, bounded prefill, then phase-level separation when the measured curve justifies its transfer cost.
Run a mixed-load trace
Replay the same mixed trace across scheduler settings. Warm up until the endpoint reaches its declared steady state, send requests with the chosen open-loop arrival process, and drain every response before ending the run. Record per-request queue wait, TTFT, ITL, output length, correctness, token-budget use, KV-block pressure, preemptions, and errors.
Plot offered against p50 and p99 latency, raw throughput, SLO attainment, and goodput. Compare each curve with the policy you think you configured, then keep the trace and pass/fail operating points as the acceptance artifact for the next scheduler change.
Count all offered requests when reporting SLO attainment, including rejected, timed-out, and invalid responses as failures. Declare whether throughput uses the arrival window or elapsed time including drain; never silently drop unfinished requests. Goodput is the load-sweep operating point, not a separate throughput curve that falls at each offered load. Plot compliant throughput at each load, then mark the highest passing offered rate.
Follow-up questions
- The scheduler can fit a prompt now but not its maximum generation when running alone. Would you reject it, enforce a shorter output limit, or support state offload? What does the client observe?
- A 512-token prefill chunk fits the token budget but p99 ITL still misses its target. Which measurements would distinguish long-context attention cost, transfer delay, and an oversized decode batch?
- A preempted request has emitted 500 tokens. Which token history must survive a recompute, and which outputs must not be sent again?
Evaluation rubric
- Trace slot reuse at explicit iteration boundaries and distinguish that count from GPU utilization or elapsed time.
- Enforce both per-iteration work and resident KV capacity, including growth, completion, cancellation, and impossible requests.
- Preserve accepted output when swapping or recomputing state; explain what the CPU fixture leaves untested.
- Explain chunking and phase separation with their overheads, without promising either guarantees an SLO.
- Define the arrival process, failure denominator, latency aggregation, and highest passing load before comparing serving configurations.