Personalize this lesson
Adapt explanations and teaching visuals to your background and preferred voice.
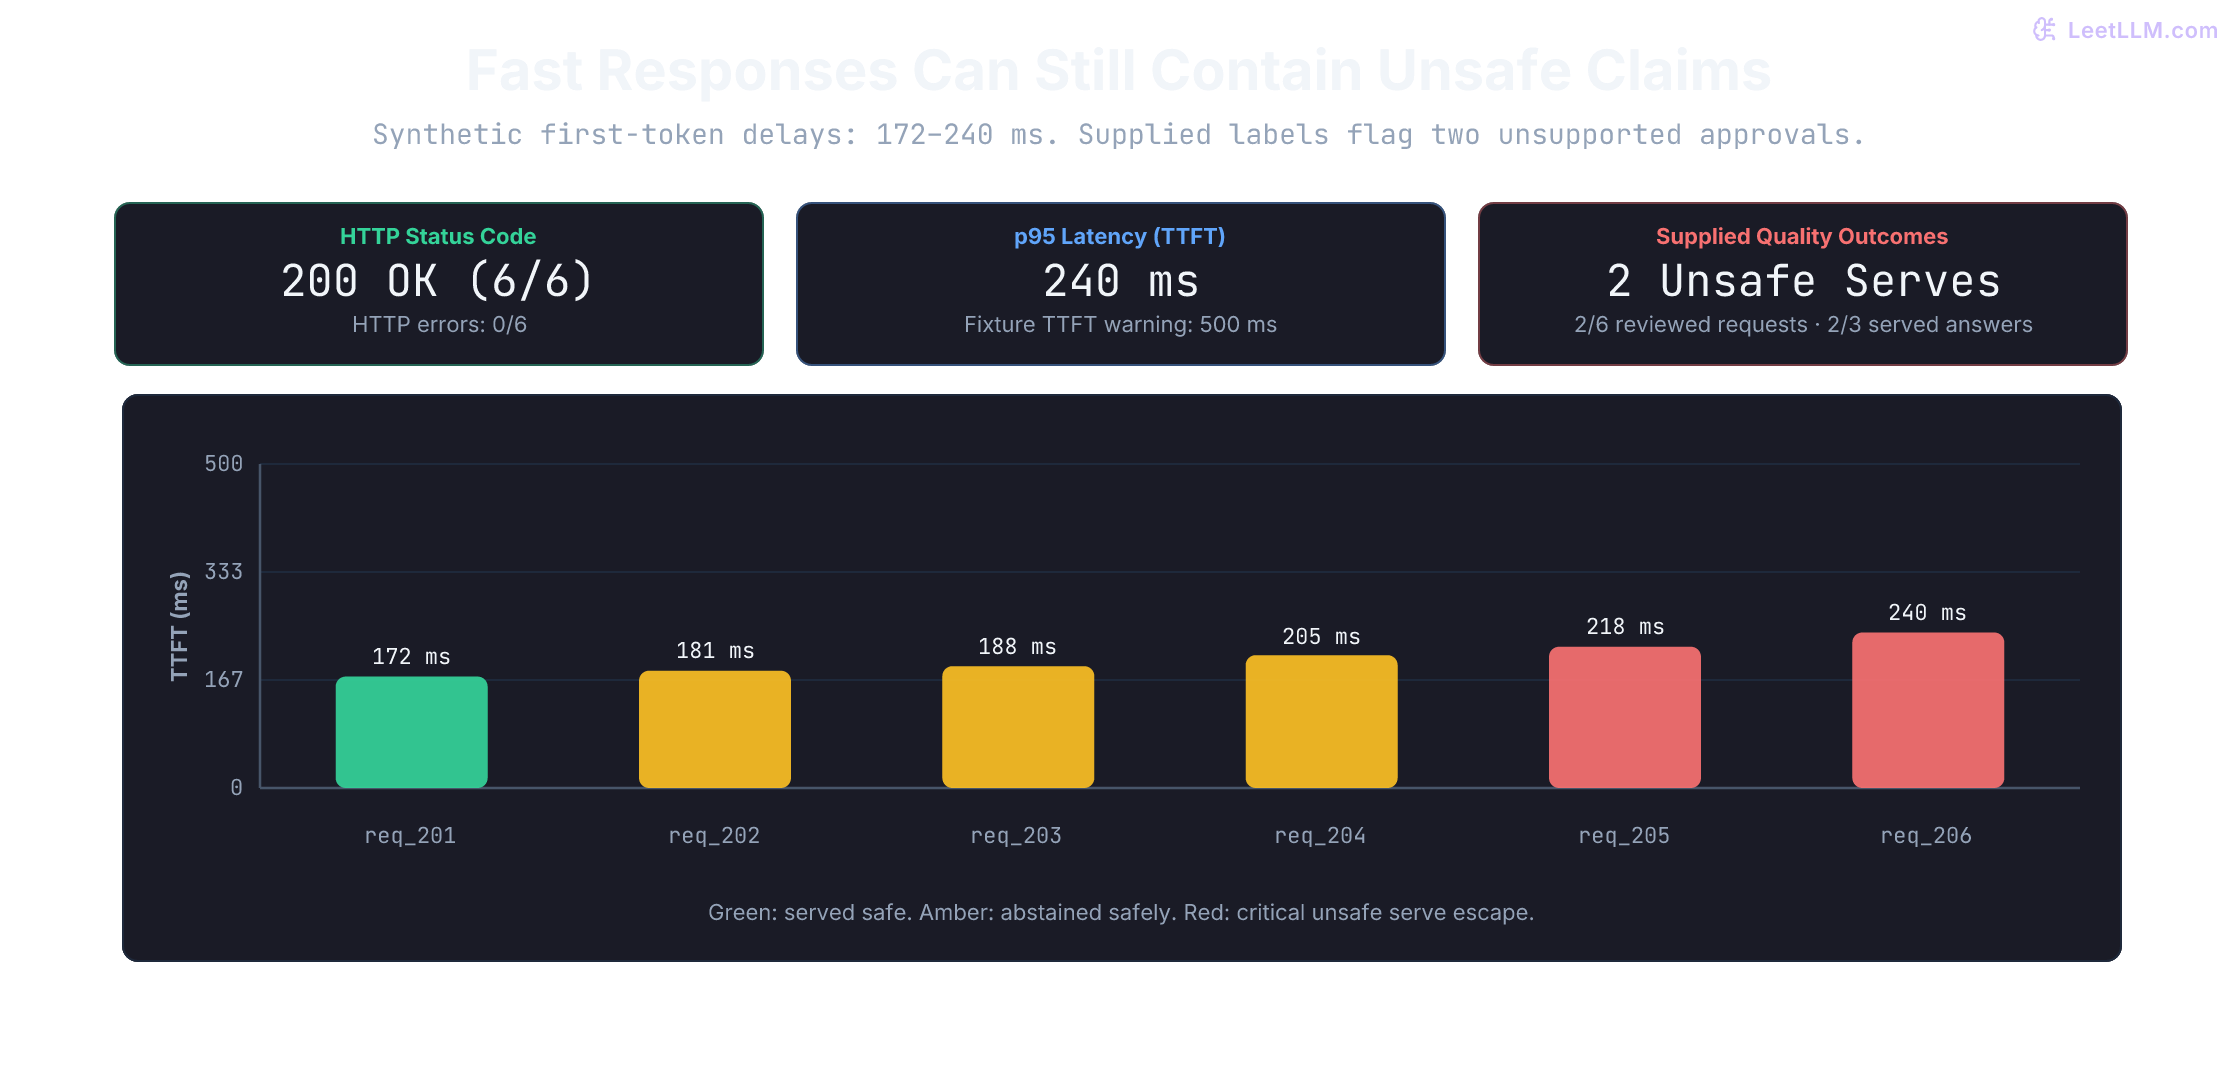
At 09:12 in a fictional deploy-policy window, the dashboard for a large language model (LLM) service looks spotless: all six responses return 200 OK, first-token delays stay below the fixture's 500 ms warning threshold, and estimated cost stays under budget. Two answers still contain unsupported deploy approvals. The window, outcomes, and prices below were supplied by hand; no production service or human annotation study ran.
Application Performance Monitoring (APM) can carry custom quality metrics and traces. The gap is an incomplete measurement contract: HTTP success alone doesn't establish correct content, for ordinary software or an LLM. Google's SRE guidance already includes wrong content returned with HTTP 200 as an implicit error. For this answerer, extend those operational signals with evidence support, containment outcomes, token usage, and request execution structure.[1]
In the previous lesson, we built incident-answerer-v1: a claim gate that refused to invent a recovery time missing from the versioned incident record. Each request wrote a trace recording evidence version, route, and first failed stage. We maintain that contract on the parallel deploy-answerer-v1 path, then observe a window. One trace answers what happened to one request; window metrics answer whether failure rate, token burn, or latency shifted across the service.
Observability joins those views. Monitoring compresses many events into rates, percentiles, and alerts. Trace evidence lets an on-call engineer start from an alert and inspect the operations and reviewed outcomes for one failed call. You need both because a fast, inexpensive 200 can still be a severe safety incident.
Emit containment and outcome fields at the serving gate
Start with the serving decision. A claim gate compares draft claims with admitted evidence, then chooses whether to show or withhold an answer. Its route and a separate check of the served answer let you ask both "what happened?" and "where did containment fail?":
| Serving question | Event field | Why it matters |
|---|---|---|
| What answer route was chosen? | route | Shows serve, shorten, review, or abstain behavior |
| Did a substantive answer actually reach the operator? | substantive_output_served | Observed payload outcome, not just the route label |
| Did an unsupported claim reach the operator? | unsafe_claim_served | Reviewed outcome, separate from the gate's own verdict |
| Where did a request first go wrong? | first_failed_stage | Separates evidence, generation, and serving faults |
| Which protection boundary leaked a known failure? | escape_stage | Separates the observed defect from failed containment |
| Which record and prompt were used? | evidence_version, prompt_template_id | Locates artifacts needed for reproduction |
| Was the request usable and affordable? | token and timing fields | Measures experience and cost beside quality |
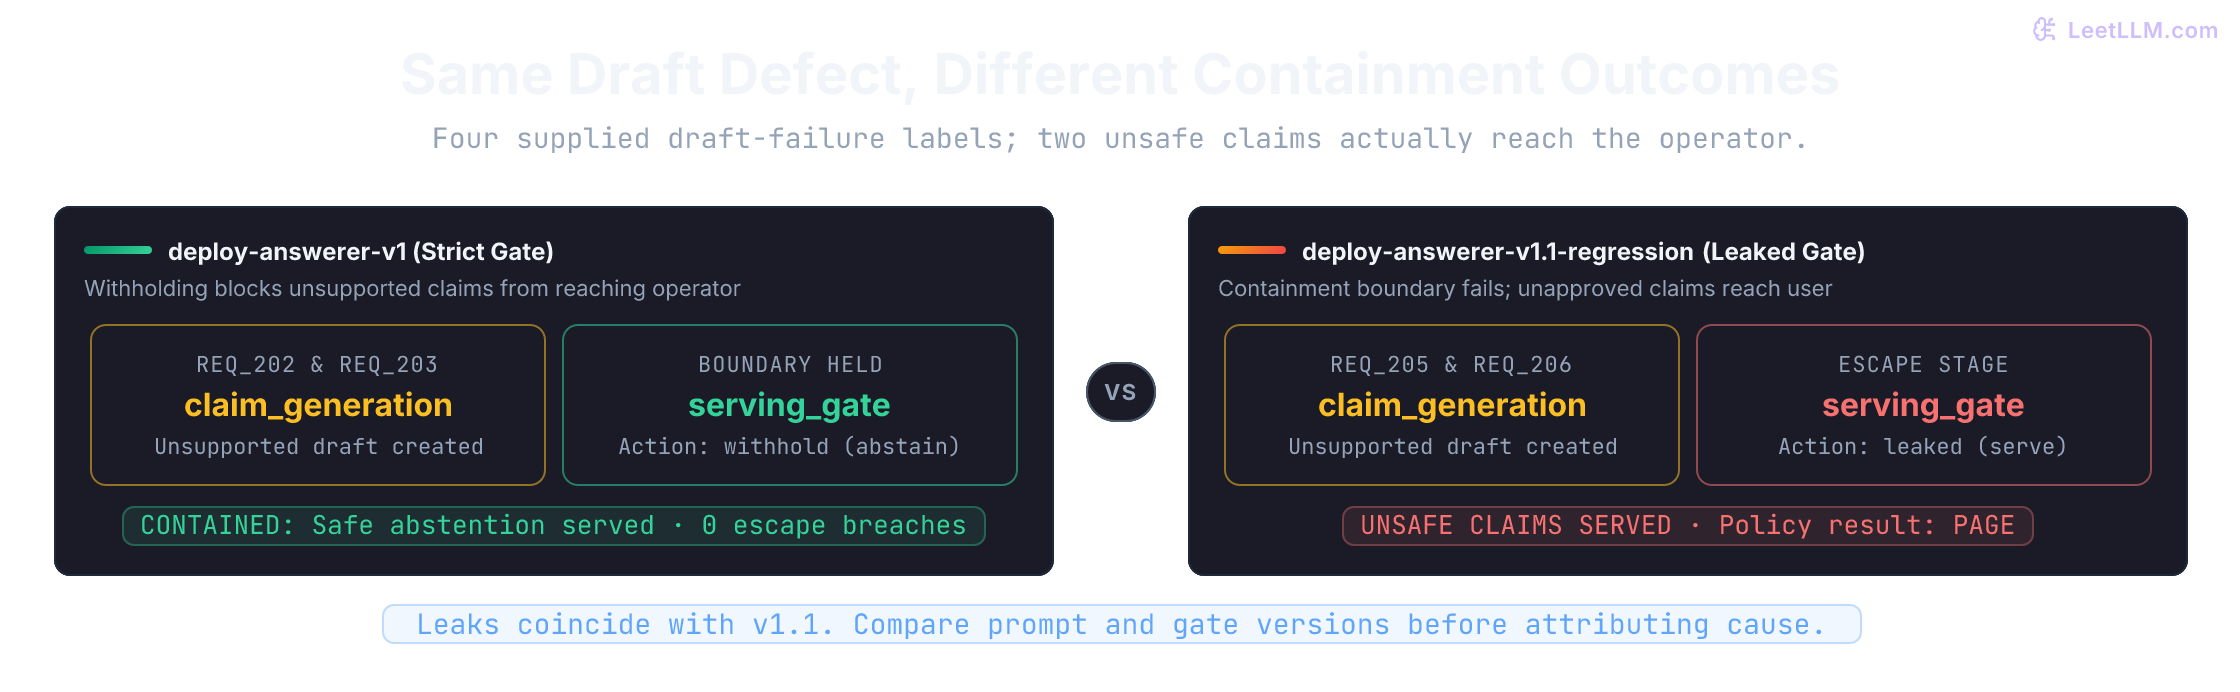
These six synthetic requests have hand-authored outcome labels. The strict path serves one supported answer and withholds three others, including one request with no admitted policy. The regressed path serves two invented approvals. Four drafts contain unsupported claims, but only two reach an operator. The fixture models a complete final event set; a live collector must reconcile received events with an independent ingress count for the same window.
A live serving gate can't certify its own success. Join independent rule checks, reviewed outcomes, or versioned evaluator results to the request ID. Here False means reviewed with no unsupported served claim; None means not checked yet. Neither a missing label nor an evaluator timeout means safe. Stage labels are investigation annotations, not automatic proof of a root cause.
Read the six rows before running the code. Which requests should trigger the unsafe-serve policy, and which should merely contribute to the abstention count?
from dataclasses import dataclass, replace
from types import MappingProxyType
from collections.abc import Mapping

ROUTES = frozenset({"serve", "shorten", "review", "abstain"})
FAILURE_STAGES = frozenset({
    "passed", "evidence_admission", "claim_generation", "generation_stability",
    "stability_check_incomplete", "serving_gate", "unknown",
})
ESCAPE_STAGES = frozenset({"serving_gate", "privacy_filter", "safety_filter"})

def require_text(value: object, name: str) -> None:
    if type(value) is not str or not value.strip():
        raise ValueError(f"{name} must be a nonempty string")

@dataclass(frozen=True)
class TraceEvent:
    request_id: str
    case_id: str
    evidence_version: str | None
    prompt_template_id: str
    route: str
    first_failed_stage: str
    escape_stage: str | None
    unsafe_claim_served: bool | None
    substantive_output_served: bool
    input_tokens: int
    cached_input_tokens: int
    output_tokens: int
    ttft_ms: int
    total_ms: int

    def __post_init__(self) -> None:
        for name in ("request_id", "case_id", "prompt_template_id"):
            require_text(getattr(self, name), name)
        if self.evidence_version is not None:
            require_text(self.evidence_version, "evidence_version")
        if (type(self.route) is not str or self.route not in ROUTES
                or type(self.first_failed_stage) is not str
                or self.first_failed_stage not in FAILURE_STAGES):
            raise ValueError("unknown route or failure stage")
        if self.escape_stage is not None and (
            type(self.escape_stage) is not str or self.escape_stage not in ESCAPE_STAGES
        ):
            raise ValueError("unknown containment boundary")
        if self.unsafe_claim_served is not None and type(self.unsafe_claim_served) is not bool:
            raise ValueError("outcome must be a Boolean or None for pending review")
        if type(self.substantive_output_served) is not bool:
            raise ValueError("payload outcome must be a Boolean")
        if self.unsafe_claim_served is True and not self.substantive_output_served:
            raise ValueError("an unsafe served claim requires an actual served payload")

current_window = [
    TraceEvent("req_201", "clean_policy", "deploy-policy@v17", "deploy-answerer-v1",
               "serve", "passed", None, False, True, 188, 80, 27, 172, 410),
    TraceEvent("req_202", "invented_approval", "deploy-policy@v17", "deploy-answerer-v1",
               "abstain", "claim_generation", None, False, False, 196, 80, 20, 181, 395),
    TraceEvent("req_203", "wrong_freeze_status", "deploy-policy@v17", "deploy-answerer-v1",
               "abstain", "claim_generation", None, False, False, 192, 80, 21, 188, 402),
    TraceEvent("req_204", "missing_policy", None, "deploy-answerer-v1",
               "abstain", "evidence_admission", None, False, False, 160, 64, 15, 205, 382),
    TraceEvent("req_205", "invented_approval", "deploy-policy@v17", "deploy-answerer-v1.1-regression",
               "serve", "claim_generation", "serving_gate", True, True, 198, 80, 29, 218, 430),
    TraceEvent("req_206", "invented_approval", "deploy-policy@v17", "deploy-answerer-v1.1-regression",
               "serve", "claim_generation", "serving_gate", True, True, 201, 80, 30, 240, 455),
]
ingress_request_count = 6  # Separate fixture counter for this exact window.

print(f"events={len(current_window)}")
for event in current_window:
    verdict = {True: "UNSAFE SERVE", False: "reviewed safe", None: "unchecked"}[event.unsafe_claim_served]
print(f"{event.request_id}: {event.route:7} {verdict}")events=6
req_201: serve reviewed safe
req_202: abstain reviewed safe
req_203: abstain reviewed safe
req_204: abstain reviewed safe
req_205: serve UNSAFE SERVE
req_206: serve UNSAFE SERVEAn abstention isn't automatically a failure. When evidence doesn't establish a deploy approval, withholding is safe product behavior. Under this service's policy, the page-worthy event is an unsupported factual claim reaching an operator.
Rows show event-level evidence. Next, turn them into a window metric while keeping one violating request attached for diagnosis.
Traces connect steps within a request. Metrics summarize a population over time. Logs record discrete events and can share trace IDs. These signals overlap; their retention and privacy controls are design choices, not properties implied by their names.
Turn request evidence into quality metrics
A metric is useful only when its numerator matches the invariant it claims to protect. A generic "answer quality score" could hide two unsafe deploy claims inside many pleasant responses. Start with counts whose denominators you can explain:
| Metric | Numerator / denominator | Interpretation |
|---|---|---|
| Reviewed unsafe-serve rate | Reviewed unsafe requests / reviewed requests | Failure rate among checked requests, not necessarily all traffic |
| Conditional unsafe-answer risk | Reviewed unsafe substantive answers / reviewed substantive answers | Same denominator as the previous lesson's unsafe-serve rate |
| Reviewed safe-route rate | Reviewed requests without an unsafe served claim / reviewed requests | Complement within the same reviewed set |
| Review coverage | Reviewed requests / all requests | Makes missing quality evidence visible |
| Abstention rate | Abstained requests / requests | Product usefulness signal, not a safety failure by itself |
| Failure-stage count | Requests by first failed stage | Where engineers should investigate first |
| Escape-stage count | Unsafe requests by leaked protection boundary | Where containment failed after the first defect |
Two requests are unsafe serves, three abstain, and four drafts have a supplied generation-defect label. The summary keeps those counts separate. It rejects duplicate request IDs and shows how many ingress requests have a received final event. An absent event is not a safe request. Production delayed-review updates need an upsert keyed by request ID, not a second row in the denominator.
from collections import Counter
from dataclasses import dataclass

@dataclass(frozen=True)
class QualityWindow:
    requests: int
    observed: int
    reviewed: int
    reviewed_served: int
    unsafe_serves: int
    abstentions: int
    failure_stages: Mapping[str, int]
    escape_stages: Mapping[str, int]

    @property
    def unsafe_serve_rate(self) -> float | None:
        return self.unsafe_serves / self.reviewed if self.reviewed else None

    @property
    def safe_route_rate(self) -> float | None:
        return (self.reviewed - self.unsafe_serves) / self.reviewed if self.reviewed else None

    @property
    def conditional_unsafe_answer_risk(self) -> float | None:
        return self.unsafe_serves / self.reviewed_served if self.reviewed_served else None

def quality_window(events: list[TraceEvent], ingress_request_count: int) -> QualityWindow:
    if type(events) not in (list, tuple) or any(type(event) is not TraceEvent for event in events):
        raise ValueError("need validated final events")
    if type(ingress_request_count) is not int or ingress_request_count < len(events):
        raise ValueError("ingress count must cover every observed request")
    if len({event.request_id for event in events}) != len(events):
        raise ValueError("one final outcome per request ID is required")
    return QualityWindow(
        requests=ingress_request_count,
        observed=len(events),
        reviewed=sum(event.unsafe_claim_served is not None for event in events),
        reviewed_served=sum(event.unsafe_claim_served is not None and event.substantive_output_served
                            for event in events),
        unsafe_serves=sum(event.unsafe_claim_served is True for event in events),
        abstentions=sum(event.route == "abstain" for event in events),
        failure_stages=MappingProxyType(dict(Counter(event.first_failed_stage for event in events))),
        escape_stages=MappingProxyType(dict(Counter(
            event.escape_stage for event in events
            if event.unsafe_claim_served is True and event.escape_stage is not None
        ))),
    )

quality = quality_window(current_window, ingress_request_count)
print(f"unsafe_serve_rate={quality.unsafe_serve_rate:.1%}")
print(f"conditional_unsafe_answer_risk={quality.conditional_unsafe_answer_risk:.1%}")
print(f"safe_route_rate={quality.safe_route_rate:.1%}")
print(f"review_coverage={quality.reviewed}/{quality.requests}")
print(f"abstentions={quality.abstentions}")
print(f"claim_generation_failures={quality.failure_stages['claim_generation']}")
print(f"serving_gate_escapes={quality.escape_stages['serving_gate']}")

assert quality.unsafe_serves == 2
assert quality.failure_stages["claim_generation"] == 4
assert quality.escape_stages["serving_gate"] == 2unsafe_serve_rate=33.3%
conditional_unsafe_answer_risk=66.7%
safe_route_rate=66.7%
review_coverage=6/6
abstentions=3
claim_generation_failures=4
serving_gate_escapes=2All six requests were reviewed, so 2/6 measures unsafe requests in this complete window. Among the three substantive answers actually served, 2/3 were unsafe. Withholding more answers changes the conditional denominator, which is why the previous lesson also tracked usefulness and coverage. The complemented 4/6 rate means no unsafe served claim was found; it doesn't establish correct, complete answers for four requests.
If only the two unsafe examples were selected for review, 2/2 would describe that selected set, not a 100% production failure rate. An empty reviewed set has an undefined rate, not zero. The payload flag must come from inspecting actual output: relabeling a leaked answer abstain doesn't make it withheld.
The strict template withheld two unsupported drafts; the regressed template let two escape. That association makes the template change worth investigating. It doesn't establish whether the cause was a prompt edit, gate configuration, or another correlated change. Mitigate the unsafe path, then compare the versioned artifacts and reproduce the failure.
An answer returns HTTP 200 in 500 ms but cites the wrong runbook. Which signal catches the failure?
Answer
A product-quality check tied to expected evidence or a reviewed outcome. Transport success and latency show that the request completed, not that the answer was correct.
Keep the golden signals and explain LLM latency
Quality is the first invariant here, but operators also notice sluggish answers. Keep Google's four golden signals: latency, traffic, errors, and saturation. An LLM endpoint still needs request arrival rates, active streams, failed requests, and evidence of exhausted capacity. Add measurements that explain its workload rather than replacing traffic and saturation with quality scores.[1]
| Measurement | Boundary to document |
|---|---|
| Time to first token (TTFT) | Request dispatch to first visible token. Depending on instrumentation, this can include retrieval, network transit, queueing, prefill, and output buffering or gating. A server timer has a different boundary. |
| Inter-token latency and throughput | Individual model tokens, visible tokens, or client chunks. Chunk delivery is not a direct measurement of every decoding step. |
| Traffic and saturation | Requests/s and active streams; for a self-hosted model, queue depth, batch size, memory and KV-cache occupancy, and accelerator utilization help locate bottlenecks. |
| Usage and estimated cost | Total input, cached-input subsets, and output against a named rate card. Reasoning tokens may be included within output usage rather than an additional billable category. |
| Cached-input fraction | cached_input_tokens / input_tokens, with no fraction when input is zero. This is a token fraction, not the fraction of requests that hit a cache. Latency and savings depend on the cache implementation and pricing. |
| Containment and reviewed quality | Gate interventions, independently detected escapes, review coverage, label delay, and the evaluator version. An intervention count alone does not count defects that escaped detection. |
Prefill can process multiple prompt positions together. Autoregressive decoding often becomes memory-bandwidth limited at small batch sizes, but the bottleneck depends on model, hardware, batch size, context length, and implementation. Don't infer it from slow client delivery alone. The inference study cited here analyzes those tradeoffs for particular models and TPU configurations; it does not establish a universal GPU bottleneck.[2]
For a streamed response in this lab:
- TTFT is the delay before the operator sees output.
- Post-first-token throughput measures how quickly the remaining output arrives.
- End-to-end latency includes the entire response.
The fixture assumes visible tokens arrive individually: ttft_ms ends at the first token and total_ms ends at the last token, measured from the same monotonic start. For req_206, 30 output tokens leave 29 after the first, over 455 - 240 = 215 ms. Its post-first-token throughput is 29 / 0.215 = 134.9 tokens/s.
An API chunk can contain zero, one, or several tokens. Usage totals may also include hidden reasoning tokens. Don't apply this formula to chunk timestamps and billed token totals without reconciling those boundaries. Measure first visible content, final visible content, and visible output tokens consistently; separately retain full request duration through stream closure.
The fixture also reports p95 TTFT: 95% of measured requests begin output at or below that first-token delay. With only six requests, nearest-rank p95 is the slowest observation. This teaches the calculation, not a production budget.
import math

def nearest_rank_percentile(values: list[int], percentile: float) -> int:
    if (type(values) not in (list, tuple) or not values
            or type(percentile) not in (int, float) or not 0 < percentile <= 1):
        raise ValueError("need observations and a percentile in (0, 1]")
    if any(type(value) is not int or value < 0 for value in values):
        raise ValueError("timings must be non-negative integer milliseconds")
    ordered = sorted(values)
    rank = max(1, math.ceil(percentile * len(ordered)))
    return ordered[rank - 1]

def post_first_token_tps(event: TraceEvent) -> float | None:
    if type(event.output_tokens) is not int or event.output_tokens < 1:
        raise ValueError("TTFT requires at least one visible output token")
    if any(type(value) is not int or value < 0 for value in (event.ttft_ms, event.total_ms)):
        raise ValueError("timings must be non-negative integer milliseconds")
    if event.total_ms < event.ttft_ms:
        raise ValueError("total_ms cannot precede ttft_ms")
    remaining_tokens = event.output_tokens - 1
    if remaining_tokens == 0:
        return None  # No post-first-token interval to measure.
    remaining_ms = event.total_ms - event.ttft_ms
    if remaining_ms <= 0:
        raise ValueError("total_ms must exceed ttft_ms after the first token")
    return remaining_tokens / (remaining_ms / 1000)

p95_ttft_ms = nearest_rank_percentile([event.ttft_ms for event in current_window], 0.95)
example_tps = post_first_token_tps(current_window[-1])
malformed_timing = replace(current_window[-1], total_ms=240)

print(f"p95_ttft_ms={p95_ttft_ms}")
print(f"req_206_post_first_tps={example_tps:.1f}")
print(f"quality_safe={quality.unsafe_serves == 0}")
try:
    post_first_token_tps(malformed_timing)
except ValueError as error:
    print(f"invalid_timing={error}")
else:
    raise AssertionError("malformed timing event should fail")

assert p95_ttft_ms == 240
assert quality.unsafe_serves > 0p95_ttft_ms=240
req_206_post_first_tps=134.9
quality_safe=False
invalid_timing=total_ms must exceed ttft_ms after the first tokenThis window is fast and unsafe. A latency-only dashboard wouldn't catch the unsafe release.
Under these timing assumptions, a multi-token response with total_ms <= ttft_ms has no usable post-first-token interval. Repair the instrumentation or increase timer resolution; don't invent a denominator. A one-token response returns None because there are no later tokens to measure.
OpenTelemetry (OTel) GenAI conventions are Development and live in a dedicated repository. Pin the convention revision your instrumentation emits.[3]
The conventions checked on September 21, 2026, at revision cc07f722069974139dab497d80d145144b19daca, distinguish client chunk timing from server token timing. gen_ai.client.operation.time_to_first_chunk and gen_ai.client.operation.time_per_output_chunk measure client delivery. gen_ai.server.time_to_first_token and gen_ai.server.time_per_output_token measure model-server output for successful responses. Their unit is seconds; so is the span attribute gen_ai.response.time_to_first_chunk. First chunk and first server token aren't interchangeable measurements.[4][5]
This lab's ttft_ms is an application-owned, operator-visible field. Write down where the timer starts and stops before comparing it with a server metric. Also count errors and cancellations separately: a latency distribution over completed responses can look healthy while requests fail before producing output.
Follow request execution with distinct spans
A flat event row can trigger a page, but it doesn't reveal how nested operations executed. In a modern AI pipeline, a single user request branches across embedding lookup, vector search, reranking, model inference, and safety validation. If services emit isolated log lines, on-call engineers must reconstruct execution by guessing timestamp correlations across distributed services.
OpenTelemetry records parent-child spans. W3C Trace Context uses a 128-bit trace ID and distinct 64-bit span IDs; its HTTP traceparent format is version-trace-id-parent-id-trace-flags. Instrumentation must inject and extract context across HTTP calls, queue message metadata, and async boundaries. Installing an SDK alone doesn't establish every link.[6]
Our tiny tracer illustrates nesting with local integer IDs. It is not an OTel SDK: it has no exporter, timestamps, concurrent-task context, or distributed propagation. A repeated span name must still identify a new operation.
Under the GenAI semantic conventions:
- Inference spans: The recommended name is
{gen_ai.operation.name} {gen_ai.request.model}, such aschat deploy-assistant-prod. Provider and operation fields are required; model, request parameters, and usage have their own availability conditions.[5] - Retrieval spans: The recommended name is
{gen_ai.operation.name} {gen_ai.data_source.id}, such asretrieval deploy-policy. Retrieval top-k is recommended; our evidence-version field is custom. - Tool execution spans: The recommended name is
execute_tool {gen_ai.tool.name}. Tool call IDs are recommended when available; arguments and results are opt-in. - Product governance spans: Operations like
serving_gateretain platform names because custom policy containment isn't a standardized model-layer operation.
The request is the root; retrieval, chat, and serving_gate are siblings. The chat span carries the reviewed generation defect and the gate span carries the containment escape.
from contextlib import contextmanager
from dataclasses import dataclass

@dataclass(frozen=True)
class Span:
    span_id: int
    name: str
    parent_id: int | None
    attributes: Mapping[str, str | int | bool]

class Tracer:
    def __init__(self) -> None:
        self.spans: list[Span] = []
        self._stack: list[int] = []

    @contextmanager
    def start(self, name: str, **attributes: str | int | bool):
        require_text(name, "span name")
        parent_id = self._stack[-1] if self._stack else None
        span = Span(len(self.spans), name, parent_id, MappingProxyType(dict(attributes)))
        self.spans.append(span)
        self._stack.append(span.span_id)
        try:
            yield span
        finally:
            self._stack.pop()

tracer = Tracer()
unsafe = next(event for event in current_window if event.unsafe_claim_served)
with tracer.start("deploy-answer.request", **{"platform.request.id": unsafe.request_id}):
    with tracer.start(
        "retrieval deploy-policy",
        **{
            "gen_ai.operation.name": "retrieval",
            "gen_ai.data_source.id": "deploy-policy",
            "platform.evidence.version": unsafe.evidence_version or "",
        },
    ):
        pass
    with tracer.start(
        "chat deploy-assistant-prod",
        **{
            "gen_ai.operation.name": "chat",
            "gen_ai.provider.name": "platform.internal",
            "gen_ai.request.model": "deploy-assistant-prod",
            "gen_ai.usage.input_tokens": unsafe.input_tokens,
            "gen_ai.usage.output_tokens": unsafe.output_tokens,
            "platform.failure.stage": unsafe.first_failed_stage,
        },
    ):
        pass
    with tracer.start(
        "serving_gate",
        **{
            "platform.answer.route": unsafe.route,
            "platform.answer.unsafe_claim_served": unsafe.unsafe_claim_served,
            "platform.failure.escape_stage": unsafe.escape_stage or "",
        },
    ):
        pass

by_id = {span.span_id: span for span in tracer.spans}
print(f"root={unsafe.request_id}")
for span in tracer.spans:
    parent_name = None if span.parent_id is None else by_id[span.parent_id].name
    print(f"{span.name} parent={parent_name}")

assert unsafe.request_id == "req_205"
assert [span.parent_id for span in tracer.spans] == [None, 0, 0, 0]
assert tracer.spans[-1].attributes["platform.answer.unsafe_claim_served"] is True

repeated = Tracer()
with repeated.start("agent.request"):
    for _ in range(2):
        with repeated.start("execute_tool lookup_deploy_status"):
            pass
assert [span.span_id for span in repeated.spans] == [0, 1, 2]
assert [span.parent_id for span in repeated.spans] == [None, 0, 0]
print(f"repeated_tool_spans={len(repeated.spans) - 1}")root=req_205
deploy-answer.request parent=None
retrieval deploy-policy parent=deploy-answer.request
chat deploy-assistant-prod parent=deploy-answer.request
serving_gate parent=deploy-answer.request
repeated_tool_spans=2The chat span carries the reviewed failure stage; the serving-gate span carries the escape. These attributes locate the observations without including the operator message. Parentage records execution structure, not proof that a parent caused a defect.
Why should retrieval, generation, and the serving gate share one root request trace?
Answer
The tree preserves instrumented execution relationships. An operator can find the retrieval, model call, and gate observations for the same request. These links guide investigation; they do not prove which operation caused the bad answer.
Keep standard telemetry and product decisions together
Standard fields identify the model operation. On an inference span, gen_ai.operation.name and gen_ai.provider.name are required. gen_ai.request.model is required when the model ID is available. This synthetic service uses a custom provider because no real vendor is involved. Use a well-known provider value when one applies.[5]
Product fields answer different questions: which evidence version supported the answer, whether the route blocked a claim, where the first failure was observed, and which protection boundary leaked it. Keep those custom attributes beside standard telemetry.
Prompt, output-message, and system-instruction attributes are opt-in in OTel because they may contain sensitive content. Store stable identifiers and safe outcomes by default; raw text capture needs deliberate governance.[5]
The current revision also defines gen_ai.prompt.name and gen_ai.prompt.version when a named, versioned prompt is used.[5] Here a host-owned registry supplies those values. The builder omits input messages, output messages, and system instructions, and leaves the unsafe-serve verdict unset when review is pending. Stable-looking IDs still need an approved source; an arbitrary string field can carry sensitive text.
PROMPTS = MappingProxyType({
    "deploy-answerer-v1": ("deploy-answerer", "v1"),
    "deploy-answerer-v1.1-regression": ("deploy-answerer", "v1.1-regression"),
})

def trace_attributes(event: TraceEvent) -> dict[str, str | int | bool]:
    if event.prompt_template_id not in PROMPTS:
        raise ValueError("prompt ID is absent from the host registry")
    prompt_name, prompt_version = PROMPTS[event.prompt_template_id]
    attributes: dict[str, str | int | bool] = {
        "gen_ai.operation.name": "chat",
        "gen_ai.provider.name": "platform.internal",
        "gen_ai.request.model": "deploy-assistant-prod",
        "gen_ai.request.stream": True,
        "gen_ai.prompt.name": prompt_name,
        "gen_ai.prompt.version": prompt_version,
        "gen_ai.usage.input_tokens": event.input_tokens,
        "gen_ai.usage.cache_read.input_tokens": event.cached_input_tokens,
        "gen_ai.usage.output_tokens": event.output_tokens,
        "platform.answer.route": event.route,
        "platform.answer.reviewed": event.unsafe_claim_served is not None,
        "platform.answer.substantive_output_served": event.substantive_output_served,
        "platform.failure.stage": event.first_failed_stage,
        "platform.prompt.template_id": event.prompt_template_id,
    }
    if event.unsafe_claim_served is not None:
        attributes["platform.answer.unsafe_claim_served"] = event.unsafe_claim_served
    if event.evidence_version is not None:
        attributes["platform.evidence.version"] = event.evidence_version
    if event.escape_stage is not None:
        attributes["platform.failure.escape_stage"] = event.escape_stage
    return attributes

unsafe_attributes = trace_attributes(current_window[-1])
print(f"operation={unsafe_attributes['gen_ai.operation.name']}")
print(f"template={unsafe_attributes['platform.prompt.template_id']}")
print(f"failed_stage={unsafe_attributes['platform.failure.stage']}")
print(f"escape_stage={unsafe_attributes['platform.failure.escape_stage']}")
print(f"cached_input_tokens={unsafe_attributes['gen_ai.usage.cache_read.input_tokens']}")
print(f"raw_messages_logged={'gen_ai.input.messages' in unsafe_attributes}")

assert unsafe_attributes["platform.answer.unsafe_claim_served"] is True
assert unsafe_attributes["platform.failure.escape_stage"] == "serving_gate"
assert unsafe_attributes["gen_ai.provider.name"] == "platform.internal"
assert unsafe_attributes["gen_ai.usage.cache_read.input_tokens"] == 80
assert unsafe_attributes["gen_ai.prompt.version"] == "v1.1-regression"
assert "gen_ai.input.messages" not in unsafe_attributes
assert "gen_ai.output.messages" not in unsafe_attributes
assert "gen_ai.system_instructions" not in unsafe_attributesoperation=chat
template=deploy-answerer-v1.1-regression
failed_stage=claim_generation
escape_stage=serving_gate
cached_input_tokens=80
raw_messages_logged=Falsegen_ai.* attributes identify the model call and named prompt. platform.* attributes describe the product decision. Neither requires copying the operator's message into the trace. Total input includes cached input; breakdowns are subsets, not additional tokens. Keep billed and visible-token counts separate when providers report different boundaries.[7]
Attribute cost with a versioned rate card
Store usage counts on the trace, then evaluate them with a versioned rate card. These synthetic USD rates price total input as uncached plus cache-read input. Normalize provider usage to that convention first: OTel's total input count includes cached input.[7] Cache writes, reasoning tokens, tools, batch discounts, and service tiers may require other categories. This estimate isn't an invoice.
For req_206, 201 total input tokens minus 80 cached leaves 121 uncached. At these fixture rates, the estimate is $0.000279. A deliberately malformed copy reports more cached tokens than total input and must be rejected.
def require_nonnegative_number(value: object, name: str) -> None:
    if type(value) not in (int, float):
        raise ValueError(f"{name} must be a finite non-negative number")
    try:
        valid = math.isfinite(value) and value >= 0
    except OverflowError:
        valid = False
    if not valid:
        raise ValueError(f"{name} must be a finite non-negative number")

@dataclass(frozen=True)
class RateCard:
    version: str
    input_per_million: float
    cached_input_per_million: float
    output_per_million: float

    def __post_init__(self) -> None:
        require_text(self.version, "rate-card version")
        for name in ("input_per_million", "cached_input_per_million", "output_per_million"):
            require_nonnegative_number(getattr(self, name), name)

def estimate_cost(event: TraceEvent, card: RateCard) -> float:
    if any(type(value) is not int or value < 0 for value in (
        event.input_tokens, event.cached_input_tokens, event.output_tokens
    )):
        raise ValueError("token counts must be non-negative integers")
    if not 0 <= event.cached_input_tokens <= event.input_tokens:
        raise ValueError("cached_input_tokens must be between 0 and input_tokens")
    uncached_input = event.input_tokens - event.cached_input_tokens
    try:
        estimate = (
            uncached_input * card.input_per_million
            + event.cached_input_tokens * card.cached_input_per_million
            + event.output_tokens * card.output_per_million
        ) / 1_000_000
    except OverflowError as error:
        raise ValueError("usage exceeds the monitoring estimate's numeric range") from error
    require_nonnegative_number(estimate, "estimated cost")
    return estimate

card = RateCard(
    version="internal-fixture-2026-05-27",
    input_per_million=1.00,
    cached_input_per_million=0.10,
    output_per_million=5.00,
)
cost_by_request = {
    event.request_id: estimate_cost(event, card)
    for event in current_window
}
total_cost = sum(cost_by_request.values())
malformed_usage = replace(current_window[-1], cached_input_tokens=202)

print(f"rate_card={card.version}")
print(f"window_cost_usd={total_cost:.6f}")
print(f"req_206_cost_usd={cost_by_request['req_206']:.6f}")
try:
    estimate_cost(malformed_usage, card)
except ValueError as error:
    print(f"invalid_usage={error}")
else:
    raise AssertionError("malformed usage event should fail")

assert card.version.startswith("internal-fixture")
assert total_cost > 0rate_card=internal-fixture-2026-05-27
window_cost_usd=0.001427
req_206_cost_usd=0.000279
invalid_usage=cached_input_tokens must be between 0 and input_tokensVersioning separates observation from repricing. Old traces retain usage while the rate-card version explains the estimate. Reject impossible counters rather than clamping them. Float arithmetic is sufficient for this monitoring example; billing needs an explicit decimal precision and rounding policy.
Store durable debugging evidence without operator text
A trace may contain an incident identifier, email address, or full operator request. That context can help solve today's incident, but it shouldn't become the default long-lived record.
For this workflow, durable logs can retain:
| Retain by default | Avoid by default |
|---|---|
| Request ID, evidence version, prompt template ID | Full operator message |
| Route, first failure stage, escape stage, claim-verdict counts | Full generated answer |
| Token counts, latency, rate-card version | Unredacted incident or contact details |
| Approved operational identifiers | Raw retrieved documents and free-text previews |
The record below accepts only a structured event and excludes dedicated payload fields. That reduces collection, but it does not sanitize arbitrary strings placed in an ID. An approved metadata source must supply those fields. IDs can identify people or sensitive incidents, so they still need access controls and retention limits. The record retains artifact identifiers, not artifact contents.
@dataclass(frozen=True)
class DurableRecord:
    request_id: str
    prompt_template_id: str
    evidence_version: str | None
    route: str
    failed_stage: str
    escape_stage: str | None
    raw_payload_ref: str | None
    collection_policy: str

def durable_record(event: TraceEvent) -> DurableRecord:
    return DurableRecord(
        request_id=event.request_id,
        prompt_template_id=event.prompt_template_id,
        evidence_version=event.evidence_version,
        route=event.route,
        failed_stage=event.first_failed_stage,
        escape_stage=event.escape_stage,
        raw_payload_ref=None,
        collection_policy="structured-only-v1",
    )

record = durable_record(current_window[-1])
print(f"request_id={record.request_id}")
print(f"raw_payload_stored={record.raw_payload_ref is not None}")
print(f"collection_policy={record.collection_policy}")
print(f"escape_stage={record.escape_stage}")

assert record.raw_payload_ref is Nonerequest_id=req_206
raw_payload_stored=False
collection_policy=structured-only-v1
escape_stage=serving_gateRedacting emails and incident numbers doesn't remove passwords, customer details, or sensitive meaning from arbitrary text. Prefer not collecting that text. Review what instrumentation libraries emit and apply Collector processors or an equivalent allowlist before export. Scrubbing downstream doesn't undo earlier copies in buffers or debug logs.[8]
If an investigation genuinely needs payload capture, define authorization, scope, expiry, storage isolation, and deletion before enabling it. A sample rate isn't permission to collect sensitive data. Versions help find the original artifacts only while authorized access and retention still permit it; they don't recreate missing source content.
Alert on decisions engineers can act on
Not every metric deserves a page. A long answer or higher cost might warrant investigation. Under this service's policy, a detected unsupported deploy claim that escaped the gate requires a page.
Thresholds belong to a service-level objective (SLO) or another owned service contract, not a generic article. This lab's synthetic policy says:
- Any unsafe served deploy claim is a page.
- TTFT above 500 ms is a warning for this interactive answer path.
- Estimated cost above the fixture budget is a warning, using the rate card named in the event window.
The evaluator computes quality, latency, and cost from the same events and named rate card. It also checks the independent ingress count. Two unsafe serves produce one policy finding; p95 TTFT is below 500 ms and estimated window cost is below $0.002. This code prints findings; it doesn't contact a paging service.
@dataclass(frozen=True)
class MonitorPolicy:
    policy_id: str
    max_unsafe_serves: int
    max_p95_ttft_ms: int
    max_window_cost_usd: float

    def __post_init__(self) -> None:
        require_text(self.policy_id, "policy ID")
        for name in ("max_unsafe_serves", "max_p95_ttft_ms"):
            value = getattr(self, name)
            if type(value) is not int or value < 0:
                raise ValueError(f"{name} must be a non-negative integer")
        require_nonnegative_number(self.max_window_cost_usd, "cost budget")

def evaluate_alerts(
    events: list[TraceEvent],
    rate_card: RateCard,
    policy: MonitorPolicy,
    ingress_request_count: int,
) -> list[str]:
    quality = quality_window(events, ingress_request_count)
    if not events:
        return ["UNKNOWN no request observations"]
    findings: list[str] = []
    if quality.unsafe_serves > policy.max_unsafe_serves:
        findings.append(
            f"PAGE unsafe_claim_served={quality.unsafe_serves}/{quality.requests}"
        )
    try:
        p95 = nearest_rank_percentile([event.ttft_ms for event in events], 0.95)
    except ValueError:
        findings.append("UNKNOWN invalid_latency_telemetry")
    else:
        if p95 > policy.max_p95_ttft_ms:
            findings.append(f"WARN p95_ttft_ms={p95}")
    try:
        cost_usd = sum(estimate_cost(event, rate_card) for event in events)
        require_nonnegative_number(cost_usd, "observed window cost")
    except ValueError:
        findings.append("UNKNOWN invalid_usage_telemetry")
    else:
        if cost_usd > policy.max_window_cost_usd:
            findings.append(f"WARN window_cost_usd={cost_usd:.6f}")
    if quality.observed < quality.requests:
        findings.append(f"UNKNOWN missing_request_events={quality.requests - quality.observed}")
    if quality.reviewed < quality.observed:
        findings.append(f"UNKNOWN unreviewed_requests={quality.observed - quality.reviewed}")
    return findings

policy = MonitorPolicy(
    policy_id="deploy-grounding-slo-v1",
    max_unsafe_serves=0,
    max_p95_ttft_ms=500,
    max_window_cost_usd=0.002,
)
findings = evaluate_alerts(current_window, card, policy, ingress_request_count)

for finding in findings:
    print(finding)
print(f"latency_warning={any('ttft' in item for item in findings)}")
print(f"cost_warning={any('cost' in item for item in findings)}")

assert findings == ["PAGE unsafe_claim_served=2/6"]PAGE unsafe_claim_served=2/6
latency_warning=False
cost_warning=FalseThe page finding names a broken invariant. UNKNOWN is a separate coverage signal. If one of six final events is absent, report the missing event even when all five received events are reviewed safe. Missing events also make latency and cost summaries incomplete; low observed cost doesn't establish that the full window stayed under budget. Reconcile window boundaries, ingress counters, and collector health. Production alerting systems can group repeated findings into an incident and route it to an owner and runbook.
Malformed usage or timing mustn't erase a known safety finding. The quality record can be valid even when another telemetry channel is broken. This copy of req_206 has impossible cached usage and a missing first-token delay: the evaluator still pages on the two reviewed unsafe answers, and reports both operational measurements as unknown.
broken_window = current_window[:-1] + [replace(current_window[-1],
    cached_input_tokens=202, ttft_ms=None)]
broken_findings = evaluate_alerts(broken_window, card, policy, ingress_request_count)
for finding in broken_findings:
    print(finding)
assert broken_findings == [
    "PAGE unsafe_claim_served=2/6",
    "UNKNOWN invalid_latency_telemetry",
    "UNKNOWN invalid_usage_telemetry",
]PAGE unsafe_claim_served=2/6
UNKNOWN invalid_latency_telemetry
UNKNOWN invalid_usage_telemetrySix synthetic requests demonstrate alert logic, not a production latency or cost budget. Set warning thresholds from representative traffic and revisit them as workload shape changes. Zero-tolerance safety invariants are different: a known unsupported deploy claim must not be served.
Root-cause triage: from metric anomalies to span exemplars
An unsafe-serve finding narrows the investigation. It doesn't determine an exact cause. Walk through this fixture:
- Read the denominator:
unsafe_claim_served=2/6means two of six reviewed requests leaked a claim. Among the three substantive answers actually served, two were unsafe. - Slice by version: All withholding in these rows occurs under
deploy-answerer-v1; both escapes occur underdeploy-answerer-v1.1-regression. This is an association in six supplied cases, not proof that a prompt edit caused the escapes. - Inspect a violating exemplar: For
req_205, the chat span carriesfirst_failed_stage='claim_generation'and the gate span carriesescape_stage='serving_gate'. Those annotations separate a defective draft from failed containment. They don't explain the gate's internal mechanism. - Compare retained artifacts: Inspect authorized prompt, source, and gate artifacts. A production reproduction also needs gate configuration, service and model versions, evaluator version, and relevant inputs. This minimal fixture doesn't include them all.
- Contain and verify: Disable the affected path or revert to a previously validated configuration according to the runbook. Check that containment works after the change; a rollback label alone doesn't establish safety. Then evaluate a candidate fix.
For an invariant page, attach one violating trace with its template and source versions, then state an immediate check. The exemplar is selected to investigate the violation; it isn't a representative traffic sample.
@dataclass(frozen=True)
class IncidentCard:
    policy_id: str
    summary: str
    exemplar_request_id: str
    template_id: str
    evidence_version: str | None
    first_failed_stage: str
    escape_stage: str | None
    first_check: str

def incident_card(events: list[TraceEvent], policy: MonitorPolicy) -> IncidentCard | None:
    exemplar = next((event for event in events if event.unsafe_claim_served is True), None)
    if exemplar is None:
        return None
    return IncidentCard(
        policy_id=policy.policy_id,
        summary="Unsupported deploy claim reached operator response.",
        exemplar_request_id=exemplar.request_id,
        template_id=exemplar.prompt_template_id,
        evidence_version=exemplar.evidence_version,
        first_failed_stage=exemplar.first_failed_stage,
        escape_stage=exemplar.escape_stage,
        first_check="Compare serving-gate template with deploy-answerer-v1.",
    )

card_view = incident_card(current_window, policy)
assert card_view is not None
print(f"exemplar={card_view.exemplar_request_id}")
print(f"template={card_view.template_id}")
print(f"first_stage={card_view.first_failed_stage}")
print(f"escape_stage={card_view.escape_stage}")
print(f"first_check={card_view.first_check}")

assert card_view.first_failed_stage == "claim_generation"
assert card_view.escape_stage == "serving_gate"exemplar=req_205
template=deploy-answerer-v1.1-regression
first_stage=claim_generation
escape_stage=serving_gate
first_check=Compare serving-gate template with deploy-answerer-v1.The first investigation is specific: compare the template and gate configuration with the strict version that abstained on the same case. A validated rollback can be a containment step while the team investigates the cause.
An alert says only grounding_rate < 95%. What evidence makes it actionable?
Answer
Attach a representative trace or exemplar, affected version and slice, threshold history, and a first investigation step. Every alert should enable a concrete engineering decision and name the evidence behind it.
Distributed tracing in multi-agent trajectories and tool loops
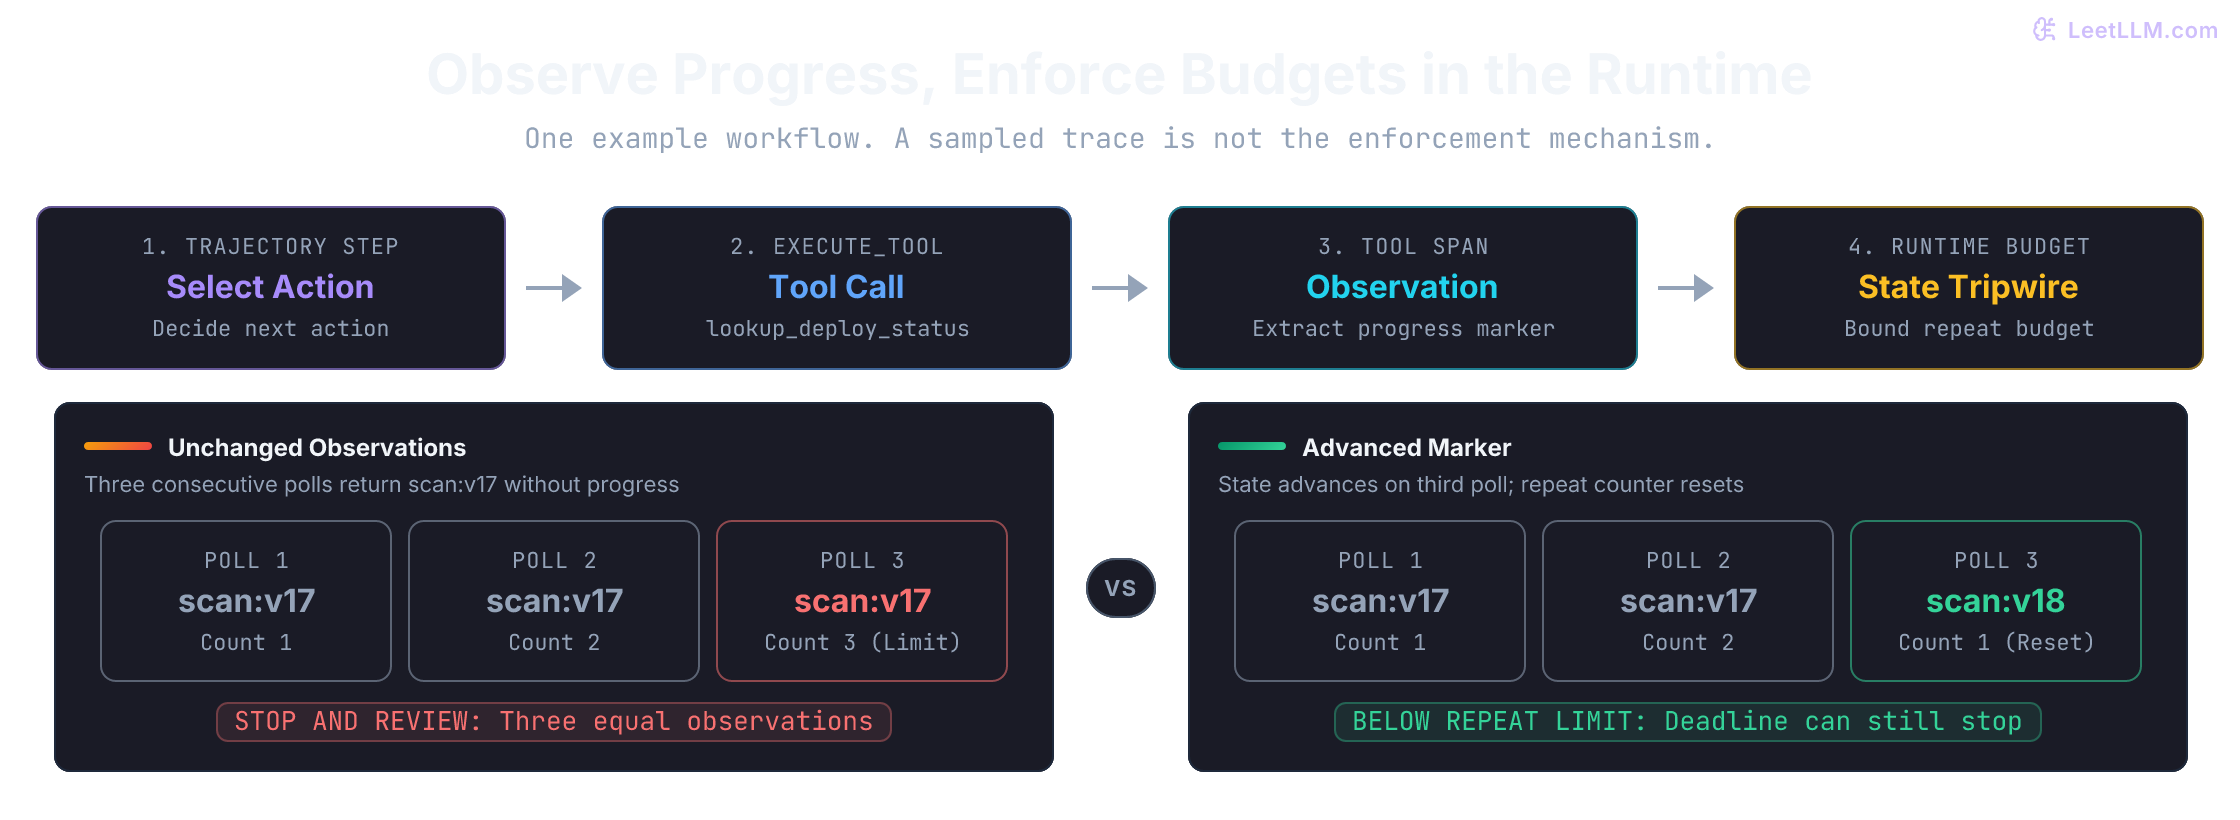
Tool-using workflows can take several model and tool steps. One useful runtime model has four phases; agent frameworks may organize them differently:
- Select an action: The application records the chosen action without needing hidden reasoning text.
- Tool execution (
execute_tool): The agent dispatches a structured call to an external tool or sub-agent.[5] - Observation: The tool executes and injects its result back into the agent's context window.
- State evaluation and reflection: The agent inspects the observation to decide whether the task is complete or if another tool call is needed.
Instrument model and tool operations and propagate their context. The GenAI conventions recommend execute_tool {gen_ai.tool.name} as the tool span name, with a tool call ID when available and an error type for failures. A missing tool ID is not permission to merge distinct calls.[5]
Tool arguments and results are opt-in because they can carry secrets. Here an opaque operation key distinguishes the deployment being polled without copying its arguments. A shared redaction placeholder wouldn't distinguish two deployments; an ordinary hash of a guessable value wouldn't make it private. Keep approved tool names, result status, progress markers, repeat counts, and stop reasons. Don't depend on hidden reasoning text.
An unbounded loop can keep spending without completing work. Input-token totals grow quadratically only under particular assumptions: each of N model calls resends the full history, starting at L₀ tokens and adding a fixed g tokens after each call. Summing L₀, L₀ + g, …, L₀ + (N - 1)g gives NL₀ + gN(N - 1)/2. For L₀=100, g=20, four calls send 520 input tokens; eight send 1,360. Capping history at 120 instead gives 460 and 940. These are logical input counts, not dollar estimates: prefix caching can change recomputation and prices, while truncation or compaction changes the history. A repeated tool call without another model call doesn't incur that model-input series.
Polling can legitimately return the same state twice. Define a bound instead of pretending to diagnose intent: this fixture stops after three consecutive observations of the same tool, operation key, and progress marker. A changed marker resets the count. Real pollers also need backoff and an elapsed-time deadline; a fast loop mustn't exhaust a budget intended for a slow deployment.
@dataclass(frozen=True)
class ToolStep:
    tool_name: str
    operation_key: str
    progress_marker: str

    def __post_init__(self) -> None:
        for name in ("tool_name", "operation_key", "progress_marker"):
            require_text(getattr(self, name), name)

def repeat_budget_exhausted(steps: list[ToolStep], max_same_state: int = 3) -> bool:
    if type(steps) not in (list, tuple) or any(type(step) is not ToolStep for step in steps):
        raise ValueError("steps must be a sequence of validated ToolStep records")
    if type(max_same_state) is not int or max_same_state < 2:
        raise ValueError("max_same_state must be an integer of at least 2")
    if not steps:
        return False
    same_state = 0
    for step in reversed(steps):
        if step != steps[-1]:
            break
        same_state += 1
    return same_state >= max_same_state

steps = [
    ToolStep("lookup_deploy_status", "operation-42", "scan:v17"),
    ToolStep("lookup_deploy_status", "operation-42", "scan:v17"),
    ToolStep("lookup_deploy_status", "operation-42", "scan:v17"),
]

print(f"tool={steps[-1].tool_name}")
print(f"repeat_budget_exhausted={repeat_budget_exhausted(steps)}")
print("route=stop_and_review" if repeat_budget_exhausted(steps) else "route=continue")

assert repeat_budget_exhausted(steps[:2]) is False
assert repeat_budget_exhausted(steps) is True
assert repeat_budget_exhausted(steps + [replace(steps[-1], progress_marker="scan:v18")]) is Falsetool=lookup_deploy_status
repeat_budget_exhausted=True
route=stop_and_reviewThe helper above returns a budget decision; the example prints a route. An actual runtime must enforce that decision before another tool call, independently of trace sampling, and enforce its deadline and other resource limits too.
Preserve the evidence for experiment tracking
An alert reports an observed policy violation or incomplete evidence. Here the outcomes are supplied fixture labels. Neither logs nor span nesting establish answer truth by themselves. Evaluating a candidate fix requires a controlled experiment linking the failing window, candidate, policy, evaluator, and rerun results.
@dataclass(frozen=True)
class ExperimentHandoff:
    incident_policy_id: str
    failing_template_id: str
    exemplar_request_id: str
    evidence_version: str | None
    candidate_template_id: str
    required_metric: str
    promotion_status: str

handoff = ExperimentHandoff(
    incident_policy_id=card_view.policy_id,
    failing_template_id=card_view.template_id,
    exemplar_request_id=card_view.exemplar_request_id,
    evidence_version=card_view.evidence_version,
    candidate_template_id="deploy-answerer-v1.2-fix",
    required_metric="zero unsafe claims; complete review; retained clean-case usefulness",
    promotion_status="BLOCKED_PENDING_EVALUATION",
)

print(f"candidate={handoff.candidate_template_id}")
print(f"required_metric={handoff.required_metric}")
print(f"promotion={handoff.promotion_status}")

assert handoff.promotion_status == "BLOCKED_PENDING_EVALUATION"candidate=deploy-answerer-v1.2-fix
required_metric=zero unsafe claims; complete review; retained clean-case usefulness
promotion=BLOCKED_PENDING_EVALUATIONMonitoring supplies a starting point for a controlled run. Specify usefulness thresholds before tuning: abstaining on every clean request would avoid unsafe claims while breaking the service's purpose. Require complete review and safety checks on the regression cases, then evaluate a separate representative holdout. Zero observed failures in either finite set isn't a guarantee of future safety.
Keep the handoff small: incident policy, failing template, exemplar request, evidence version, candidate, and required safety metric. Experiment tracking can consume those identifiers without copying raw traces or inventing a new failure label.
Count before sampling traces
Trace volume, retention, and operational needs determine whether sampling is useful. Two common strategies decide at different points:[9]
- Head sampling: Decide early, before the complete outcome is known, and propagate that decision. A 5% baseline can reduce telemetry traffic and storage, but may discard a rare containment escape.
- Tail sampling: A stateful collector decides using received spans and attributes. It can favor detected errors and safety escapes, but it doesn't guarantee retaining every failure. All spans for a trace must reach the same collector instance; finite buffers, decision deadlines, late attributes, and earlier head drops limit what it can see.[10]
Suppose a quality label arrives 60 seconds after completion, but the collector decides after 10 seconds. A rule to keep unsafe traces cannot use the verdict it hasn't received. The current tail-sampling processor also offers different decision strategies; configure and measure the one deployed. Tail sampling doesn't require or guarantee a complete trace, and can't recover spans already discarded upstream.[10]
Neither technique turns an unobserved quality defect into a detected one.
| Signal class | Sampling habit | Why |
|---|---|---|
| Request counts, latency, detected violations | Compute before trace sampling | Sampled spans aren't the complete request population |
| Expensive quality evaluators | Keep a known-probability sample for rate estimates; separately oversample suspected failures for diagnosis | A failure-enriched sample has a different denominator |
| Sensitive payloads | Default off, even on retained traces | Sampling doesn't provide authorization or anonymization |
| Agent repeat budgets | Enforce in the runtime; export bounded state and stop counters | Stopping mustn't depend on whether a trace is retained |
For example, retaining both unsafe traces plus one of the four safe traces gives 2/3 unsafe in storage, while the complete window is 2/6. Don't put the first fraction on a dashboard labeled "all requests." Publish the sample policy, review coverage, evaluator version, and label delay beside any estimated quality rate.
The gate runs on every request in this example, but independent outcome review may lag or miss defects. An unsampled counter counts all detected violations only if its own collection path works. Monitor dropped telemetry, duplicate events, late labels, and missing outcomes. Keep high-cardinality request IDs in traces or exemplars rather than metric dimensions, and use bounded dimensions such as route and deployment version.
Only three of six requests have reviewed outcomes: two unsafe and one safe. The other three are unchecked. What quality rate and coverage should you report?
Answer
Report 2/3 unsafe among reviewed requests and 3/6 review coverage. The full-window unsafe rate is unknown: it could range from 2/6 to 5/6. A failure-enriched review sample doesn't estimate all-traffic quality without a valid sampling design.