Personalize this lesson
Adapt explanations and teaching visuals to your background and preferred voice.
Imagine an internal runbook assistant whose quantized download is 7.6 GB. It loads on a 24 GB GPU and answers a short question. Four engineers then submit long incident logs at once, and a request fails with out-of-memory (OOM). The download fitted. The workload did not.
That is a hypothetical incident, not a benchmark. Before diagnosing it, ask what else was allocated, on which device, and at what point in the request. Startup success alone answers none of those questions.
Our assistant retrieves authorized post-mortems and drafts rollback commands for human review. Credentials remain in the credential store rather than becoming retrieval documents. Organizational policy requires incident data to stay inside the approved network. If local inference fails, the fallback is approved local documentation or a human engineer, with no automatic public API failover.
Model Quantization explains weight compression. KV Cache and PagedAttention explains attention history. This lesson turns those mechanisms into a sizing worksheet, a placement check, and a deployment experiment you can reproduce on your own hardware.
Follow the bytes before counting the cores
Single-sequence dense-model decode often has low arithmetic intensity: a matrix must supply many weight bytes for one new token. Memory bandwidth can dominate. That is a workload-dependent bottleneck, not a law that all local inference is strictly bandwidth-bound. Batching reuses weights across sequences; attention, unpacking, launches, CPU work, and long contexts can change the limiting resource.
| Hardware | Where model data can live | Boundary to inspect |
|---|---|---|
| Discrete GPU | Device VRAM, with separate host RAM | Host/device transfers and the actual allocation/offload policy |
| Apple Silicon | Physical memory shared by CPU and GPU | Available Metal working memory, system pressure, and competing users of the bus |
| CPU | System RAM, possibly spread across NUMA nodes | Populated memory channels, sustained bandwidth, locality, and kernel support |
Discrete GPU: capacity and bandwidth are different limits
The GeForce RTX 4090 is a useful named example, rather than the current consumer flagship. NVIDIA specifies 24 GB GDDR6X, a 384-bit interface, and 1,008 GB/s peak memory bandwidth.[1] Peak bandwidth is not a measured decode rate. Four-bit stored weights also do not imply every multiplication uses native INT4 instructions: W4A16 kernels can unpack into floating-point arithmetic.
Host RAM does not become extra ordinary CUDA device memory just because the machine has plenty of it. A runtime can intentionally execute some layers on CPU, transfer data, or use a supported managed-memory path. An ordinary device allocation can instead fail. Establish which path your installed backend uses before explaining a slowdown.
Apple Silicon: shared storage still has a working-set limit
Unified memory lets CPU and GPU access the same physical memory pool without copying an array across a discrete GPU's PCIe link. Shared physical storage does not require identical CPU/GPU virtual addresses, eliminate synchronization, or make all installed RAM freely available to the model.
As checked September 22, 2026, Apple's Mac Studio specifications list M5 Max variants at 460 or 614 GB/s and M5 Ultra at 1.2 TB/s, with supported memory configurations reaching 128 GB and 512 GB respectively.[2] These are advertised hardware specifications. They establish neither a universal model-fit guarantee nor a token rate.
Include macOS, other applications, runtime caches, and the Metal working-set constraints in your budget. There is no universal rule that macOS reserves exactly 20–25%. In MLX, supported execution devices are CPU and GPU; the framework does not expose the Neural Engine as an execution device.[3][4] Evaluate MLX-LM against another compatible runner using the same artifact quality, prompt, and concurrency before claiming one is faster.
CPU: channels, locality, and workload shape
For a hypothetical dual-channel DDR5-5600 system, the transfer-rate calculation is before practical losses. Eight such channels give 358.4 GB/s theoretically. These are arithmetic examples, not limits shared by every EPYC or Xeon platform. Check the processor's supported channels, DIMM population, transfer rate, and NUMA placement.
More threads help until another resource dominates; they can also increase contention. Measure a thread-count sweep instead of prescribing a token rate from core count. A server with more sockets can have more aggregate bandwidth while a poorly placed process still accesses remote memory.
Assume one dense decode sequence reads 5 GB of weights per step and sustains 80 GB/s. A teammate predicts at most 16 tokens/s total even when eight sequences are batched. What did the prediction miss?
Answer
80 / 5 = 16 steps/s is a weight-stream ceiling for the single-sequence assumptions. A batched step can reuse those weights to produce one token for each of eight sequences, potentially increasing aggregate tokens/s. It also does more arithmetic and cache work, so neither 16 nor 128 tokens/s is a measured multi-user result. Test the required queueing, TTFT, and token-gap limits under the actual arrival pattern.
Build a budget for each memory pool
Estimate before downloading a large artifact, then replace estimates with measurements after loading it. For a particular device and a particular request phase:
The terms must refer to allocations that coexist. Do not sum unrelated peaks, count reserved allocator memory twice, or mix CPU RAM and GPU VRAM into one fictitious pool. For a split deployment, make separate host and device budgets. Unified-memory machines instead share a capacity constraint with the operating system.
| Term | What to record |
|---|---|
| Weights | Actual loaded tensor types, scales, preserved tensors, placement, and any separate multimodal components |
| Cache | Architecture, cache dtype, retained context, concurrent sequences, page rounding, sharing, and reserved capacity |
| Workspace | Prefill chunk size, attention backend, graph captures, temporary buffers, and peak coexistence |
| Other | Driver/runtime allocations, display and other processes, allocator overhead, and an explicit reserve |
Weight payload is a starting point
For uniformly stored weights at bits, the ideal payload is bytes. Real artifacts include grouping metadata and a mixture of tensor precisions. A dense array of zeros does not shrink just because someone calls it pruned; a sparse representation and compatible execution path are separate requirements.
Google's model card lists Gemma 4 12B Unified at 11.95B parameters.[5] Its hypothetical uniform 16-bit payload would be 23.9 decimal GB; four-bit codes alone would take 5.975 GB. The Ollama gemma4:12b listing checked September 22 shows a 7.6 GB artifact with Q4_K_M model data and a BF16 projector.[6] File size alone does not reveal the loaded device footprint or explain every byte of the difference. Preserve the exact local artifact identity, because the tag can change.
Cache arithmetic: read the architecture, not just “12B”
For homogeneous full-attention layers with separate key/value buffers:
is the KV-head count, the configured head width, retained tokens per sequence, concurrent sequences, and bytes per scalar. Do not automatically derive as hidden width divided by query-head count; architectures can use a different projection width. Sum layer types separately when dimensions differ. This formula excludes page rounding, quantization metadata, temporary updates, and reserved-but-unused cache space.
A hypothetical 32-layer model with eight KV heads of width 128 and two-byte scalars needs bytes per retained token, or 128 KiB. At 4,096 tokens that is 0.5 GiB (536.9 decimal MB). At 32,768 tokens across four sequences it is 16 GiB (17.18 decimal GB), before workspace.
Caching avoids recomputing the old prefix's states. Full-attention decode still reads history and its attention work grows with retained length. Re-evaluating a whole full-attention prefix would instead include quadratic attention work in that prefix. Cache projection work alone is not quadratic.
Gemma 4 12B's inspected text configuration has 40 sliding layers with eight KV heads of width 256 and a 1,024-token window, plus eight full layers with one KV head of width 512.[7] It also enables shared K/V projection in global layers. That does not automatically mean one physical cache array: the inspected Transformers implementation separately normalizes/transforms key and value states and updates both in the cache.[8]
For a worksheet assuming separate 16-bit K/V arrays and retention capped at 1,024 tokens in sliding layers, four 16,384-token sequences require:
- Sliding payload: .
- Full payload: .
- Combined raw payload: 2.416 GB.
If the runtime stores full-length buffers for the sliding layers, the same two-array calculation gives 22.549 GB. Keeping those buffers is not, by itself, an attention-correctness bug: the attention mask can still enforce the sliding window. A runtime may reserve full buffers by design. Verify storage behavior separately from the mathematical attention pattern.
Workspace and reserve are inputs to the experiment
Memory-efficient attention avoids materializing the full quadratic score matrix. It does not provide a universal 1.5–2.5 GB prefill workspace bound. Prefill chunks, logits, graph captures, kernel workspaces, model dimensions, and concurrency all matter.
Likewise, display and CUDA context costs are not fixed constants across machines. Measure free device memory and other processes, then capture the server's peak under the intended request shape. A chosen 20% reserve is a planning assumption, not a guarantee against OOM or a substitute for those measurements.
A worksheet that makes its assumptions visible
This CPU exercise uses the Gemma layer dimensions above, a 7.6 GB weight proxy, an assumed 2 GB working allocation, and a 20% reserve on a hypothetical 24 GB device. It predicts no measured runtime allocations. evict=False changes storage retention; it does not change the model's attention semantics.
1def positive_int(value, name):
2    if type(value) is not int or value <= 0:
3        raise ValueError(f"{name} must be a positive integer")
4    return value
5
6def kv_bytes(layers, heads, width, tokens, sequences, bytes_per_value=2):
7    dims = (layers, heads, width, tokens, sequences, bytes_per_value)
8    for name, value in zip(
9        ("layers", "heads", "width", "tokens", "sequences", "bytes_per_value"), dims
10    ):
11        positive_int(value, name)
12    return 2 * layers * heads * width * tokens * sequences * bytes_per_value
13
14def gemma_cache_gb(tokens, sequences, evict=True):
15    positive_int(tokens, "tokens")
16    positive_int(sequences, "sequences")
17    if type(evict) is not bool:
18        raise ValueError("evict must be a boolean")
19    sliding_tokens = min(tokens, 1024) if evict else tokens
20    sliding = kv_bytes(40, 8, 256, sliding_tokens, sequences)
21    full = kv_bytes(8, 1, 512, tokens, sequences)
22    return (sliding + full) / 1e9
23
24weight_proxy_gb = 7.6
25working_gb = 2.0
26capacity_gb = 24.0
27reserve_fraction = 0.20
28usable_gb = capacity_gb * (1 - reserve_fraction)
29
30print(f"Assumed planning limit (80% of {capacity_gb} GB): {usable_gb:.2f} GB\n")
31
32for tokens, sequences, evict in (
33    (16384, 4, True),
34    (32768, 4, True),
35    (16384, 8, True),
36    (16384, 4, False),
37):
38    cache = gemma_cache_gb(tokens, sequences, evict)
39    total = weight_proxy_gb + working_gb + cache
40    fits = total <= usable_gb
41    print(f"Context={tokens:5d} Concurrency={sequences} Eviction={str(evict):5s} -> "
42          f"KV={cache:6.3f} GB, Total={total:6.3f} GB, Fits Modeled Limit={fits}")
43
44assert round(gemma_cache_gb(16384, 4), 3) == 2.416
45assert gemma_cache_gb(16384, 8) == 2 * gemma_cache_gb(16384, 4)
46assert gemma_cache_gb(32768, 4) < 2 * gemma_cache_gb(16384, 4)
47try:
48    gemma_cache_gb(16384, 4, evict=1)
49except ValueError:
50    pass
51else:
52 raise AssertionError("Ambiguous retention flag accepted")1Assumed planning limit (80% of 24.0 GB): 19.20 GB
2
3Context=16384 Concurrency=4 Eviction=True -> KV= 2.416 GB, Total=12.016 GB, Fits Modeled Limit=True
4Context=32768 Concurrency=4 Eviction=True -> KV= 3.490 GB, Total=13.090 GB, Fits Modeled Limit=True
5Context=16384 Concurrency=8 Eviction=True -> KV= 4.832 GB, Total=14.432 GB, Fits Modeled Limit=True
6Context=16384 Concurrency=4 Eviction=False -> KV=22.549 GB, Total=32.149 GB, Fits Modeled Limit=FalseDoubling context from 16K to 32K adds 1.074 GB under capped retention. Doubling concurrency doubles this raw cache, not the shared weights or every allocation in the process. Full-length sliding storage takes the modeled total to 32.149 GB, beyond the assumed device capacity. Whether the server rejects the configuration, preempts requests, offloads, or fails allocation depends on its implementation.
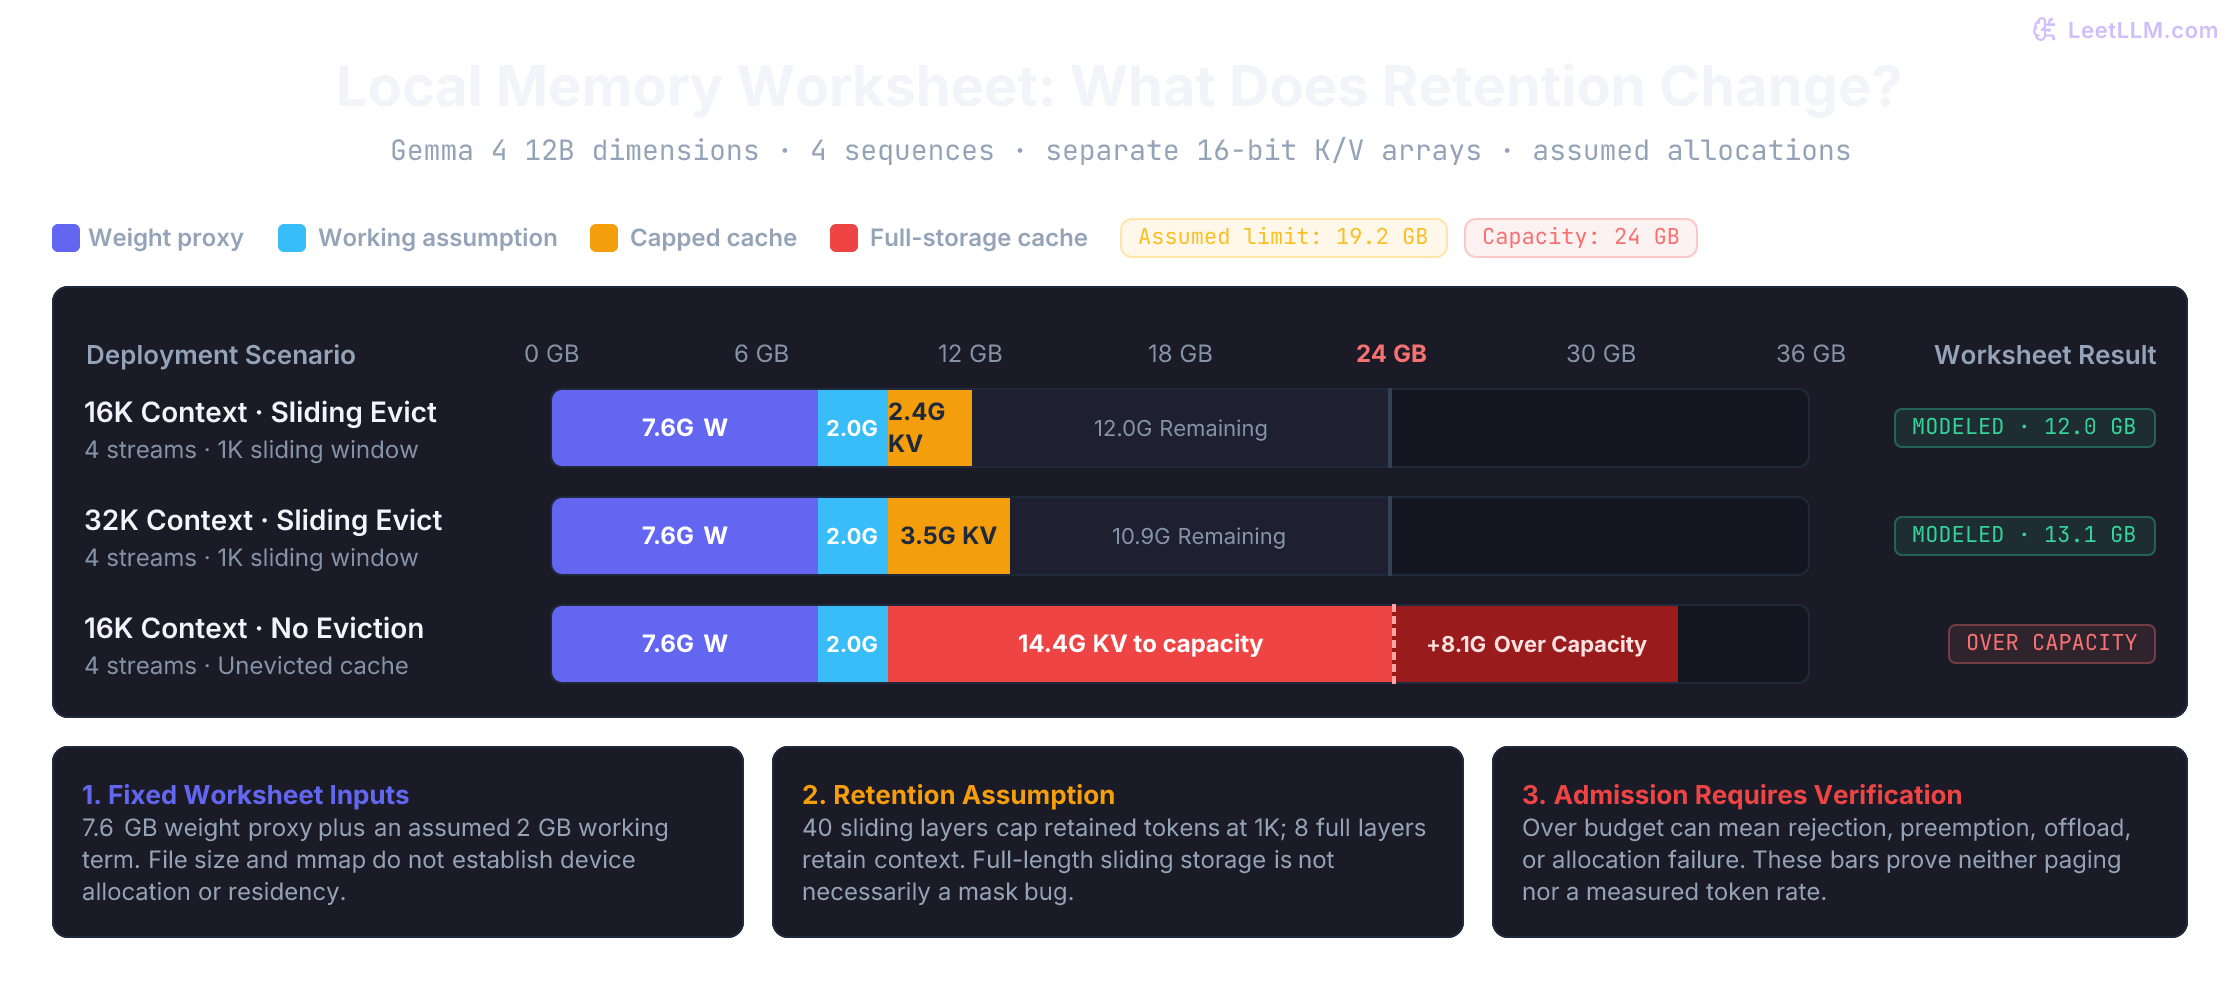
Try changing the worksheet: keep four sessions, reduce the assumed working term to 1 GB, and then remove the reserve. Does the full-storage case fit? It still exceeds 24 GB. Next, keep capped retention but double sessions: identify which terms need new measurements rather than multiplying the whole total by two.
Your worksheet predicts 11 GB on a 24 GB device, but a long request fails with CUDA OOM. Can display overhead alone explain the failure?
Answer
Not from those two numbers. Inspect the failed allocation, other processes, peak prefill workspace, configured/reserved cache capacity, graph pools, allocator state, and actual placement. The worksheet may omit a large buffer or a competing allocation. A nominal 13 GB cushion does not identify the missing term, and small generic overhead estimates cannot establish the cause.
Estimate block capacity, then verify the offload flag
llama.cpp supports CPU/GPU placement through -ngl and related controls.[9] A block left on CPU executes there using its supported backend; this differs from transferring its entire weight payload to GPU each token.
For a hypothetical model with equal-size blocks, assume every non-block allocation, including the output head at its intended placement, is already covered by . Then the block-capacity estimate is:
With 32 blocks totaling 9.6 GB and 3.2 GB fixed usage, a 16 GB modeled budget accommodates all 32 blocks. An 8 GB budget accommodates blocks, leaving the other 16 on CPU. Neither result includes a reserve unless one was included in the chosen budget.
Do not label that integer an exact, universally safe -ngl value. Hybrid blocks, MoE blocks, tensor overrides, cache placement, backend buffers, and precision mixtures can make block sizes unequal. Use actual tensor/suffix sizes and startup logs, then measure peak memory.
Flag semantics are versioned too. In the llama.cpp source inspected at commit 709fe755, the trailing offload range includes an output-layer slot. With 40 transformer blocks, -ngl 24 selects the last 23 blocks plus the output slot, before tensor/backend overrides. It does not mean 24 hidden blocks; input-layer assignment remains on CPU.[10] Check your installed version's help and allocation logs rather than copying counts from an older tutorial.
Allocation failure, offload, and paging are different events
A CUDA OOM message does not prove that weights first migrated through host RAM. Distinguish four paths:
| Path | What happens | Evidence to seek |
|---|---|---|
| Ordinary device allocation | cudaMalloc may fail with cudaErrorMemoryAllocation | Allocation error and pool/device-memory state |
| Explicit runtime offload | Chosen layers run on CPU, or the runtime deliberately transfers selected data | Backend placement logs and a transfer/CPU trace |
| Managed memory | Supported managed/system allocations can migrate or access host memory; oversubscription depends on platform capabilities | Allocation type, queried CUDA capabilities, and migration trace |
| Host memory pressure | Anonymous pages may swap if enabled; clean file-backed pages can be discarded and reread from the model file | Major faults, file I/O, swap activity, and resident working set |
NVIDIA's current guide distinguishes device-only allocation, managed memory, mapped host memory, HMM/ATS support, and limited-support platforms.[11][12] Ordinary cudaMalloc allocations do not acquire automatic oversubscription merely because Unified Memory exists.
mmap creates a virtual file mapping, not a promise that the file is resident. File-backed weight rereads are not necessarily swap reads. Nor does GPU cache growth automatically evict ordinary CUDA weight allocations into host RAM: a server can reject, preempt, or fail instead.
A transfer calculation you can falsify
Suppose one step must read a 7.6 GB payload. Ignore compute, attention, unpacking, and launch overhead. Use 1,008 GB/s as a peak device-memory scenario, assume 25 GB/s for a host-to-device path, and assume 5 GB/s for storage. These are serial weight-stream calculations, not a Gemma benchmark or a prediction of what your runtime migrates.
1weight_gb = 7.6
2vram_gbs = 1008.0
3transfer_gbs = 25.0
4storage_gbs = 5.0
5
6resident_s = weight_gb / vram_gbs
7mixed_s = 5.6 / vram_gbs + 2.0 / transfer_gbs
8host_s = weight_gb / transfer_gbs
9storage_s = weight_gb / storage_gbs
10
11for name, seconds in (
12    ("Device stream", resident_s),
13    ("5.6 GB device + 2 GB transfer", mixed_s),
14    ("All bytes over host link", host_s),
15    ("Storage read only", storage_s),
16):
17    print(f"{name}: {seconds*1000:.2f} ms, {1/seconds:.2f} steps/s")
18print(f"Mixed/device stream-time ratio: {mixed_s/resident_s:.2f}x")
19assert mixed_s > resident_s1Device stream: 7.54 ms, 132.63 steps/s
25.6 GB device + 2 GB transfer: 85.56 ms, 11.69 steps/s
3All bytes over host link: 304.00 ms, 3.29 steps/s
4Storage read only: 1520.00 ms, 0.66 steps/s
5Mixed/device stream-time ratio: 11.35xThe 11.35× ratio compares two modeled stream times with the same assumptions. It cannot be compared directly with an unrelated measured 50 tokens/s to claim a fivefold slowdown. CPU-executed layers have CPU compute and activation-boundary costs; overlapped transfer has another timing model; disk reads also need subsequent processing. Profile the path your server actually takes.
A server slows on long prompts while allocated VRAM is near capacity and host/device traffic increases. Is managed-memory weight paging proven?
Answer
No. Check the allocation type and migration trace. Explicit cache transfer, CPU offload, request preemption/recomputation, or other traffic can produce similar symptoms. Distinguish memory.used/total (capacity occupancy) from utilization.memory (memory activity); neither alone tells you which tensors moved.
Choose the runner by the workload it must pass
| Option | Role and model packaging | What to check before selecting it |
|---|---|---|
llama.cpp / llama-server | Native inference tools, commonly loading GGUF | Model/backend support, CPU/GPU split, cache settings, parallel serving, and driver/build dependencies |
| Ollama | Model manager and HTTP server; imports supported Safetensors or GGUF through a Modelfile | Model/backend compatibility, loaded placement, parallel slots, queue limits, cloud policy, and API subset |
| MLX-LM on MLX | Language-model tooling on Apple's array framework, commonly using Safetensors plus configuration | Supported architecture/quantization, task quality, CPU/GPU memory pressure, and serving needs |
| vLLM | Server/runtime with scheduling, paged cache, and distributed inference features | Supported hardware/model/kernel combination, installation environment, arrival-load SLOs, and parallelism costs |
GGUF is a tensor/metadata container, not “GPT-Generated Unified Format.” It can be sharded, and mapping it does not make startup instantaneous.[13] llama.cpp can run through native binaries without PyTorch/Python as the inference runtime, but its chosen backends still have dependencies. In the inspected CLI source, cache types include f16, bf16, q8_0, and q4_0; generic FP8 is not in that accepted list. Quantized cache carries metadata, has backend restrictions, and needs task evaluation.[14]
A Modelfile is configuration, not a weight serialization format. Ollama's import documentation covers supported Safetensors and GGUF inputs.[15][16] Its API compatibility covers a subset of OpenAI endpoints/features. A basic client can target http://localhost:11434/v1, but model names, supported fields, context settings, and conversation behavior still need checking. The placeholder API key used by some clients does not secure the unauthenticated local server.[17][18]
MLX is the array framework; MLX-LM supplies language-model tools. Its supported CPU/GPU operations share unified arrays, with dependencies scheduled between streams. There is no universal “MLX beats every Metal runner” result.[3][4]
vLLM's PagedAttention maps logical token blocks to cache blocks. These are not ordinary OS virtual-memory pages. Waste depends on block size, sequence lengths, sharing, and pool policy; “under 4%” is not a bound for every workload. It offers continuous batching and distributed serving, while Ollama and llama-server also support concurrent requests. Ollama documents parallel-request and queue controls, with memory implications.[19][20]
You have two GPUs and 30 technicians, but the quantized model fits on one GPU. Must you tensor-parallelize it across both?
Answer
No. Compare two independent replicas with one tensor-parallel instance, including cache capacity, queueing, TTFT, token gaps, and interconnect costs. vLLM is a candidate when its scheduling and distributed features meet the workload; concurrency alone neither requires tensor parallelism nor rules out another server. Test the selected model/backend rather than declaring a winner from user count.
Draw the private-data boundary
Local inference, on-premises hosting, and air-gapping are different properties. A localhost API can still forward a request to a cloud model. An on-premises server can have Internet access. An air gap requires an actual separation from external networks, with controlled artifact/update transfer.
1Authorized documents -> local retrieval -> approved local model -> reviewed draft
2                                           |
3                                           +-> approved local fallback on failure
4
5Credential store: outside model/retrieval input
6External model/search/tools: denied by policy and verified network controls
7Logs, backups, embeddings, and monitoring: included in the same data-flow review
Local hosting alone does not establish legal compliance. HIPAA permits cloud processing under applicable agreements, safeguards, and other HIPAA requirements; it is not a blanket cloud ban.[21] GDPR international-transfer rules likewise provide transfer mechanisms, including adequacy and appropriate safeguards.[22] Export controls and contractual restrictions require assessment of the particular data, recipients, and access arrangement. Do not replace that assessment with “commercial cloud is always prohibited.”
For the runbook assistant's stated internal-only policy:
- Disable Ollama cloud features.
OLLAMA_NO_CLOUD=1disables Ollama's cloud-model and web-search features after restart. It is not documented as a firewall, registry-download ban, or blanket telemetry switch.[20] - Control inbound access. Ollama defaults to loopback and its local API has no built-in authentication requirement. Loopback limits direct network access, but does not authenticate local processes or protect an exposed tunnel/proxy. Multi-user access needs an authenticating gateway and caller-scoped retrieval authorization.[18][20]
- Verify the entire outbound path. Apply and test appropriate network policy for the server, retrieval, tools, proxies, logs, and monitoring. Generated
curltext is not execution; a tool runner creates that boundary. Egress restrictions reduce permitted destinations but do not stop every leak through allowed peers, local files, or logs. - Exercise failure behavior. Stop the model worker in a controlled test and submit an unavailable-runbook case. Require an explicit local fallback and no external forwarding. A model's self-reported confidence is not sufficient evidence of correctness.
Inspect placement and measure what users receive
Start with a downloaded, approved artifact and a running local server. The commands below inspect the installation; their output depends on your machine.
1set -euo pipefail
2ollama --version
3curl --fail --silent --show-error --max-time 10 \
4  http://127.0.0.1:11434/api/tags > local-models.json
5curl --fail --silent --show-error --max-time 10 \
6  http://127.0.0.1:11434/api/ps > loaded-models.json
7ollama ps
/api/tags is inventory. /api/ps lists loaded models and reported size, VRAM size, digest, and context length.[23] The CLI's PROCESSOR column summarizes CPU/GPU placement. 100% GPU is not a guarantee that every operation runs on Tensor Cores, that peak memory fits, or that latency is acceptable. Percentages are not an exact hidden-layer count.[20]
Separate the server's timings from client latency
This native Ollama request fixes the context and output caps. Use a locally approved model; the registry tag here is a reproducible request example, not an immutable production identity.[24]
1curl --fail --silent --show-error --max-time 300 \
2  --write-out 'client_total_seconds=%{time_total}\n' \
3  http://127.0.0.1:11434/api/generate \
4  -H 'Content-Type: application/json' \
5  -d '{
6    "model": "gemma4:12b",
7    "prompt": "Explain why model file size alone cannot predict peak inference memory.",
8    "stream": false,
9    "options": {"num_ctx": 4096, "num_predict": 128, "temperature": 0}
10  }' \
11  -o local-response.json
12ollama ps
Ollama reports timing fields in nanoseconds. Current usage documentation distinguishes total prompt tokens, cached prompt tokens, uncached-prompt evaluation duration, and output generation count/duration.[25] Dividing all prompt tokens by the uncached duration can overstate prefill performance. Reported generation counts should not be assumed to count only visible final-answer text; record thinking mode too. Earlier server versions can differ, so preserve the runtime version and actual receipt.
The helper below uses synthetic receipts, not a model run. Save it as read-generation-timing.py; passing your JSON filename prints its rates. Missing metrics and zero durations produce an unavailable rate, rather than an invented one-nanosecond duration or division by zero.
1import json
2import sys
3
4def metric(response, key):
5    value = response.get(key)
6    if value is not None and (type(value) is not int or value < 0):
7        raise ValueError(f"{key} must be a nonnegative integer")
8    return value
9
10def rate(count, duration_ns):
11    if count is None or duration_ns is None or count == 0 or duration_ns == 0:
12        return None
13    return count * 1e9 / duration_ns
14
15def generation_rates(response):
16    if response.get("done") is not True:
17        raise ValueError("A completed response is required")
18    prompt = metric(response, "prompt_eval_count")
19    cached = metric(response, "prompt_eval_cached_count")
20    prompt_ns = metric(response, "prompt_eval_duration")
21    output = metric(response, "eval_count")
22    output_ns = metric(response, "eval_duration")
23    if prompt is not None and cached is not None and cached > prompt:
24        raise ValueError("Cached prompt count exceeds prompt count")
25    uncached = prompt - cached if prompt is not None and cached is not None else None
26    return {
27        "uncached_prompt_tokens_per_second": rate(uncached, prompt_ns),
28        "output_tokens_per_second": rate(output, output_ns),
29    }
30
31if len(sys.argv) == 2:
32    with open(sys.argv[1], encoding="utf-8") as f:
33        print(json.dumps(generation_rates(json.load(f)), indent=2))
34else:
35    example = {
36        "done": True,
37        "prompt_eval_count": 1000,
38        "prompt_eval_cached_count": 600,
39        "prompt_eval_duration": 200_000_000,
40        "eval_count": 80,
41        "eval_duration": 2_000_000_000,
42    }
43    result = generation_rates(example)
44    print(f"Uncached prompt: {result['uncached_prompt_tokens_per_second']:.1f} tok/s")
45    print(f"Output: {result['output_tokens_per_second']:.1f} tok/s")
46    print("Zero duration:", generation_rates({"done": True, "eval_count": 80, "eval_duration": 0})
47          ["output_tokens_per_second"])
48    print("Missing duration:", generation_rates({"done": True, "eval_count": 80})
49          ["output_tokens_per_second"])
50    assert result["uncached_prompt_tokens_per_second"] == 2000.0
51    for key, value in (("eval_duration", True), ("prompt_eval_cached_count", 1001)):
52        invalid = dict(example, **{key: value})
53        try:
54            generation_rates(invalid)
55        except ValueError:
56            pass
57        else:
58 raise AssertionError("Invalid timing receipt accepted")1Uncached prompt: 2000.0 tok/s
2Output: 40.0 tok/s
3Zero duration: None
4Missing duration: NoneRun python3 read-generation-timing.py local-response.json after the request. JSON null means the rate cannot be computed under this contract. A missing cached-count field does not justify guessing a cache hit count.
Those rates do not measure time to first token (TTFT) or individual token gaps. For those, enable streaming and record client arrival timestamps, stating whether the first thinking/content token or first chunk defines TTFT. Transport buffering can group tokens. Also measure client completion time, queueing, cold versus warm loads, cache reuse, peak memory, and failures under the intended arrival load. Report rate distributions with the workload and measurement boundaries; one successful short request is not a concurrency benchmark.
Keep the case identities when comparing quantization
A model that fits is still unsuitable if it corrupts a rollback flag. Run baseline and candidate on the same prompts, retrieved context, templates, and declared decoding policy. Keep per-case outputs and task-specific checks, not just one aggregate score. Repeated trials help distinguish a systematic change from sampling variation; a fixed seed does not guarantee identical results across implementations.
These are invented pass/fail outcomes showing the accounting problem. The fixture executes no language model and establishes no quantization regression on Gemma.
1baseline = {
2    "syntax_rollback_cmd": True,
3    "identify_missing_node_id": True,
4    "parse_alert_severity": True,
5    "abstain_on_unknown_runbook": False,
6}
7quantized = {
8    "syntax_rollback_cmd": False,  # Hypothetical critical flag regression
9    "identify_missing_node_id": True,
10    "parse_alert_severity": True,
11    "abstain_on_unknown_runbook": True,  # Hypothetical abstention improvement
12}
13if baseline.keys() != quantized.keys():
14    raise ValueError("Evaluation test fixtures do not match")
15regressed = sorted(k for k in baseline if baseline[k] and not quantized[k])
16improved = sorted(k for k in baseline if not baseline[k] and quantized[k])
17print(f"Baseline pass rate:  {sum(baseline.values())}/{len(baseline)} (75%)")
18print(f"Quantized pass rate: {sum(quantized.values())}/{len(quantized)} (75%)")
19print(f"Regressed test cases: {regressed}")
20print(f"Improved test cases:  {improved}")
21assert regressed == ["syntax_rollback_cmd"]
22assert improved == ["abstain_on_unknown_runbook"]1Baseline pass rate: 3/4 (75%)
2Quantized pass rate: 3/4 (75%)
3Regressed test cases: ['syntax_rollback_cmd']
4Improved test cases: ['abstain_on_unknown_runbook']Both dictionaries total 75%, but the cases differ. Under a release policy that rejects critical command regressions, the candidate fails. The baseline's failed abstention case also needs repair; comparison does not certify it as safe. The candidate's abstention improvement is useful evidence, not merely a lucky guess.
Diagnose with competing explanations
| Symptom | Possible causes | A discriminating check |
|---|---|---|
| Startup OOM | Weight/workspace/pool demand, competing allocations, unsupported placement | Failed allocation and backend logs; device free/used memory; actual tensor types |
| Long-input failure | Cache growth/reservation, prefill peak, graph/workspace pool | Hold concurrency fixed while sweeping context and prefill chunk; inspect peak and cache policy |
| Long-context decode slowdown | Attention/cache work, CPU offload, explicit transfer, migration, faults, recomputation | Trace transfers/placement and cache events; correlate major faults, file I/O, swap, and request preemption |
| Slow CPU decode | Bandwidth, NUMA placement, kernel path, thread contention | Thread sweep and locality experiment; use perf list to find platform-supported memory-controller counters |
| Equal scores, broken command | Artifact/template/decoding changes or task-specific errors | Paired outputs against the expected syntax and domain contract; isolate one changed component |
| Changed answers after redeployment | Updated artifacts/runtime/configuration, cache state, or sampling | Compare approved manifests, model digest, template/configuration, and repeatable case outputs |
| Server responds but inference fails | Model/worker/backend not ready despite HTTP liveness | Controlled inference readiness probe and worker logs; inventory alone is insufficient |
A restart does not itself re-pull a Docker image or an Ollama model. If a deployment step does pull mutable latest or model tags, it can install changed content. Use immutable container image digests and a verified local model artifact/manifest, with tokenizer, template, quantization, runtime, and options recorded. Do not assume Ollama accepts Docker-style model@sha256:... names.
Your deployment receipt: write down artifact identities, hardware/driver/runtime versions, placement, context and concurrency limits, cache/workspace policy, peak memory, the latency workload, per-case quality results, and the tested local fallback. Each field answers a different question. An image hash proves identity; it does not prove task quality or an enforced private-data boundary.