Personalize this lesson
Adapt explanations and teaching visuals to your background and preferred voice.
At 09:12 in this illustrative incident, hybrid-reranker-v3 answers a return-window question with "30 days" and no citation. Git commit 8b2f9e1 is unchanged, yet a prompt alias, retrieval index, provider model, or evaluator rubric may have moved. Checking the commit alone won't tell us which inputs this request actually used.
Ray showed where that work runs: tasks, actors, object refs, and recovery. MLflow records the evidence around it: experiments, parameters, metrics, artifacts, models, prompts, request traces, and evaluation results, all tied to stable identities. GPU scheduling and attention kernels stay elsewhere. Those links give a team something it can compare, reproduce, promote, debug, and audit.
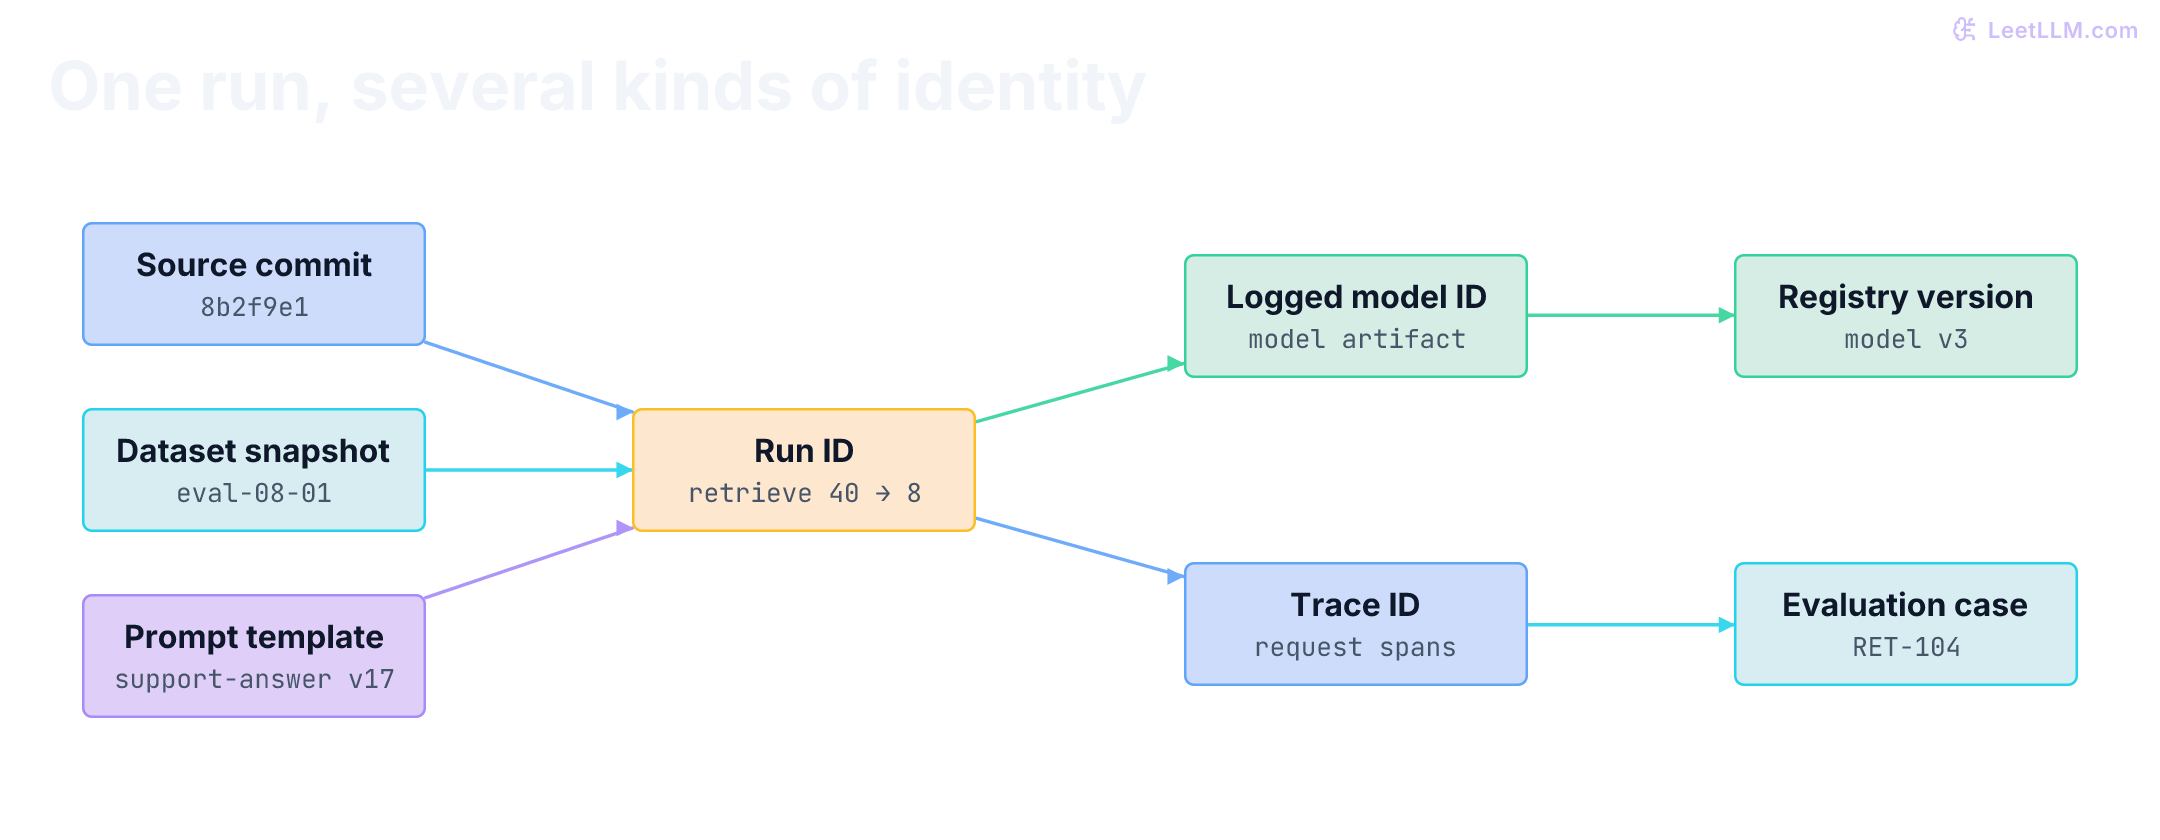
Keep one policy assistant in view. It retrieves 40 candidates, reranks to 8, and answers from prompt support-answer version 17. Git commit 8b2f9e1 and dataset support-eval-2026-08-01 (short label eval-08-01) identify two more inputs. When a request about the return window cites nothing, its trace becomes case RET-104. Names, scores, and timings here are teaching fixtures, not measurements from a deployed assistant.
The local SDK lab below pins MLflow 3.15.2, released August 26, 2026. The source-reading path uses that release too. Documentation under /latest/ can move ahead of an installed server, so verify feature availability and client/server compatibility before adopting its examples.[1]
Linked identities, not just a Git commit
Two runs can share a source commit while using different data, parameters, environments, random seeds, or checkpoints. Replay only the commit and you can still get a different model. The original MLflow paper described open interfaces for tracking experiments, packaging reproducible projects, and representing models in several deployment flavors without forcing teams into one framework.[2]
That open-interface idea still anchors the project. The current tree extends classical experiment tracking into LLM and agent work. Each asset below answers a different reconstruction question:
| Asset | What the record contains | Question it answers |
|---|---|---|
| Run | Parameters, metrics, tags, source | What happened in one experiment? |
| Logged model | Model files, signature, lineage | Which model artifact produced this result? |
| Prompt version | Immutable template; separately mutable model config | Which instructions reached the application? |
| Trace | Ordered spans, inputs, outputs, timing | Which step failed on this request? |
| Evaluation dataset | Cases, expectations, provenance | What evidence did releases face? |
| Assessment | Score, rationale, source | Who or what judged a trace? |
| Registry alias | Mutable name pointing to a version | Which asset does this name currently resolve to? |
These records earn their value through links. A trace can record the resolved prompt and model, a failure can become an evaluation case, and a candidate evaluation can point back to its model and code. Those links aren't automatic for arbitrary application code. Stable IDs also don't make every field immutable: tags, assessments, aliases, and some configuration can change. Require approval in your promotion workflow; the registry API itself won't refuse every unevaluated alias move.
Why isn't a Git commit enough to reproduce an LLM evaluation?
Answer
Code is only one input. Reproduction also needs model and prompt versions, data or trace cases, parameters, dependencies, evaluator definitions, and artifacts. MLflow records those changing inputs under linked identities.
Metadata and artifacts take different paths
Suppose every request adds a few searchable fields but a checkpoint adds gigabytes. Putting both in one store makes query traffic compete with large-byte transfers. MLflow separates searchable metadata from large bytes: the backend store holds experiment, run, model, prompt, trace, metric, parameter, and tag records, while the artifact store holds model weights, checkpoints, plots, tables, files, and archived trace payloads.[3]
That split leaves one routing question: who moves artifact bytes? The tracking server provides an HTTP boundary in front of both stores. Clients can send metadata to the server while either proxying artifact uploads through it or writing directly to object storage. Those modes have different credential and throughput consequences.
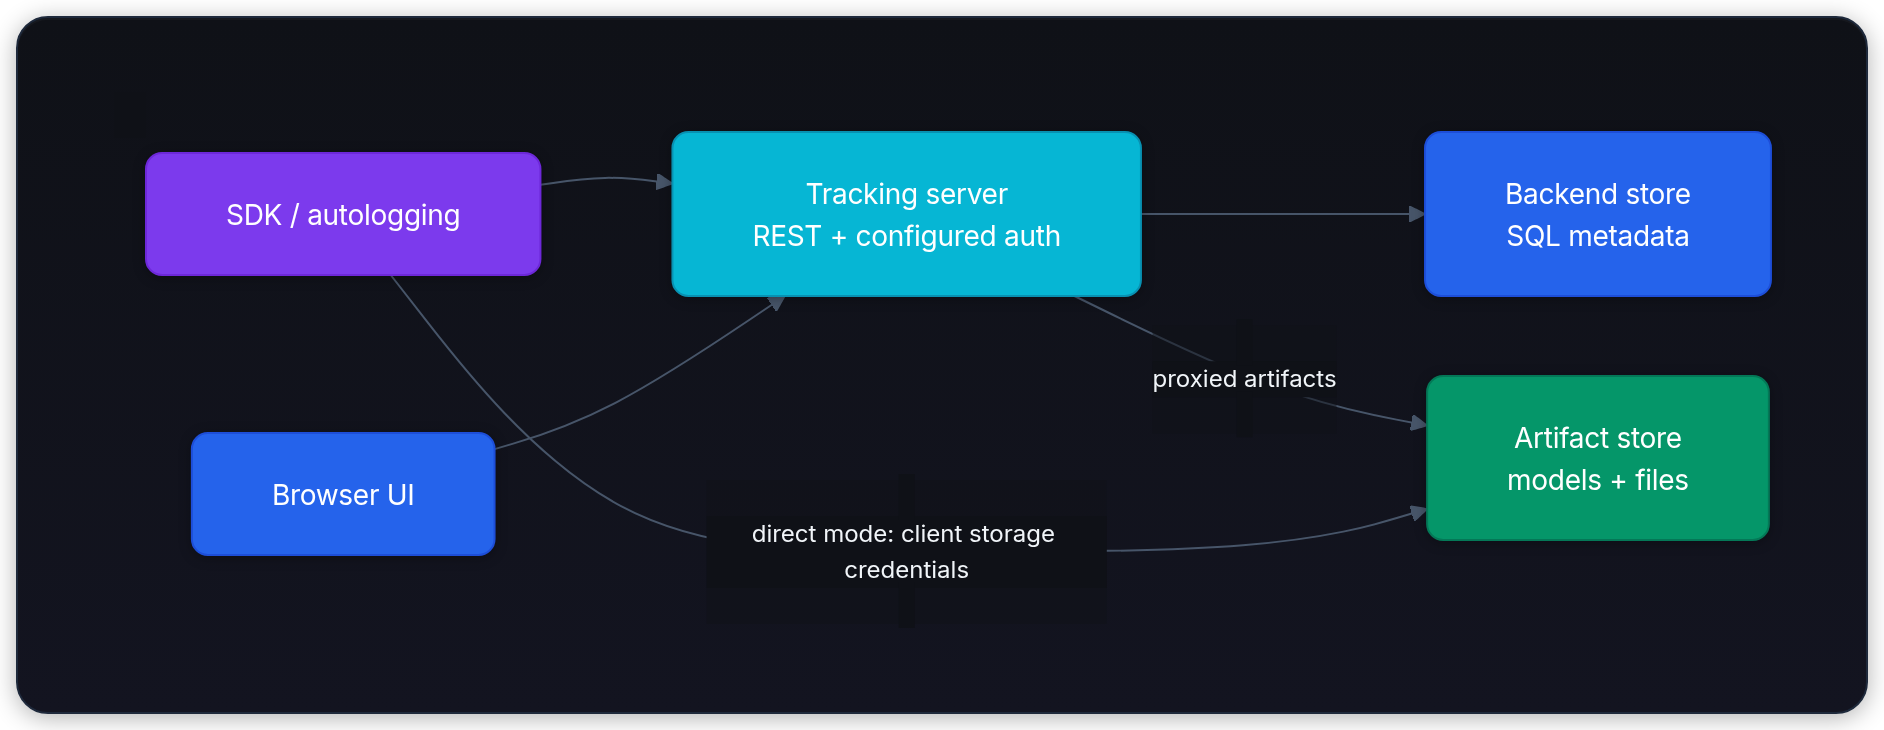
SQLite is the default local backend. A production tracking server normally uses a managed relational database plus object storage. The file backend is a legacy path in maintenance mode, and Model Registry requires a database-backed store. Shared workspaces, which group experiments, models, prompts, and artifacts for teams, are opt-in and also need SQL.[4][3]
Artifact proxying keeps storage credentials on the server, but it also widens the server's authority. Scope that role and enforce access checks on artifact requests; proxying isn't tenant isolation by itself. Direct uploads reduce proxy load, but every client now needs storage access. Existing experiments retain their artifact locations, so changing server flags doesn't automatically migrate their bytes or access paths.[3][5]
A diagram of stores still doesn't tell you what one experiment recorded. To answer that, follow one run.
Runs are evidence containers
A run groups parameters, metrics, tags, artifacts, and source metadata. In our example, retrieval depth and rerank width are parameters, nDCG@8 is a metric, the commit and dataset revision are tags, and error_slices.json is an artifact. Each field has a different job when you compare or replay a run.
The MLflow API makes those categories explicit. This example uses a temporary SQLite database and local artifacts, so it needs no tracking server. The metric values are fixtures; reading them back verifies persistence, not retrieval quality. Install mlflow==3.15.2 in an isolated environment before running it:
1import os
2from pathlib import Path
3from tempfile import TemporaryDirectory
4
5os.environ["MLFLOW_DISABLE_TELEMETRY"] = "true"
6import mlflow
7
8with TemporaryDirectory() as directory:
9    root = Path(directory)
10    mlflow.set_tracking_uri(f"sqlite:///{root / 'tracking.db'}")
11    experiment_id = mlflow.create_experiment(
12        "retrieval-ranking", artifact_location=(root / "artifacts").as_uri()
13    )
14    with mlflow.start_run(experiment_id=experiment_id, run_name="hybrid-reranker-v3") as run:
15        mlflow.log_params({"retrieval_k": 40, "rerank_k": 8})
16        mlflow.log_metrics({"recall_at_40": 0.94, "ndcg_at_8": 0.81})
17        mlflow.set_tags({"dataset_revision": "eval-08-01", "git_commit": "8b2f9e1"})
18        mlflow.log_dict({"case": "RET-104", "failure": "missing citation"}, "error_slices.json")
19    stored = mlflow.get_run(run.info.run_id)
20    assert stored.data.params["retrieval_k"] == "40"
21    assert stored.data.metrics["ndcg_at_8"] == 0.81
22 print("read back: retrieval_k=40; ndcg_at_8=0.81")1read back: retrieval_k=40; ndcg_at_8=0.81Those calls prove that the API accepted records, not that the records describe a valid experiment. Without a dataset revision, a metric can be impossible to compare. Missing model signatures can let the wrong schema reach an artifact, while mutable environment dependencies can defeat reproduction. MLflow stores evidence; the team still has to decide which evidence a release requires.[5]
MLflow's model abstraction packages files with a flavor-specific loader, environment metadata, and an optional input/output signature. A logged model has a model ID and can point back to a source run; that's distinct from a registered model's integer version. A registry version points to an artifact, while tags and aliases remain mutable. Approve the resolved artifact and its digest, then move an alias separately. A version number isn't protection against someone overwriting bytes in the artifact store.[6]
The run can say nDCG@8 is 0.81. That aggregate still can't show which span of a live request went wrong, so we need request-level lineage.
LLM traces add request-level lineage
A trace represents one request as a tree of spans. Each span records a named operation, timing, status, attributes, and optional inputs or outputs.
MLflow Tracing is compatible with OpenTelemetry (OTel), an open telemetry standard. It adds LLM-oriented structures while preserving export and ingestion through OTel-compatible systems.[7][8]
The policy assistant's illustrative trace has this shape. Retrieval reports DOC-12, but generation answers "30 days" with no citation. Before reading the timings, predict where you'd investigate first. The root's wall-clock duration is 1,420 ms:
1answer_question                         1,420 ms
2├── retrieve_policy_docs                 145 ms
3│   ├── embed_query                       24 ms
4│   └── vector_search                     91 ms
5├── rerank                                110 ms
6└── generate_answer                     1,130 ms
7    ├── model_call                       980 ms
8    └── validate_citations               105 ms
The direct children sum to ms, leaving 35 ms of root work outside those children if they ran sequentially. Never add all nested durations: that double-counts parent time. Overlapping spans also need a timeline rather than a sum to explain the critical path.
Root metadata helps search the trace, while child spans explain it. Model spans can carry token counts and provider metadata. Retrieval spans can record document IDs and scores; tool spans can record arguments, results, and exceptions. Assessments attach feedback or scores. A recorded document ID is evidence of what the instrumentation observed, not proof that the chunk reached the final model context. Check context packing as well as retrieval.
Instrumentation can be manual with @mlflow.trace or span contexts, automatic through integration hooks, or ingested from OpenTelemetry. Automatic tracing is fast to adopt, but manual spans are still useful around business decisions that a library integration can't name.
A trace shows a correct retrieved document but an unsupported answer. Which boundary failed?
Answer
Inspect the retrieved content, final context packing, instructions, model output, and citation validation. A correct document in retrieval output doesn't prove it survived truncation or reached generation. The trace narrows the investigation; it doesn't establish the root cause by itself.
One failure trace doesn't define a release test by itself. Freeze its inputs and write an expected outcome before changing the candidate, so later comparisons can tell whether the fix helped.
Traces become evaluation data
Call that frozen request RET-104. The operations loop starts by capturing development or production traces, then selecting failures and representative successes. Add expectations, labels, or human feedback, such as "the answer must cite a retrieved doc," and store those cases in a versioned evaluation dataset (eval-08-01).
Now run each candidate application version against the same cases. Apply deterministic scorers and calibrated LLM judges, then inspect per-case failures alongside aggregate slices. Our release policy requires every critical case to pass, so a better average can't hide a broken RET-104. Keep separate representative holdout cases: repeatedly tuning against incident cases can overfit the regression suite.
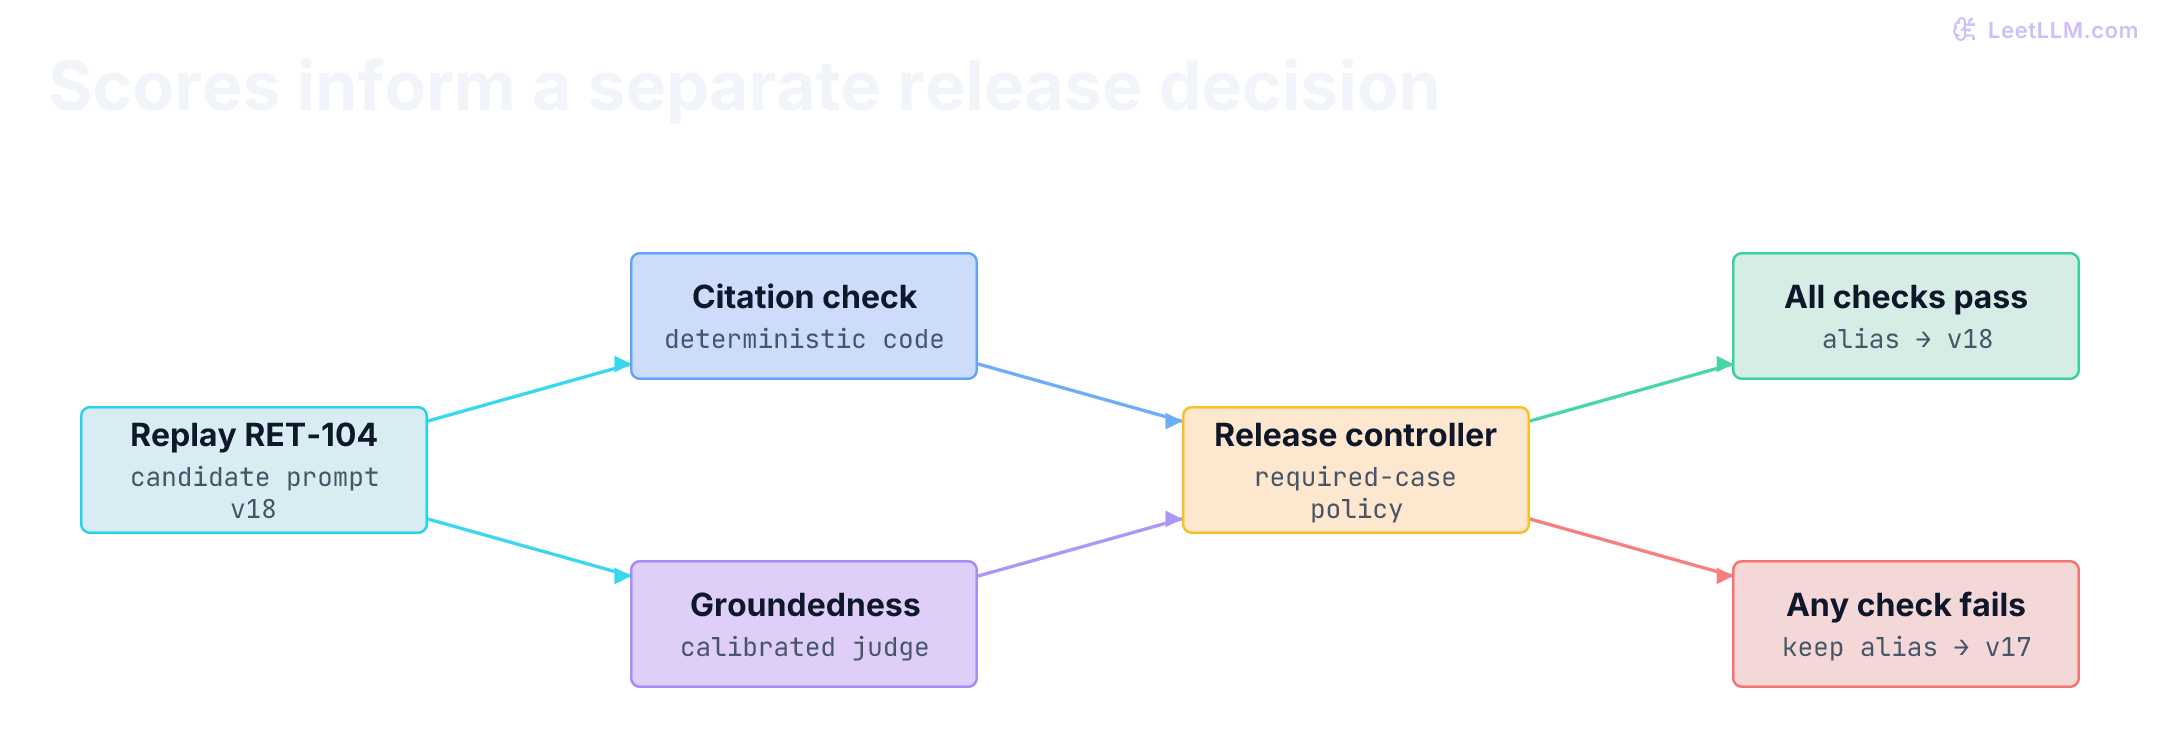
Offline evaluation runs when a team calls mlflow.genai.evaluate with cases, a prediction function, and scorers. Use deterministic scorers for exact contracts such as JSON validity, citation existence, tool policy, or numerical tolerance. LLM judges help with relevance or tone when exact code can't express the rubric.
Automatic evaluation applies configured LLM judges asynchronously to sampled or filter-matched traces or conversations. It keeps judge calls off the request's synchronous path, but logging overhead and shared server load still exist. The documented server workflow supports LLM judges rather than code scorers, uses AI Gateway endpoints, considers recent traces within a one-hour window, and doesn't automatically retry failed evaluations. Confirm these version-sensitive limits for your deployment. Monitor the fraction of eligible cases actually scored, not just the average among successful assessments.[9]
Judge output isn't ground truth. It changes with judge model, prompt, temperature, context, and rubric. Align judges against human labels, pin configurations, sample disagreements, and keep exact safety rules in code where possible.
Run the evidence loop locally
The downloadable SQLite SDK lab exercises native MLflow APIs with deterministic functions instead of provider calls. It reads back a run, artifact, and two-span trace; registers two prompt versions; moves an alias; then evaluates three response fixtures with mlflow.genai.evaluate and a custom code scorer.[10]
Run the file with uv run mlflow_local_lab.py. Its dependency metadata pins Python 3.12 and MLflow 3.15.2. It disables MLflow usage telemetry and uses a temporary local database and artifact directory, which it removes after checking them. Package installation may need internet access; the lab itself needs neither credentials nor a server.
The three cases have no citation, an unknown citation DOC-99, and an allowed citation DOC-12. The scorer accepts only a nonempty list of allowed document IDs. Thus one of three cases passes, and our all-required-cases release policy blocks promotion. This checks citation membership, not whether “30 days” is supported by the document's text.
Expected lab summaries, excluding MLflow's generated run IDs and progress messages:
1tracking: run, metric, artifact, and two-span trace read back
2prompts: old object=v1; fresh alias=v2
3mutability: parameter fixed; tag and prompt model config changed
4evaluation: missing=False; wrong=False; valid=True; mean=1/3
5release: blocked under the all-required-cases policy
6PASS: local SDK contracts; no server, provider, or judge calls
The fresh registry numbers these prompts 1 and 2; they play the roles of v17 and v18 in the incident. Setting cache_ttl_seconds=0 forces fresh alias resolution, so the lab tests alias movement and already-loaded objects, not elapsed-time cache expiry. We'll isolate expiry with a deterministic clock below.
Why should schema validity use a code scorer instead of an LLM judge?
Answer
Schema validity is deterministic and exactly computable. A code scorer is cheaper, repeatable, and easier to debug. Save judges for criteria that genuinely require semantic interpretation.
Instructions are one of the assets that evaluation will promote. They need the same versioning rules as models, which brings us to prompt management.
Prompt Registry makes instructions deployable assets
Prompt text behaves like code and configuration at once. A wording change can alter tool selection, output shape, latency, and safety. MLflow Prompt Registry stores templates with variables, optional model configuration, tags, and commit messages. A created template version is immutable, but its model configuration can be updated. Record the exact resolved configuration or its digest alongside the version; the prompt version alone can't reproduce a historical temperature setting.[11]
Aliases provide mutable names such as candidate or production. Clients can load prompts:/support-answer@production while the alias points to a numbered version. Moving the alias changes subsequent resolution; it doesn't rewrite an already loaded object or hot-reload a worker.
That convenience includes a cache, so an alias move isn't instantly visible to every worker. Version-based loads (prompts:/support-answer/17) have an infinite default time-to-live (TTL); alias-based loads (prompts:/support-answer@production) default to 60 seconds. A process can keep serving v17 until it loads again after expiry. Because attached model configuration is mutable, an indefinitely cached version object can also retain old configuration. Choose an explicit refresh policy and record the resolved configuration used on each request.[11]
The next example isolates cache behavior without calling MLflow. Its integer clock makes expiry reproducible. Versions reject replacement, aliases are scoped by prompt name, and cache entries are keyed by both name and alias. It models immutable templates only, not MLflow's mutable model configuration or concurrent registry writes.
1from dataclasses import dataclass
2
3@dataclass(frozen=True)
4class PromptVersion:
5    name: str
6    version: int
7    template: str
8
9class PromptRegistry:
10    def __init__(self) -> None:
11        self.versions: dict[tuple[str, int], PromptVersion] = {}
12        self.aliases: dict[tuple[str, str], tuple[str, int]] = {}
13
14    def register(self, prompt: PromptVersion) -> None:
15        key = (prompt.name, prompt.version)
16        if key in self.versions:
17            raise ValueError("version already exists")
18        self.versions[key] = prompt
19
20    def set_alias(self, alias: str, prompt: PromptVersion) -> None:
21        key = (prompt.name, prompt.version)
22        if key not in self.versions:
23            raise KeyError(key)
24        self.aliases[(prompt.name, alias)] = key
25
26    def resolve(self, name: str, alias: str) -> PromptVersion:
27        return self.versions[self.aliases[(name, alias)]]
28
29class CachedClient:
30    """Alias loads refresh after ttl_ticks. MLflow's default alias TTL is 60s."""
31
32    def __init__(self, registry: PromptRegistry, ttl_ticks: int = 1) -> None:
33        if type(ttl_ticks) is not int or ttl_ticks < 0:
34            raise ValueError("TTL must be a nonnegative integer")
35        self.registry = registry
36        self.ttl_ticks = ttl_ticks
37        self._cached: dict[tuple[str, str], tuple[PromptVersion, int]] = {}
38        self._last_tick = -1
39
40    def load(self, name: str, alias: str, tick: int) -> PromptVersion:
41        if type(tick) is not int or tick < 0 or tick < self._last_tick:
42            raise ValueError("clock must be nonnegative and monotonic")
43        self._last_tick = tick
44        key = (name, alias)
45        cached = self._cached.get(key)
46        if cached is None or tick >= cached[1]:
47            cached = (self.registry.resolve(name, alias), tick + self.ttl_ticks)
48            self._cached[key] = cached
49        return cached[0]
50
51def record_trace(alias: str, resolved: PromptVersion) -> dict[str, object]:
52    return {
53        "prompt_alias": alias,
54        "prompt_name": resolved.name,
55        "prompt_version": resolved.version,
56        "template": resolved.template,
57    }
58
59v17 = PromptVersion("support-answer", 17, "Cite retrieved docs.")
60v18 = PromptVersion("support-answer", 18, "Cite retrieved docs. Refuse if none.")
61registry = PromptRegistry()
62registry.register(v17)
63registry.register(v18)
64registry.set_alias("production", v17)
65
66client = CachedClient(registry, ttl_ticks=1)
67served = client.load("support-answer", "production", tick=0)
68assert record_trace("production", served)["prompt_version"] == 17
69
70registry.set_alias("production", v18)
71stale = client.load("support-answer", "production", tick=0)
72assert stale.version == 17
73
74fresh = client.load("support-answer", "production", tick=1)
75assert fresh.version == 18
76print(f"cached={stale.version} then resolved={fresh.version}")
77
78other = PromptVersion("summarize", 1, "Summarize without adding facts.")
79registry.register(other)
80registry.set_alias("production", other)
81assert client.load("summarize", "production", tick=1) == other
82try:
83    registry.register(PromptVersion("support-answer", 17, "Silently changed."))
84except ValueError:
85    print("version overwrite rejected; another prompt's cache stays separate")
86else:
87 raise AssertionError("immutable template was replaced")1cached=17 then resolved=18
2version overwrite rejected; another prompt's cache stays separateTrace RET-104 must store version 17 if that's what the process used, even while the alias already names 18. The alias describes intended routing; the resolved version describes observed behavior. The toy records template text for inspection; a real trace should apply redaction or record a digest when the template contains sensitive material.
Model Registry uses a similar alias model. Fixed stages such as Staging and Production have been deprecated since MLflow 2.9.0 in favor of tags, aliases, and environment-specific registered models. Aliases separate a deployable name from an immutable model version, while CI/CD owns approval and environment promotion.[6]
Provider calls are another mutable input. The gateway sees them, but it still isn't the source of application truth.
AI Gateway owns provider access, not application truth
MLflow also includes an OpenAI-compatible gateway surface for provider endpoints. Unified chat-completions live under /gateway/mlflow/v1, while passthrough routes expose a provider's native API. The gateway can centralize credentials, routing, fallbacks, rate limits, budgets, guardrails, and usage records.[12]
The gateway can answer which provider served a request, how many tokens it used, and whether a routing rule applied. It can't decide whether DOC-12 was the right policy or whether a business action was authorized. Keep those decisions in application and evaluation contracts.
Use this distinction when assigning release ownership:
| Layer | Owns | Doesn't prove |
|---|---|---|
| Gateway | Provider access, routing, spend limits | Answer correctness |
| Tracing | Request path and observed data | Evaluation validity |
| Evaluation | Scored evidence on selected cases | Population coverage |
| Registry | Version identity and aliases | Release approval by itself |
| CI/CD | Automated promotion rules | Live behavior after release |
Linking these layers doesn't transfer responsibility. A trace exists because a request ran. An assessment exists because something scored it. A registry alias moved because a workflow changed it. Each event needs its own authorization and evidence.
Those links only hold up when the tracking server, object store, and exporters are operated like production systems.
Production architecture needs operations work
Database capacity and migrations
Every run metric, trace, span, prompt, alias, and assessment adds write and query load. Use a production database, monitor connection pools and slow queries, and rehearse schema upgrades. Back up before migrations. Large trace payloads may need archival into object storage while lightweight trace metadata remains searchable.[4]
Artifact storage and credentials
Model checkpoints and evaluation tables can dwarf metadata. Use lifecycle rules, encryption, checksums, and explicit retention. Decide whether clients upload directly or the server proxies them. Don't give a public tracking server a broad object-store role.
Trace privacy
LLM spans can contain prompts, outputs, retrieved documents, tool arguments, secrets, personal data, and source code. Redact before export, sample intentionally, apply access controls, and set retention by data class. Disabling input capture for one integration doesn't automatically sanitize custom span attributes.[13][14]
Async loss and backpressure
Asynchronous tracing protects request latency, and OSS MLflow enables it by default outside Databricks notebooks. A process crash can still drop buffered spans. Current docs warn that a full export queue discards new traces and that failed exports are discarded after the retry window. Flush on graceful shutdown and monitor exporter failures. Then decide whether telemetry loss should fail open or fail closed: most applications should serve traffic while alerting on observability loss, while regulated workflows may choose differently.[13]
For instrumentation-only images, MLflow offers the slimmer mlflow-tracing distribution. Package composition is version-sensitive: the published mlflow==3.15.2 package itself depends on matching mlflow-skinny==3.15.2 and mlflow-tracing==3.15.2. Let the resolver install that supported set; don't independently mix mismatched releases based on older packaging advice.[15]
Identity and tenancy
A shared tracking server contains proprietary artifacts and request data. Put authentication, TLS, workspace or experiment permissions, and object-store policies into the threat model. Registry write access is deployment power because moving an alias can change what future clients load.
Strengths and weaknesses
Read each row as a tradeoff, not a feature tally:
| Strength | Why teams value it | Weakness or cost |
|---|---|---|
| Framework-neutral interfaces | One evidence model across training and LLM apps | Integrations expose uneven detail |
| Metadata plus artifact split | Search stays separate from large files | Two storage systems need backup and policy |
| OTel-compatible tracing | Existing telemetry systems can ingest or export spans | LLM payloads create privacy risk |
| Linked runs, models, prompts, traces, evals | End-to-end lineage supports debugging and promotion | Correct links still depend on disciplined logging |
| Self-hosted Apache-2.0 core | Teams control infrastructure and data | Team owns upgrades, scaling, auth, and retention |
| Model and prompt aliases | Deployments can reference stable names | Mutable aliases need authorization and cache awareness |
MLflow isn't a general distributed scheduler like Ray or Kubernetes. It offers deployment integrations and agent-serving features, but those don't replace the underlying resource scheduler, recovery protocol, or autoscaling system. Identify which component actually owns a GPU allocation or retry before treating a logged event as execution control.
It also doesn't replace a full observability platform. Infrastructure metrics, logs, profiles, and distributed application traces may live elsewhere. OpenTelemetry compatibility helps correlate them, but teams still need consistent trace and deployment identifiers across systems. If a GPU is saturated, MLflow can link the request to its model and release; a GPU profiler still has to explain the kernel.
Project identity
MLflow was created at Databricks and announced in 2018. The original paper's authors included Matei Zaharia, Andrew Chen, Aaron Davidson, Ali Ghodsi, Andy Konwinski, and other Databricks engineers.[2] It focused on experimentation, reproducibility, and deployment through open interfaces rather than a locked framework.
Databricks contributed MLflow to the Linux Foundation on June 25, 2020, giving the project a vendor-neutral governance home.[16] Databricks remains a major contributor and offers managed MLflow integrations, while the public project can be self-hosted and accepts community contributions.[17][18]
| Field | Current project fact |
|---|---|
| Origin | Databricks created MLflow; the foundational paper names Matei Zaharia, Andrew Chen, Aaron Davidson, Ali Ghodsi, and collaborators.[2] |
| Stewardship | MLflow is a Linux Foundation project with a technical steering committee and core maintainers listed in its contribution guide.[16][19] |
| Contributor model | Issues and pull requests flow through project committers and maintainers, with Developer Certificate of Origin sign-off for incoming code.[19][20] |
| Project licenses | Source code uses Apache-2.0. The technical charter makes project documentation available under CC BY 4.0.[21][20] |
| Commercial boundary | Databricks provides managed MLflow products, while the Linux Foundation repository remains separately governed and self-hostable.[18][16] |
| Asset boundary | Logging a model, dataset, prompt, trace, or artifact doesn't relicense it under MLflow's code license. Your organization still owns its access and retention policy. |
The foundational paper explains the original design, not every modern API. Tracing also builds on OpenTelemetry specifications. For evaluation, prompt registry, gateway, and model-lineage behavior, use the documentation and source matching your release.
A code-reading path through MLflow
The public repository makes architectural boundaries visible. Trace one request from client call to store and span, then pin the commit because GenAI code moves quickly:
- Start at
mlflow/tracking/client.pyto see the stableMlflowClientfacade. - Follow a log call into
mlflow/store/tracking/and compare REST, file, and SQLAlchemy stores. - Follow an artifact call into
mlflow/store/artifact/to see why large bytes use separate repositories. - Open
mlflow/server/handlers.pyand trace one REST route to a store operation. - Read
mlflow/entities/logged_model.pyfor model identity and lineage. - Follow
mlflow/tracing/provider.pyandmlflow/tracing/client.pyfrom span creation to persistence. - Inspect
mlflow/genai/for evaluation datasets, scorers, and prompts; follow gateway-specific handling intomlflow/gateway/.
Use tag v3.15.2 for this reading exercise instead of moving master. Start with MlflowClient.log_param, follow the tracking client to SqlAlchemyStore.log_param, and find the database constraint that rejects changing an existing parameter value. Then compare it with mutable run tags and prompt aliases. Public concepts are more stable than the implementation paths around them.[1]
Test that distinction before reading deeper. The local lab tries to overwrite retrieval_k=40 with 50, then changes a run tag and a prompt version's temperature. The parameter update must fail; the tag and configuration updates must succeed. A useful source-reading explanation identifies where each rule is enforced and which historical values remain recoverable. Naming three API methods without explaining their different mutability rules misses the important boundary.
A prompt version's template stayed unchanged, but its temperature changed from 0.2 to 0.8. Can an old evaluation receipt containing only the version number reproduce the earlier request?
Answer
No. The template version doesn't identify the historical mutable configuration. Retain the exact configuration used, or its digest plus retrievable content. Resolve configuration deliberately when loading prompts; an already-loaded object may still contain the earlier value.
Designing an evidence contract
Start an MLflow deployment with required fields and release receipts, not with a dashboard. For the policy assistant, require:
- Application release, source commit (
8b2f9e1), environment, and dependency lock. - Resolved model provider and exact model identifier.
- Resolved prompt version alongside its alias (
support-answer@productionandv17orv18), plus the model configuration actually used. - Retrieval index and corpus revision (
eval-08-01isn't a substitute for the live index hash). - Root trace ID plus tool, retrieval, and model spans.
- Token, latency, failure, and cost attributes with known units.
- Evaluation dataset revision and scorer versions.
- Per-case assessments plus aggregate slices, including
RET-104. - Approval identity, candidate version, and digests of the evaluated artifact and configuration.
- Alias movement event and rollback target.
That receipt lets a team answer four different questions: what ran, what it observed, how it scored, and why it was promoted. Without those distinctions, one green dashboard can hide missing cases, stale aliases, or dropped traces.