Personalize this lesson
Adapt explanations and teaching visuals to your background and preferred voice.
A patch arrives with one exciting line: triad_f32 is 1.8x faster. It passed on one input, and a host timer printed a smaller number. On another run, the advantage shrinks. On a length that isn't divisible by 256, one output near the end changes.
That isn't a performance result yet. A trustworthy claim must show that both kernels computed the same operation, timed completed GPU work under identical conditions, and improved the scope users care about. Profilers explain where time went. They don't repair a broken comparison.
The Accelerator Architecture Field Guide established streaming multiprocessors, high-bandwidth memory, caches, and hardware ceilings. CUDA for ML Training established grids, blocks, asynchronous launches, and event timing. This triad investigation puts those mechanics through five evidence gates:
- Gate 1: Reference Verification. Compare outputs against an independent reference within declared tolerances (), including unaligned lengths. This lab uses a double-precision CPU reference; other operations need their own numerical analysis.
- Gate 2: Compute Sanitizer. Check exercised paths for invalid accesses and synchronization hazards. A clean report supports correctness; it doesn't prove safety for every input or schedule.
- Gate 3: Clean Synchronized Timing. Time completed work with CUDA events, a declared warmup policy, and a cache regime that matches the question. Collect benchmark samples outside profilers and sanitizers.
- Gate 4: Hardware Roofline Bound. Compare throughput with a ceiling for the same hardware, dtype, and memory level. Algorithmic useful bytes and measured HBM bytes are different quantities.
- Gate 5: Reproducible Receipt. Preserve source identity, hardware state, commands, and raw artifacts with hashes so another engineer can inspect and rerun the experiment.
One small kernel will carry the investigation. For every index , it computes a floating-point triad:
It looks too small to fail. That makes it useful: if the evidence is weak here, a fused attention or quantization kernel will hide the same mistakes behind far more code.
Turn “faster” into a testable claim
Suppose a candidate replaces an existing triad_f32 implementation. Before opening a profiler, write the claim so another engineer could disprove it. The starter supplies a baseline and a deliberately incorrect variant, not two valid implementations with a measured speedup.
| Claim field | Concrete contract for the running kernel |
|---|---|
| Semantics | For each valid index, return fmaf(alpha, x[i], z[i]) within declared tolerance |
| Workload | float32, , deterministic bounded inputs |
| Scope | One completed kernel launch, excluding allocation and host-to-device copies |
| Cache regime | Report cache-hot and buffer-rotated measurements separately |
| Baseline | Same compiler flags, device, inputs, output check, and timing method; record each version's launch shape |
| Environment | GPU UUID, driver, CUDA runtime, source revision, clocks, power limit, and temperature |
| Decision | Keep candidate only if correctness gates pass and measured scope improves |
The odd length is intentional. With 256 threads per block, the last block contains threads whose indexes exceed . A boundary guard must reject them. Testing only lengths divisible by block size leaves an off-by-one bug invisible.
The arithmetic also supplies an early hypothesis. One triad element performs one multiply and one add, counted as two floating-point operations (FLOPs). Its algorithmic minimum traffic is two float32 loads and one float32 store, or 12 bytes:
That low arithmetic intensity suggests a bandwidth-sensitive kernel. It doesn't prove measured device-memory traffic equals 12 bytes per element, nor that high-bandwidth memory (HBM) is the current limit. Caches, transaction efficiency, launch overhead, and extra instructions can all move the measured point.
💡 Key insight: A performance hypothesis comes from operation and byte counts. A performance claim comes from a correctness-checked measurement on named hardware.
A cache-hot run processes 1,000,003 elements in 8.0 microseconds. Using the 12-byte algorithmic floor, what useful bandwidth does that imply, and why doesn't it prove HBM delivered that rate?
Answer
The calculation is , or about GB/s. That number counts algorithmic input and output bytes. It isn't a device-memory traffic counter, so cache hits can make useful bandwidth exceed the GPU's HBM specification without violating a hardware limit.
Gate 1: Reference verification and numerical tolerance
A trusted reference should be simpler than the candidate and independent enough to catch its mistakes. For triad, compute on the CPU in double, cast to float, and compare every element. A fused multiply-add (FMA) rounds the multiplication and addition together rather than rounding their intermediate product. The CPU reference rounds in double and then converts to float; the GPU's fmaf rounds directly to float. Higher precision helps here, but two-stage rounding isn't a universal bitwise oracle.[1]
A checksum is too weak: two wrong values can cancel, and a single out-of-bounds write may miss sampled positions. Initialize output to a recognizable poison value before checking, so a skipped store can't inherit a previous correct result. Allocate each test's logical length, not a larger buffer that hides its tail overrun.
Floating-point equality needs a numerical contract. PyTorch's allclose rule is a useful statement of it:[2]
Here is the candidate output and is the reference. Relative tolerance scales with nonzero reference magnitude. Absolute tolerance protects values near zero, where relative error alone can explode. Neither constant is universal. Choose them from dtype, operation count, expected rounding, input range, and downstream quality requirements, then freeze them before comparing candidates.
For bounded float32 inputs and one fused multiply-add, this lab uses atol = 2e-6 and rtol = 2e-5. Those are acceptance settings for this workload, not recommended defaults for arbitrary kernels. A reduction over thousands of values needs different analysis because accumulation order changes rounding.
Exercise the contract across shapes and values that expose distinct failure modes:
| Test | Why it exists | Failure signature |
|---|---|---|
| and | empty and smallest legal work | launch or guard assumption |
| both sides of one block boundary | last-block indexing bug | |
| realistic rounded-up grid | rare tail corruption | |
| zeros and cancellation | reference values near zero | missing absolute tolerance |
| largest lab magnitude, | large-value rounding and cancellation | absolute- or relative-error spike |
| repeated seeds | varied values with reproducible inputs | input-sensitive mismatch |
This CPU-only indexing exercise isolates the allocation trap. Python bounds checks stand in for the illegal access that a CUDA sanitizer should report; they don't simulate GPU execution. Predict why the same wrong guard behaves differently with spare allocation space.
import math

def write_indexes(n, allocated, inclusive=False):
    output = [math.nan] * allocated
    launched = ((n + 255) // 256) * 256
    for i in range(launched):
        if i < n or (inclusive and i == n):
            output[i] = float(i)  # Python raises on an allocation overrun.
    return output

n = 257
correct = write_indexes(n, n)
oversized = write_indexes(n, 512, inclusive=True)
print("logical output matches:", oversized[:n] == correct)
print("illegal extra store:", oversized[n])
try:
    write_indexes(n, n, inclusive=True)
except IndexError:
    print("exact allocation: tail overrun caught")
print("empty input:", write_indexes(0, 0))logical output matches: True
illegal extra store: 257.0
exact allocation: tail overrun caught
empty input: []Gate 2: Compute Sanitizer and runtime memory safety
Reference comparison catches wrong values that reach output. Runtime tools catch illegal execution that happens to leave checked values unchanged. NVIDIA Compute Sanitizer provides four specialized checkers:[3]
memcheck: Detects out-of-bounds global, shared, and local memory accesses, misaligned memory instructions, and illegal device pointers.racecheck: Detects shared-memory data hazards (RAW, WAR, WAW hazards where threads in a block access the same shared memory location without synchronization).initcheck: Flags reads of uninitialized global memory, catching kernels that assume memory allocations come pre-zeroed.synccheck: Catches illegal barrier synchronization, such as calling__syncthreads()inside divergent branches where not all warps arrive.
Run memcheck first. NVIDIA recommends it before tools such as racecheck and synccheck, which don't replace memory-access checking.[3] This lab uses --padding 32 to place additional padding after supported global-memory allocations, exposing overruns that might otherwise reach another valid allocation. Padding doesn't detect a write beyond a logical tensor's shape when that write remains inside its own oversized allocation. --error-exitcode 99 gives a successful application a nonzero exit status when the checker reports errors; inspect the report and application status together.
The tools have different scopes. In particular, racecheck targets shared-memory hazards; it isn't a general detector of all global-memory races. A clean run covers the tested inputs, executed paths, and enabled checks, rather than all possible executions.
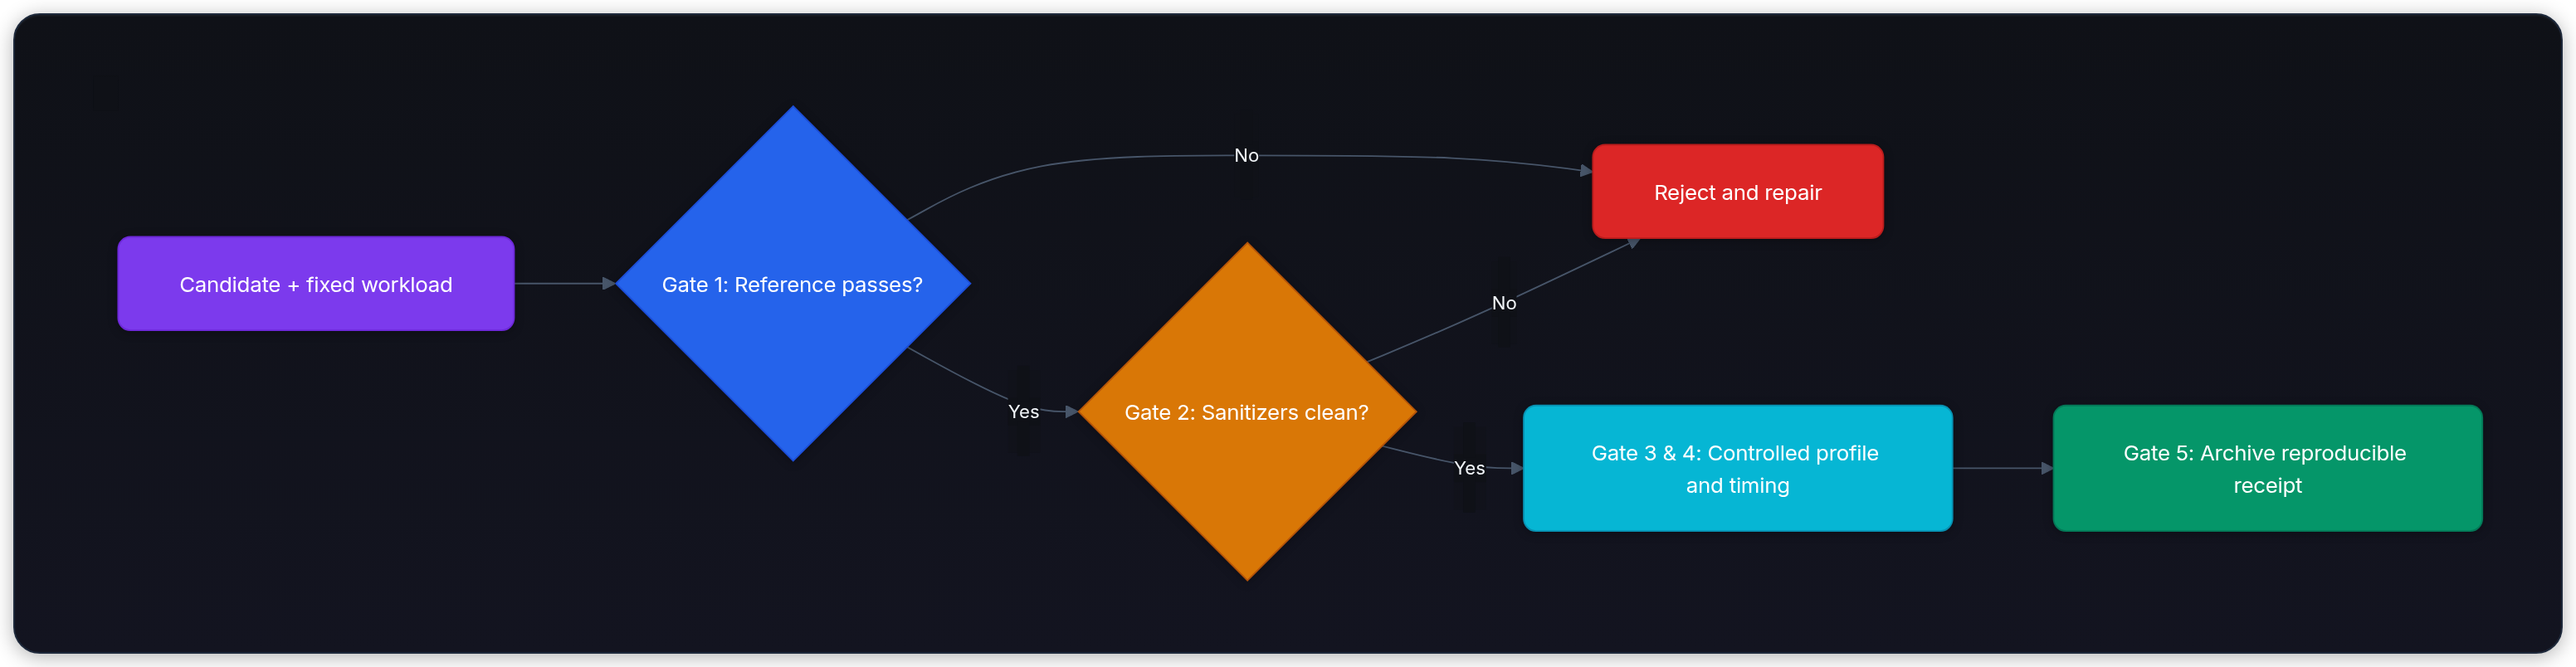
This sequence prevents an embarrassing trap. A profiler can report record-breaking memory throughput for a kernel that reads past buffer bounds. High hardware utilization never upgrades undefined behavior into a valid optimization.
Profiler scope: Nsight Systems versus Nsight Compute
Start wide enough to see ownership of delay, then zoom into one proven hotspot. NVIDIA separates those scopes across Nsight Systems and Nsight Compute.[4][5]
| Question | Instrument | Evidence it supplies | What it can't establish alone |
|---|---|---|---|
| Why is the application waiting? | Nsight Systems | CPU scheduling, CUDA API calls, transfers, kernels, streams, synchronization, idle gaps | Exact instruction or memory limit inside one kernel |
| Why is this kernel slow? | Nsight Compute | Launch resources, SpeedOfLight sections, cache and device-memory traffic, warp stalls, Roofline point | User-visible end-to-end latency or output correctness |
| Is CUDA execution legal? | Compute Sanitizer | Invalid access, shared-memory hazard, uninitialized read, invalid barrier use | Representative performance under normal execution |
| How long did completed device work take? | CUDA events or a synchronizing benchmark harness | Device elapsed time for declared event boundaries | Cause of the elapsed time |
Nsight Systems finds system-level bottlenecks
Open a system trace before assuming the hottest-looking kernel owns application delay. Nsight Systems combines selected CUDA/CUPTI activity and CPU tracing. Overhead depends on enabled features and the workload; tracing more APIs, collecting backtraces, or tracking memory can substantially perturb a run.[4] Compare traced and clean executions. Look for large transfers, CPU preparation gaps, stream serialization, blocking scalar reads, and GPU idle bubbles. A long kernel is actionable only if it lies on the claim's critical path.
For this lab, event synchronization after every sample intentionally serializes launches. Nsight Systems reveals that pattern immediately. It's correct for the isolated kernel-latency question, but it would distort a throughput experiment that expects multiple kernels or requests in flight. Scope determines whether synchronization is a measurement boundary or an application bottleneck.
Nsight Compute diagnoses kernel microarchitecture
Once triad_f32 is a known hotspot on the critical path, collect kernel metrics. Nsight Compute hooks directly into hardware performance monitoring units (PMUs) on the streaming multiprocessors. Its report sections cover launch configuration, memory workload analysis, GPU Speed of Light, and Roofline analysis.[5]
Its baseline feature compares two kernel runs side-by-side. However, microarchitectural profiling changes the physical execution conditions.
Profiler distortions: multi-pass replay and counter perturbation
Not every requested counter can be collected together. Nsight Compute may need multiple passes; the count depends on the metric set and GPU. Under kernel replay, it saves memory accessed by the kernel and restores the written subset before subsequent passes. A report requiring only one pass may avoid that save/restore work.[5]
The collection policy changes the experiment:
- Default cache control flushes GPU caches before each replay pass, removing reuse that a normal application may retain.
- Nsight Compute normally serializes kernel launches for isolated counter collection. That doesn't mean it serializes every warp or memory-controller queue.
- Save/restore, metric collection, and repeated execution increase collection cost. Application replay and range replay have different tradeoffs; range modes can preserve concurrent work where isolated kernel replay would change its behavior.
Never quote elapsed time from an instrumented profiler report as a clean benchmark. Profilers explain why code behaves as it does; clean, un-instrumented benchmark runs measure how fast it actually finishes.
Sanitizers run outside timing
Compute Sanitizer instruments execution and can add substantial overhead. Its standalone mode launches kernels nonblocking by default; --force-blocking-launches changes that behavior.[3] Instrumentation can alter scheduling without universally serializing concurrent warps. Finish the sanitizer run, inspect its outcome, and collect latency in a separate execution.
⚠️ Common mistake: Running every tool simultaneously produces an expensive, distorted execution whose timing answers no valid question. Keep correctness verification, microarchitectural diagnosis, and clean benchmark timing as separate, linked runs.
Gate 3: Synchronized timing and benchmark state control
“Kernel time” still leaves choices. State whether the product reuses the same resident data, streams new buffers, overlaps launches, or includes transfers. Different scopes can all be legitimate, but they can't share one unlabeled number.
| Measurement question | Include | Exclude | Timing method |
|---|---|---|---|
| Isolated device interval | One kernel on resident buffers, plus any gaps inside event boundaries | Allocation and copies | CUDA events around launch |
| Steady pipeline throughput | Representative sequence with normal overlap | One-time setup | Events around batch or end-to-end synchronized wall clock |
| First request latency | Compile, lazy initialization, allocation, and transfers that user experiences | Unrelated process startup | Synchronized end-to-end clock |
| Cache-sensitive stream | Rotated working set sized beyond relevant cache | Accidental same-buffer reuse | Events plus cache counters |
Host versus device asynchrony: timing streams, not launch queues
CUDA kernel launches are asynchronous with respect to the host: a successful return doesn't establish kernel completion. The host call can still block because of internal resources or contention. Submission cost has no universal microsecond value, and the GPU may already have started when the call returns.[6]
An unsynchronized host timer around a launch measures the host-call interval. It can include API blocking, but doesn't provide a completed-device boundary. A shorter interval therefore can't establish a faster kernel. Use a monotonic host clock with explicit completion when the question is end-to-end wall time.
CUDA events solve this by placing timestamp markers into the execution stream:
cudaEvent_t start, stop;
CUDA_CHECK(cudaEventCreate(&start));
CUDA_CHECK(cudaEventCreate(&stop));

CUDA_CHECK(cudaEventRecord(start, stream));
launch_triad<<<blocks, threads, 0, stream>>>(...);
CUDA_CHECK(cudaEventRecord(stop, stream));

CUDA_CHECK(cudaEventSynchronize(stop));
float elapsed_ms = 0.0f;
CUDA_CHECK(cudaEventElapsedTime(&elapsed_ms, start, stop));
Both events must be timing-enabled and ordered around the work in its stream. Waiting for stop establishes completion of work captured by that event; only then read the elapsed interval.[7]
An event interval can include submission gaps, kernel stalls, and interference from other work. It excludes a queue delay that occurs entirely before the start event executes. It therefore isn't automatically pure instruction time or the entire host-to-completion latency.
cudaDeviceSynchronize() waits for preceding work on the current device in the caller's CUDA execution context; it doesn't suspend all streams across every process on the physical GPU.[8] A host wait after each launch prevents that host thread from submitting its next launch concurrently. Event synchronization narrows the completion dependency, but independent streams can still compete for resources and affect the interval.
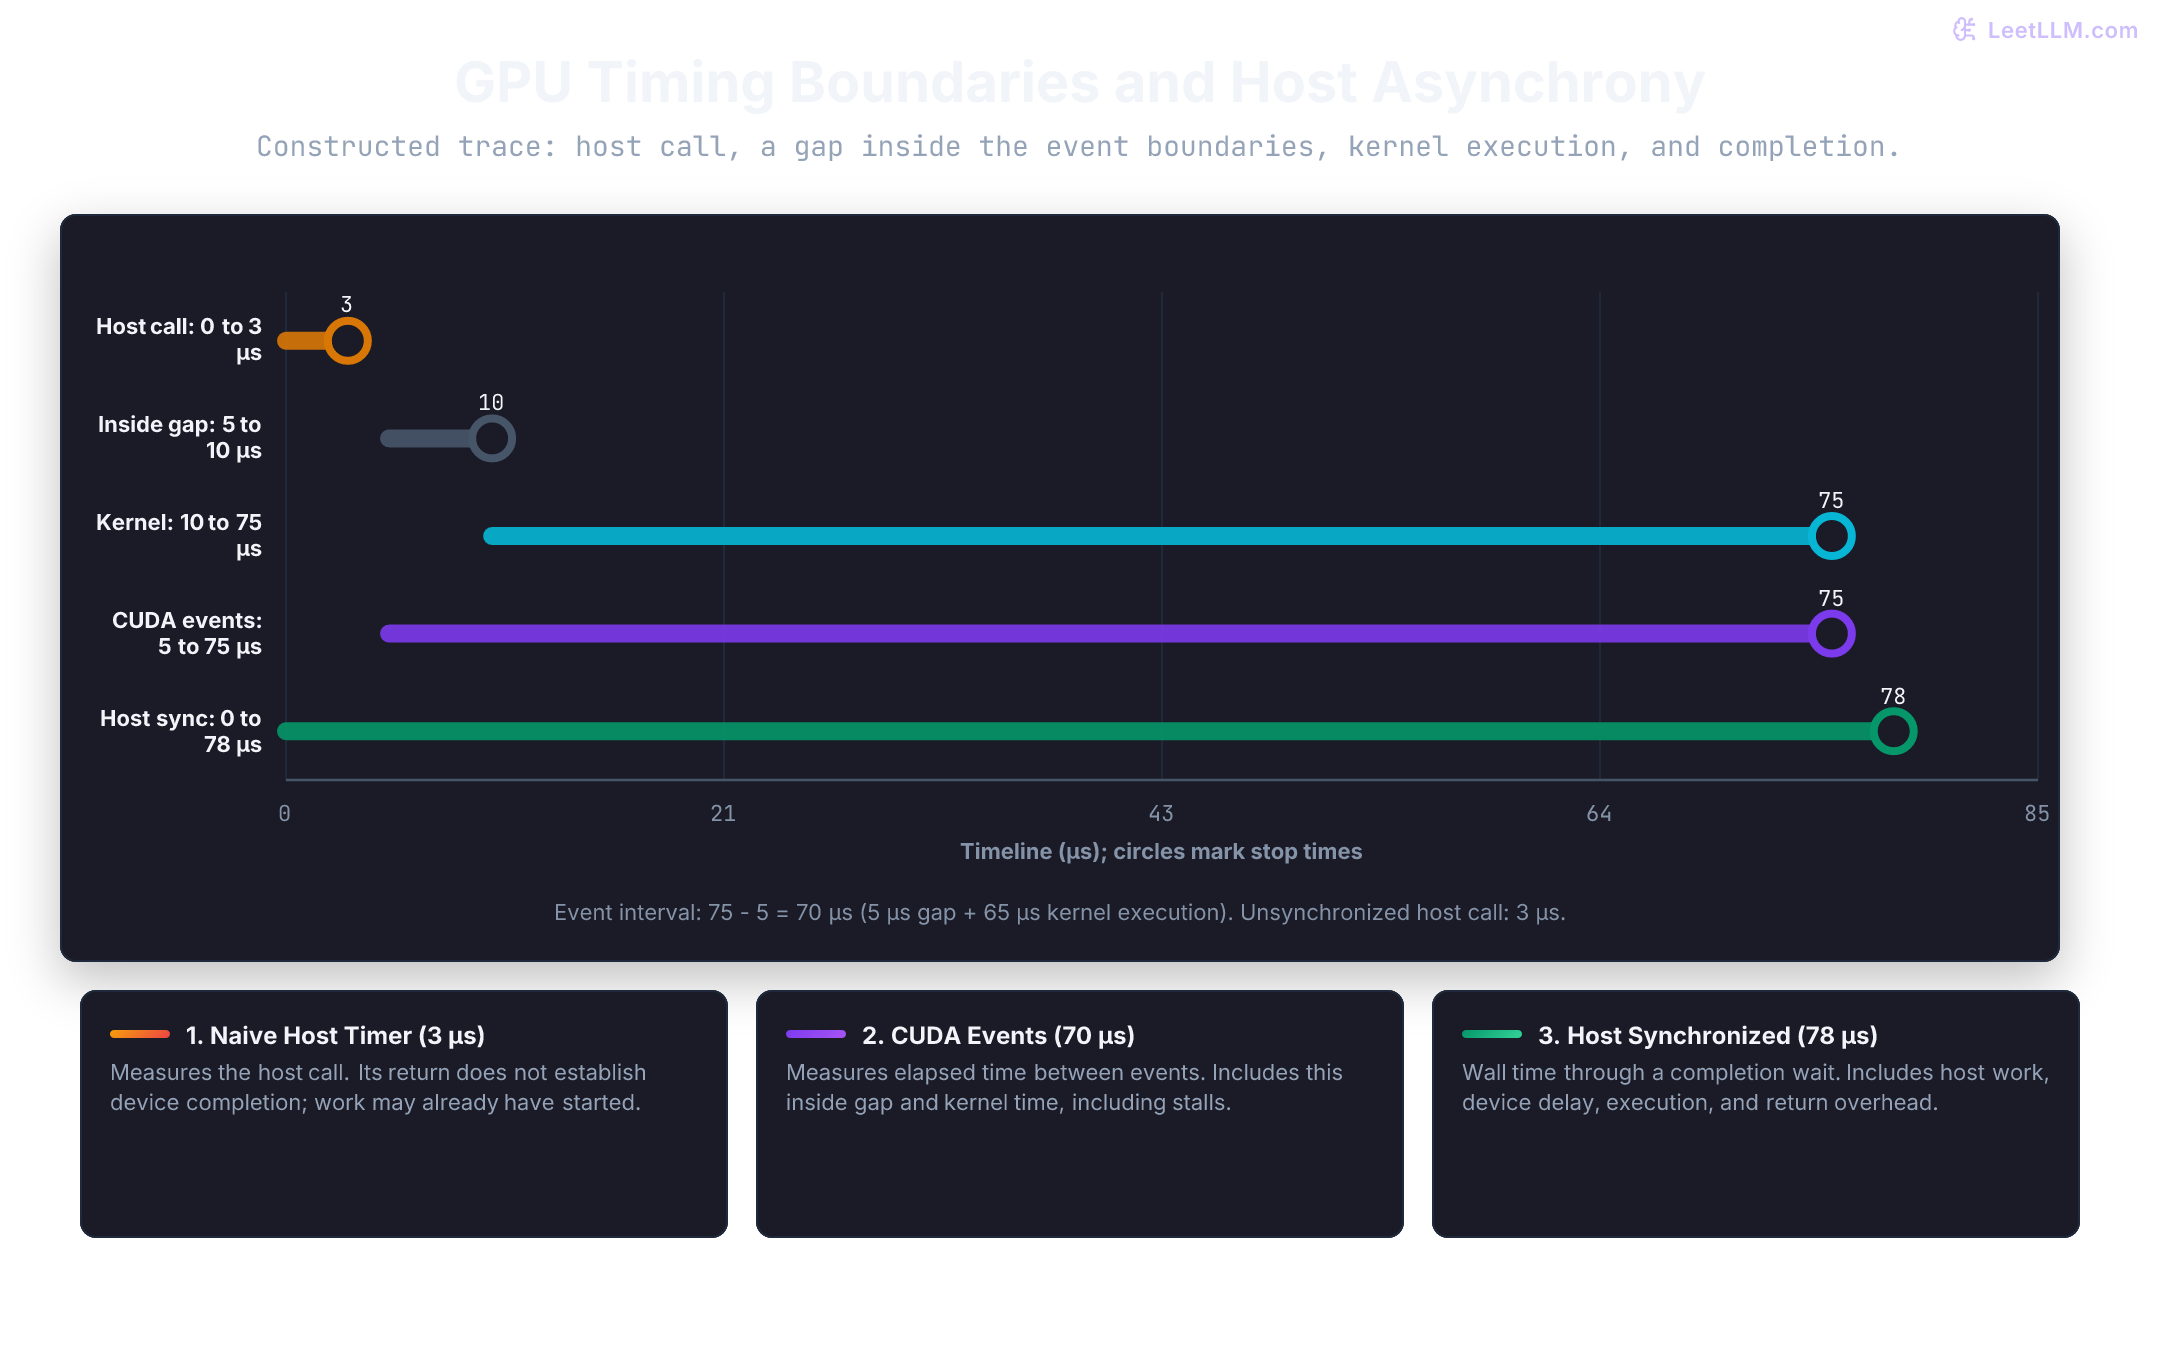
CUDA events have roughly 0.5-microsecond resolution.[7] For tiny kernels, consider timing a batch and dividing by its launch count. That reports an average interval, including any gaps between launches; it doesn't recover individual latency percentiles. Keep batch size and cache policy identical across versions. A rounded-to-zero interval needs a longer measurement window.
Cache policy: test residency rather than assume it
The three triad buffers occupy bytes, about 11.44 MiB. H100 has a nominal 50 MB L2 cache, so this footprint can fit.[9] Fit alone doesn't guarantee residency: cache policies, address mapping, competing work, and the preceding initialization matter. Use the selected device's reported cache capacity rather than a cross-model table.
Suppose a same-buffer run took a hypothetical 3 microseconds. Dividing useful bytes by that interval gives about 4,000 GB/s. That doesn't establish 4,000 GB/s of HBM traffic, and exceeding an HBM specification with useful-byte accounting isn't physically impossible. Counter evidence is needed to distinguish cache service, device-memory traffic, and other effects.
Real applications can reuse weights or intermediates in cache; other paths stream fresh data. A same-buffer benchmark can be representative, or misleading, depending on the path being optimized. Label the regime before choosing a winner.
Two experiments encourage cache turnover:
- Buffer rotation: Cycle through distinct buffer triplets. The starter targets an aggregate footprint above twice the reported L2 capacity, subject to its memory budget. This encourages turnover but doesn't prove every launch's loads and stores reached HBM.
- Separate sweep: Access a large dummy buffer between timed launches when rotation is impractical. Size alone doesn't establish complete eviction or completion of every dirty writeback. This starter doesn't implement a sweep.
For either experiment, examine traffic and hit-rate counters under a matching profiling policy. Nsight Compute's explicit cache-flush control is a profiler facility; a normal rotation loop isn't an architectural cache flush. Don't label rotation “true HBM” without checking what it measured.
Warm until mechanism is steady
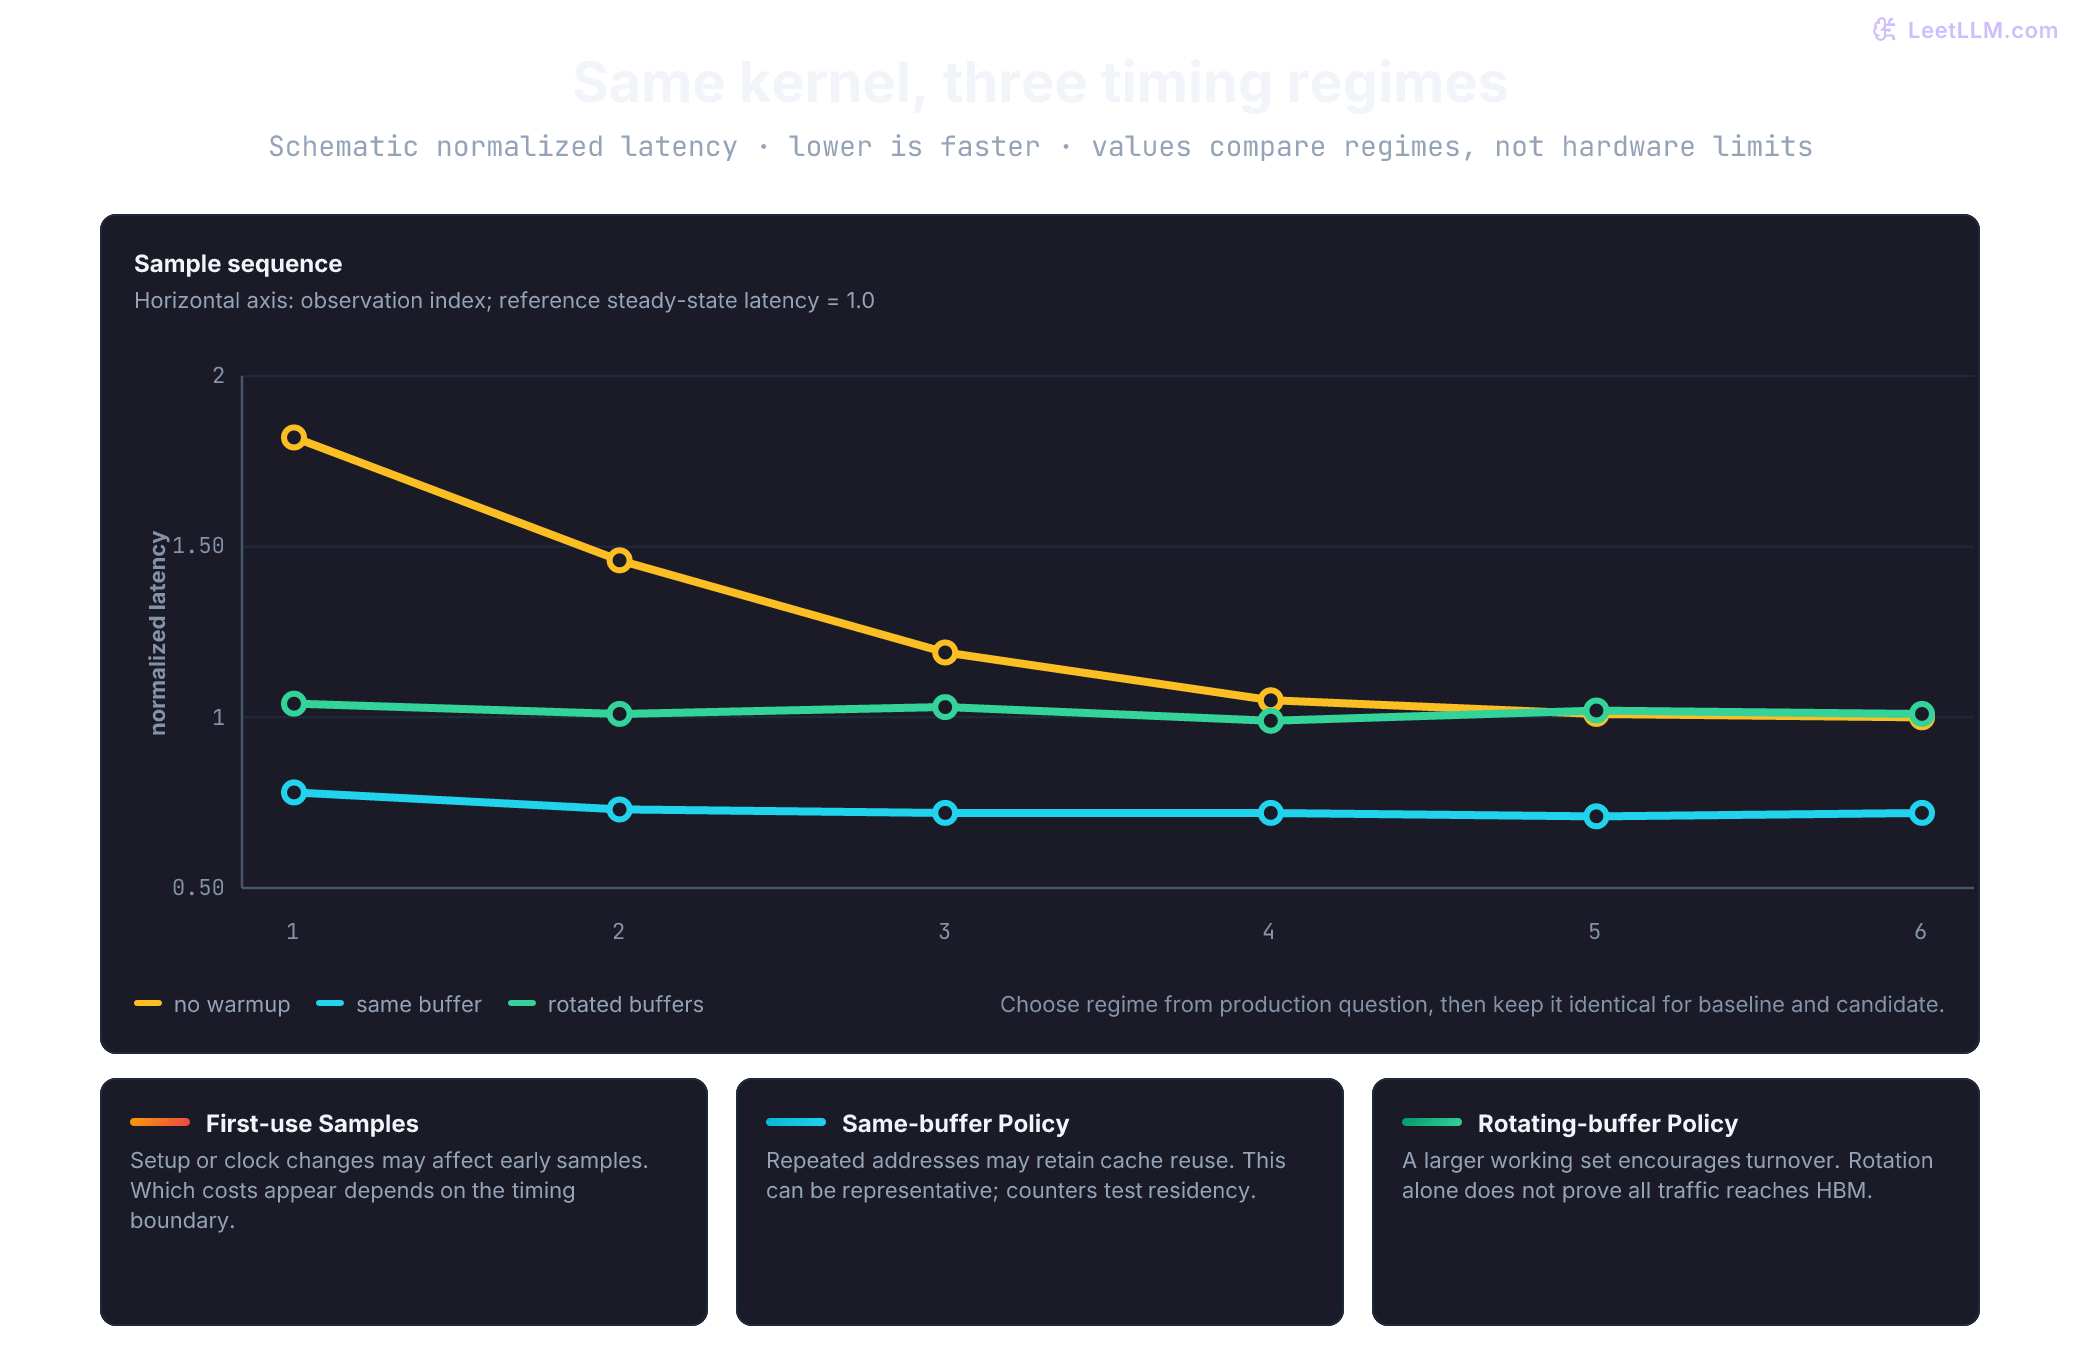
First use can include initialization, allocation, module loading, compilation, and clock changes. Which costs appear in samples depends on the timing boundary. This starter initializes the runtime and allocates buffers before timing; warming its kernel loop doesn't measure those earlier costs.
Use preliminary runs to choose a warmup policy based on latency and observed state, then freeze it before comparing versions. Stable samples don't prove every mechanism is stationary. Preserve later slow samples and investigate their cause; thermal or power throttling during sustained execution belongs in the evidence.
Record clocks, power, and thermal state
GPU clocks dynamically adjust based on thermal headroom, power limits, and concurrent workloads. A candidate kernel measured after the card has heated up can appear slower even when its instruction stream is superior. NVIDIA System Management Interface (nvidia-smi) provides scriptable state queries:[10]
nvidia-smi --query-gpu=timestamp,uuid,name,driver_version,pstate,clocks.sm,clocks.mem,temperature.gpu,power.draw,power.limit --format=csvOn dedicated hardware where you control the clock policy, a supported SM clock lock can reduce frequency variation. Select one GPU and a requested frequency appropriate to it. This example's UUID and 1,500 MHz are inputs to replace, not universal settings:[10]
BENCH_GPU_UUID="GPU-replace-with-UUID"
BENCH_SM_MHZ=1500
sudo nvidia-smi -i "$BENCH_GPU_UUID" --lock-gpu-clocks="$BENCH_SM_MHZ,$BENCH_SM_MHZ"
Record the prior clock policy and restore it afterward. nvidia-smi -i "$BENCH_GPU_UUID" --reset-gpu-clocks restores defaults, rather than an earlier custom lock. A requested SM lock doesn't lock memory clocks or prevent thermal and power limits from reducing frequency. Record observed SM and memory clocks, not just requested settings.
When locking is unavailable, record observed state around each round and use time-series monitoring where possible. Before/after snapshots can miss changes inside a run. If versions experienced different thermal, power, or competing-work conditions, investigate and repeat rather than treating the pair as controlled.
Preserve the distribution with alternating paired rounds (ABBA)
Reporting only the minimum execution time rewards random noise. Reporting a single mean obscures bimodal behavior and tail latency. Preserve raw samples, reporting sample count, median, p10, p90, and the p10-to-p90 spread.
An A, B, B, A order balances which implementation runs earlier and later, reducing systematic order bias. It doesn't prevent thermal drift or background work. Preserve block identity and state observations. Within each round , summarize the matched A blocks and B blocks with the same rule, then compute:
Then examine round-level speedups. A win followed by a loss shows a reversal; it doesn't identify thermal equilibrium as the cause. Inspect state and raw samples, and collect more balanced rounds. Define any uncertainty interval's method and unit of resampling; thousands of correlated launches aren't thousands of independent rounds.
Two controlled rounds produce baseline and candidate medians of (12, 10) and (9, 10) microseconds. What are the round speedups, and why is one pooled speedup inadequate?
Answer
The round speedups are and . The candidate wins one round and loses the other, so pooling samples into one number would hide a reversal that may come from drift or an unstable effect. Report both round-level results, inspect clocks and temperature, and collect more alternating rounds before making a speed claim.
Gate 4: Hardware Roofline and Speed-of-Light bounds
The Roofline model bounds attainable performance by the smaller of the compute ceiling and the bandwidth ceiling scaled by arithmetic intensity:[11]
Nsight Compute plots the achieved point against precision- and device-specific ceilings. The sloped region represents the memory-bandwidth bound; the flat region represents the peak-compute bound. The ridge is their intersection.[5]
For triad, algorithmic intensity begins near 0.167 FLOPs/byte. Compare byte counts and bandwidth at the same memory level: an L2 hit is still an input load, but not an HBM read. More than 12 HBM bytes per element can indicate transaction inefficiency or redundant traffic; fewer can indicate cache reuse or another traffic-reducing mechanism. Under a genuinely streaming regime, approaching both the useful-byte floor and the bandwidth roof leaves little for shared-memory staging to remove.
Read several sections together:
| Nsight Compute evidence | Question answered | Sound next move |
|---|---|---|
LaunchStats | Did grid, block, registers, or shared memory constrain launch? | change launch resources only when metric identifies pressure |
SpeedOfLight | Which compute or memory paths approach throughput ceiling? | inspect saturated path and corroborating stalls |
MemoryWorkloadAnalysis | How much traffic reaches cache levels and device memory? | compare measured bytes with algorithmic minimum |
| Roofline chart | Does achieved point sit in bandwidth or compute region? | target bytes/reuse on slope; target math pipeline near flat roof |
One percentage isn't diagnosis. Low compute utilization can mean memory limit, too little parallel work, launch overhead, dependencies, or host starvation. High device-memory utilization can coexist with wasteful transactions. Roofline locates achieved point; system trace and detailed counters explain why it landed there.
For streaming triad, test this hypothesis:
- Reference and sanitizer pass.
- Nsight Systems confirms kernel dominates selected scope rather than copies or host gaps.
- Nsight Compute shows low arithmetic intensity and strong device-memory pressure.
- Measured bytes per element are compared with 12-byte algorithmic floor.
- Optimization targets excess traffic or access order. Shared memory is rejected when it can't remove compulsory traffic.
If the measurements don't support that sequence, revise the hypothesis before changing the kernel.
Nsight Compute places triad_f32 near the sloped bandwidth roof, but Nsight Systems shows that the GPU is idle for most of the request while the CPU prepares inputs. What can you conclude, and which scope should you optimize first?
Answer
You can conclude that the isolated kernel is probably bandwidth-limited under the profiled workload. You can't conclude that kernel tuning will materially improve request latency. The system trace identifies CPU preparation on the request's critical path, so measure and repair that wider bottleneck before spending effort on a kernel already near its roof.
Run the triad investigation: five gates in code
The CUDA lab requires an NVIDIA GPU, a compatible driver/toolkit, and the profiling tools named below. The displayed output is an acceptance shape, not a hardware result. CPU-only checks can validate the arithmetic, host helper functions, and receipt parser, but can't establish device correctness or speed. Compile and collect correctness, sanitizer, and timing receipts on your target device.
The file includes buggy and fixed kernels, deterministic inputs, a CPU reference, event timing, same-buffer and buffer-rotated modes, and raw-sample CSV output. Read it in three parts: kernels and checking helpers, setup and test modes, then the timed loop. --profile launches one fixed kernel as an isolated diagnostic, not a warmed benchmark.
#include <cuda_runtime.h>

#include <algorithm>
#include <cstddef>
#include <cmath>
#include <cstdlib>
#include <fstream>
#include <iomanip>
#include <iostream>
#include <limits>
#include <stdexcept>
#include <string>
#include <utility>
#include <vector>

static void cuda_check(cudaError_t status, const char* call) {
    if (status != cudaSuccess) {
        std::cerr << call << ": " << cudaGetErrorString(status) << "\n";
        std::exit(1);
    }
}

#define CUDA_CHECK(call) cuda_check((call), #call)

__global__ void triad_buggy(
    const float* x,
    const float* z,
    float* y,
    std::size_t n,
    float alpha
) {
    const std::size_t i = static_cast<std::size_t>(blockIdx.x) * blockDim.x + threadIdx.x;
    if (i <= n) {
        y[i] = fmaf(alpha, x[i], z[i]);
    }
}

__global__ void triad_f32(
    const float* x,
    const float* z,
    float* y,
    std::size_t n,
    float alpha
) {
    const std::size_t i = static_cast<std::size_t>(blockIdx.x) * blockDim.x + threadIdx.x;
    if (i < n) {
        y[i] = fmaf(alpha, x[i], z[i]);
    }
}

static void launch_triad(
    bool buggy,
    const float* x,
    const float* z,
    float* y,
    std::size_t n,
    float alpha,
    cudaStream_t stream = nullptr
) {
    if (n == 0) {
        return;
    }
    constexpr int threads = 256;
    const int blocks = static_cast<int>((n + threads - 1) / threads);
    if (buggy) {
        triad_buggy<<<blocks, threads, 0, stream>>>(x, z, y, n, alpha);
    } else {
        triad_f32<<<blocks, threads, 0, stream>>>(x, z, y, n, alpha);
    }
    CUDA_CHECK(cudaGetLastError());
}

struct Verification {
    std::size_t failures;
    double max_abs;
    double max_rel;
};

static Verification compare_outputs(
    const std::vector<float>& x,
    const std::vector<float>& z,
    const std::vector<float>& actual,
    std::size_t n,
    float alpha
) {
    if (x.size() < n || z.size() < n || actual.size() != n || !std::isfinite(alpha)) {
        throw std::invalid_argument("invalid reference inputs or output length");
    }

    constexpr double atol = 2e-6;
    constexpr double rtol = 2e-5;
    Verification result{0, 0.0, 0.0};

    for (std::size_t i = 0; i < n; ++i) {
        const double reference64 = std::fma(
            static_cast<double>(alpha),
            static_cast<double>(x[i]),
            static_cast<double>(z[i])
        );
        const float reference = static_cast<float>(reference64);
        if (!std::isfinite(reference) || !std::isfinite(actual[i])) {
            ++result.failures;
            result.max_abs = result.max_rel = std::numeric_limits<double>::infinity();
            continue;
        }
        const double abs_error = std::abs(
            static_cast<double>(actual[i]) - static_cast<double>(reference)
        );
        const double rel_error = abs_error / std::max(std::abs(static_cast<double>(reference)), 1e-30);
        const double allowed = atol + rtol * std::abs(static_cast<double>(reference));

        result.max_abs = std::max(result.max_abs, abs_error);
        result.max_rel = std::max(result.max_rel, rel_error);
        if (abs_error > allowed) {
            ++result.failures;
        }
    }
    return result;
}

static Verification verify(
    const std::vector<float>& x, const std::vector<float>& z,
    float* device_y, std::size_t n, float alpha
) {
    std::vector<float> actual(n);
    if (n != 0) {
        CUDA_CHECK(cudaMemcpy(actual.data(), device_y, n * sizeof(float), cudaMemcpyDeviceToHost));
    }
    return compare_outputs(x, z, actual, n, alpha);
}

static void fill_inputs(
    std::vector<float>& x,
    std::vector<float>& z,
    unsigned int seed,
    float alpha
) {
    for (std::size_t i = 0; i < x.size(); ++i) {
        const int x_code = static_cast<int>((i * 29 + seed * 17) % 251) - 125;
        const int z_code = static_cast<int>((i * 31 + seed * 13) % 239) - 119;
        x[i] = static_cast<float>(x_code) / 63.0f;
        z[i] = static_cast<float>(z_code) / 71.0f;
        if (i % 4096 == 0) {
            x[i] = 0.0f;
            z[i] = 0.0f;
        } else if (i % 4096 == 1) {
            x[i] = 1.0f;
            z[i] = -alpha;
        } else if (i % 4096 == 2) {
            x[i] = 1e10f;
            z[i] = -1e10f;
        }
    }
}

static double percentile(const std::vector<float>& sorted, double q) {
    if (sorted.empty() || !std::isfinite(q) || q < 0.0 || q > 1.0 ||
        !std::is_sorted(sorted.begin(), sorted.end()) ||
        std::any_of(sorted.begin(), sorted.end(), [](float v) { return !std::isfinite(v) || v <= 0; })) {
        throw std::invalid_argument("expected sorted, finite positive samples and q in [0, 1]");
    }
    const double position = q * (sorted.size() - 1);
    const auto lower = static_cast<std::size_t>(std::floor(position));
    const auto upper = static_cast<std::size_t>(std::ceil(position));
    return sorted[lower] + (position - lower) * (static_cast<double>(sorted[upper]) - sorted[lower]);
}

static std::string cuda_version(int encoded) {
    return std::to_string(encoded / 1000) + "." + std::to_string((encoded % 1000) / 10);
}

int main(int argc, char** argv) {
    const std::string mode = argc > 1 ? argv[1] : "--check";
    const bool bench_hot = mode == "--bench-hot";
    const bool bench_rotate = mode == "--bench-rotate";
    const bool benchmark = bench_hot || bench_rotate;

    if (
        argc > 3 ||
        (
            mode != "--check" &&
            mode != "--buggy" &&
            mode != "--profile" &&
            !benchmark
        )
    ) {
        std::cerr << "usage: ./triad_bench [--check|--buggy|--profile|--bench-hot|--bench-rotate] [samples.csv]\n";
        return 2;
    }
    if (argc == 3 && !benchmark) {
        std::cerr << "a sample CSV path is valid only for benchmark modes\n";
        return 2;
    }

    constexpr std::size_t n = 1'000'003;
    constexpr float alpha = 1.25f;
    const std::size_t bytes = n * sizeof(float);

    cudaDeviceProp properties{};
    CUDA_CHECK(cudaGetDeviceProperties(&properties, 0));
    int runtime_version = 0;
    int driver_api_version = 0;
    CUDA_CHECK(cudaRuntimeGetVersion(&runtime_version));
    CUDA_CHECK(cudaDriverGetVersion(&driver_api_version));
    std::cout << "device=" << properties.name
              << " compute_capability=" << properties.major << "." << properties.minor
              << " l2_bytes=" << properties.l2CacheSize
              << " cuda_runtime=" << cuda_version(runtime_version)
              << " cuda_driver_api=" << cuda_version(driver_api_version) << "\n";

    std::vector<float> host_x(n);
    std::vector<float> host_z(n);
    fill_inputs(host_x, host_z, 7, alpha);

    int slots = 1;
    if (bench_rotate) {
        const std::size_t slot_bytes = 3 * bytes;
        const std::size_t target_bytes = std::max(
            8 * slot_bytes,
            2 * static_cast<std::size_t>(properties.l2CacheSize) + slot_bytes
        );
        const std::size_t desired_slots = (target_bytes + slot_bytes - 1) / slot_bytes;

        std::size_t free_bytes = 0;
        std::size_t total_bytes = 0;
        CUDA_CHECK(cudaMemGetInfo(&free_bytes, &total_bytes));
        const std::size_t affordable_slots = std::max<std::size_t>(1, free_bytes / (4 * slot_bytes));
        if (desired_slots > affordable_slots) {
            std::cerr << "buffer rotation needs " << desired_slots * slot_bytes
                      << " bytes but conservative allocation budget is "
                      << affordable_slots * slot_bytes << " bytes\n";
            return 1;
        }
        slots = static_cast<int>(desired_slots);
        std::cout << "rotation_target_bytes=" << target_bytes
                  << " rotation_working_set_bytes=" << slots * slot_bytes
                  << " free_bytes=" << free_bytes
                  << " total_bytes=" << total_bytes << "\n";
    }

    std::vector<float*> xs(slots, nullptr);
    std::vector<float*> zs(slots, nullptr);
    std::vector<float*> ys(slots, nullptr);

    for (int slot = 0; slot < slots; ++slot) {
        fill_inputs(host_x, host_z, 7 + static_cast<unsigned int>(slot), alpha);
        CUDA_CHECK(cudaMalloc(reinterpret_cast<void**>(&xs[slot]), bytes));
        CUDA_CHECK(cudaMalloc(reinterpret_cast<void**>(&zs[slot]), bytes));
        CUDA_CHECK(cudaMalloc(reinterpret_cast<void**>(&ys[slot]), bytes));
        CUDA_CHECK(cudaMemcpy(xs[slot], host_x.data(), bytes, cudaMemcpyHostToDevice));
        CUDA_CHECK(cudaMemcpy(zs[slot], host_z.data(), bytes, cudaMemcpyHostToDevice));
        CUDA_CHECK(cudaMemset(ys[slot], 0xff, bytes));  // NaN poison catches omitted stores.
    }
    fill_inputs(host_x, host_z, 7, alpha);  // Reference for slot zero.

    if (mode == "--buggy") {
        launch_triad(true, xs[0], zs[0], ys[0], n, alpha);
        CUDA_CHECK(cudaDeviceSynchronize());
        std::cout << "buggy launch completed; inspect it under Compute Sanitizer\n";
    } else if (mode == "--profile") {
        launch_triad(false, xs[0], zs[0], ys[0], n, alpha);
        CUDA_CHECK(cudaDeviceSynchronize());
        std::cout << "profile launch complete n=" << n << "\n";
    } else if (mode == "--check") {
        const std::vector<std::pair<std::size_t, unsigned int>> cases = {
            {0, 7}, {1, 7}, {255, 7}, {256, 7}, {257, 7},
            {n, 7}, {n, 19}, {n, 101},
        };
        for (const auto& [test_n, seed] : cases) {
            fill_inputs(host_x, host_z, seed, alpha);
            float *test_x = nullptr, *test_z = nullptr, *test_y = nullptr;
            if (test_n != 0) {
                const auto test_bytes = test_n * sizeof(float);
                CUDA_CHECK(cudaMalloc(reinterpret_cast<void**>(&test_x), test_bytes));
                CUDA_CHECK(cudaMalloc(reinterpret_cast<void**>(&test_z), test_bytes));
                CUDA_CHECK(cudaMalloc(reinterpret_cast<void**>(&test_y), test_bytes));
                CUDA_CHECK(cudaMemcpy(test_x, host_x.data(), test_bytes, cudaMemcpyHostToDevice));
                CUDA_CHECK(cudaMemcpy(test_z, host_z.data(), test_bytes, cudaMemcpyHostToDevice));
                CUDA_CHECK(cudaMemset(test_y, 0xff, test_bytes));
            }
            launch_triad(false, test_x, test_z, test_y, test_n, alpha);
            CUDA_CHECK(cudaDeviceSynchronize());
            const Verification correctness = verify(host_x, host_z, test_y, test_n, alpha);
            std::cout << std::scientific
                      << "seed=" << seed
                      << " n=" << test_n
                      << " correctness=" << (correctness.failures == 0 ? "PASS" : "FAIL")
                      << " failures=" << correctness.failures
                      << " max_abs=" << correctness.max_abs
                      << " max_rel=" << correctness.max_rel << "\n";
            if (test_n != 0) {
                CUDA_CHECK(cudaFree(test_x));
                CUDA_CHECK(cudaFree(test_z));
                CUDA_CHECK(cudaFree(test_y));
            }
            if (correctness.failures != 0) {
                return 1;
            }
        }
    } else {
        launch_triad(false, xs[0], zs[0], ys[0], n, alpha);
        CUDA_CHECK(cudaDeviceSynchronize());
        const Verification correctness = verify(host_x, host_z, ys[0], n, alpha);
        std::cout << std::scientific
                  << "correctness=" << (correctness.failures == 0 ? "PASS" : "FAIL")
                  << " failures=" << correctness.failures
                  << " max_abs=" << correctness.max_abs
                  << " max_rel=" << correctness.max_rel << "\n";

        if (correctness.failures != 0) {
            return 1;
        }

        const int warmup = std::max(20, 2 * slots);
        constexpr int samples = 200;
        for (int i = 0; i < warmup; ++i) {
            const int slot = i % slots;
            launch_triad(false, xs[slot], zs[slot], ys[slot], n, alpha);
        }
        CUDA_CHECK(cudaDeviceSynchronize());

        cudaEvent_t start{};
        cudaEvent_t stop{};
        CUDA_CHECK(cudaEventCreate(&start));
        CUDA_CHECK(cudaEventCreate(&stop));
        std::vector<float> sample_ms;
        sample_ms.reserve(samples);

        for (int i = 0; i < samples; ++i) {
            const int slot = i % slots;
            CUDA_CHECK(cudaEventRecord(start));
            launch_triad(false, xs[slot], zs[slot], ys[slot], n, alpha);
            CUDA_CHECK(cudaEventRecord(stop));
            CUDA_CHECK(cudaEventSynchronize(stop));
            float elapsed_ms = 0.0f;
            CUDA_CHECK(cudaEventElapsedTime(&elapsed_ms, start, stop));
            if (!std::isfinite(elapsed_ms) || elapsed_ms <= 0.0f) {
                std::cerr << "invalid timing sample; increase the measurement window\n";
                return 1;
            }
            sample_ms.push_back(elapsed_ms);
        }

        // Check every rotated slot after timing, outside all event intervals.
        for (int slot = 0; slot < slots; ++slot) {
            fill_inputs(host_x, host_z, 7 + static_cast<unsigned int>(slot), alpha);
            const auto checked = verify(host_x, host_z, ys[slot], n, alpha);
            if (checked.failures != 0) {
                std::cerr << "post-timing verification failed for slot " << slot << "\n";
                return 1;
            }
        }
        std::cout << "post_timing_slots_checked=" << slots << "\n";

        const std::string sample_path = argc == 3
            ? argv[2]
            : (bench_hot ? "samples-hot.csv" : "samples-rotate.csv");
        std::ofstream sample_file(sample_path);
        if (!sample_file) {
            std::cerr << "could not open sample CSV: " << sample_path << "\n";
            return 1;
        }
        sample_file << "sample,slot,elapsed_us\n" << std::fixed << std::setprecision(6);
        for (int i = 0; i < samples; ++i) {
            sample_file << i << "," << i % slots << "," << sample_ms[i] * 1000.0 << "\n";
        }
        sample_file.close();
        if (!sample_file) {
            std::cerr << "failed to persist complete sample CSV\n";
            return 1;
        }

        std::vector<float> sorted_ms = sample_ms;
        std::sort(sorted_ms.begin(), sorted_ms.end());
        const double p10_ms = percentile(sorted_ms, 0.10);
        const double median_ms = percentile(sorted_ms, 0.50);
        const double p90_ms = percentile(sorted_ms, 0.90);
        const double useful_gb_s = (3.0 * bytes) / (median_ms / 1000.0) / 1e9;

        std::cout << std::fixed << std::setprecision(3)
                  << "regime=" << (bench_hot ? "same-buffer" : "buffer-rotated")
                  << " slots=" << slots
                  << " warmup=" << warmup
                  << " samples=" << samples
                  << " raw_samples=" << sample_path << "\n"
                  << "p10_us=" << p10_ms * 1000.0
                  << " median_us=" << median_ms * 1000.0
                  << " p90_us=" << p90_ms * 1000.0 << "\n"
                  << "useful_gb_s=" << useful_gb_s
                  << " (12 algorithmic bytes per element)\n";

        CUDA_CHECK(cudaEventDestroy(start));
        CUDA_CHECK(cudaEventDestroy(stop));
    }

    for (int slot = 0; slot < slots; ++slot) {
        CUDA_CHECK(cudaFree(xs[slot]));
        CUDA_CHECK(cudaFree(zs[slot]));
        CUDA_CHECK(cudaFree(ys[slot]));
    }
    return 0;
}
Compile with optimization and line information. Line information lets sanitizer and profiler reports point back to source without using debug build as performance binary:
mkdir -p receipts
set -o pipefail
nvcc -O3 -lineinfo -std=c++17 triad_bench.cu -o triad_bench && \
  ./triad_bench --check | tee receipts/correctness.txt
A correct run prints the target device and a complete elementwise check. The output below describes the required shape, not a recorded CUDA run. Inspect the actual error values rather than requiring the zeros shown here. This fixed-size starter isn't a general allocator or launch planner; larger shapes need device-limit and integer-overflow checks too.
device=<your GPU> compute_capability=<major.minor> l2_bytes=<bytes> cuda_runtime=<major.minor> cuda_driver_api=<major.minor>
seed=7 n=0 correctness=PASS failures=0 max_abs=0.000000e+00 max_rel=0.000000e+00
seed=7 n=1 correctness=PASS failures=0 max_abs=0.000000e+00 max_rel=0.000000e+00
seed=7 n=255 correctness=PASS failures=0 max_abs=0.000000e+00 max_rel=0.000000e+00
seed=7 n=256 correctness=PASS failures=0 max_abs=0.000000e+00 max_rel=0.000000e+00
seed=7 n=257 correctness=PASS failures=0 max_abs=0.000000e+00 max_rel=0.000000e+00
seed=7 n=1000003 correctness=PASS failures=0 max_abs=0.000000e+00 max_rel=0.000000e+00
seed=19 n=1000003 correctness=PASS failures=0 max_abs=0.000000e+00 max_rel=0.000000e+00
seed=101 n=1000003 correctness=PASS failures=0 max_abs=0.000000e+00 max_rel=0.000000e+00
Now run the deliberately wrong i <= n guard under memcheck. --error-exitcode 99 makes a detected sanitizer error fail automation even when the target process exits cleanly, and pipefail keeps tee from hiding that status:
set -o pipefail
compute-sanitizer --error-exitcode 99 --tool memcheck --padding 32 ./triad_bench --buggy 2>&1 \
  | tee receipts/memcheck-buggy.txt
Because the grid rounds up and , a thread with i == n executes. The report should identify an invalid global access in triad_buggy. Padding improves detection when adjacent allocations might otherwise hide an overrun. Without the sanitizer, the launch may appear to complete. Use the fixed mode with i < n, then require a clean report.[3]
set -o pipefail
compute-sanitizer --error-exitcode 99 --tool memcheck --padding 32 ./triad_bench --check 2>&1 \
| tee receipts/memcheck-fixed.txtERROR SUMMARY: 0 errorsRun initcheck when a candidate changes which global data is initialized or read; it doesn't require shared memory. Add racecheck for shared-memory communication and synccheck for synchronization changes. None replaces memcheck or numerical comparison.
Capture the system timeline next. Timings printed while the profiler is attached are diagnostic only:
nsys profile \
  --trace=cuda,osrt \
  --sample=none \
  --output=receipts/triad_systems \
  ./triad_bench --bench-rotate receipts/nsys-diagnostic-samples.csv
The full trace includes allocations, setup copies, the initial correctness readback, warmup, 200 timed launches, and final per-slot verification copies. Only the event-bounded sample region claims to exclude copies. Inside it, expect one launch and one event wait per sample; investigate long host gaps rather than mistaking setup or verification for timed work.
List the installed sections before collecting a kernel profile. Section sets vary by installation; don't assume a set named roofline exists. The command names four standard sections and makes cache flushing explicit. --clock-control none leaves existing clock policy unchanged.[12]
ncu --list-sets
ncu --list-sections
ncu \
  --section LaunchStats \
  --section SpeedOfLight \
  --section MemoryWorkloadAnalysis \
  --section SpeedOfLight_RooflineChart \
  --cache-control all \
  --clock-control none \
  --launch-count 1 \
  --export receipts/triad_compute \
  ./triad_bench --profile
On a locked-down host, ncu may return ERR_NVGPUCTRPERM. Counter-access policy blocked metric collection; the kernel didn't fail. Use an approved profiling host or ask an administrator to enable performance counters rather than changing privilege policy on a shared machine.[5]
Read the achieved point, device-memory bytes, cache behavior, and SpeedOfLight sections together. Compare measured traffic per element with the 12-byte algorithmic count. Useful bandwidth above the device's HBM specification can reflect data served by cache, rather than impossible hardware performance.
This isolated, cache-flushed profile doesn't establish the residency of the clean same-buffer benchmark. Nsight Compute normally flushes caches between replay passes and may control clocks; replay mode also changes execution. For a cache-primed application, a separately designed experiment can use application replay with --cache-control none so its setup is repeated for each pass. Record these choices and never mix a cold profile's byte count with a hot run's elapsed time in one Roofline point.[5]
Finally collect clean timing outside tools:
set -o pipefail
nvidia-smi --query-gpu=timestamp,uuid,name,driver_version,pstate,clocks.sm,clocks.mem,temperature.gpu,power.draw,power.limit --format=csv \
  | tee receipts/gpu-state-before.csv

./triad_bench --bench-hot receipts/bench-hot-samples.csv | tee receipts/bench-hot.txt
./triad_bench --bench-rotate receipts/bench-rotate-samples.csv | tee receipts/bench-rotate.txt

nvidia-smi --query-gpu=timestamp,uuid,name,driver_version,pstate,clocks.sm,clocks.mem,temperature.gpu,power.draw,power.limit --format=csv \
  | tee receipts/gpu-state-after.csv
The starter warms for at least 20 launches and enough launches to touch every rotation slot twice. Treat that as an initial policy, not proof of steady state. Increase it if latency, clocks, temperature, or cache counters haven't stabilized on the target machine.
The post-timing check validates each slot's final output, not every intermediate launch. Keep adversarial correctness runs separate so an intermittent omitted store can't hide behind a previous correct value. Record nvcc, nsys, ncu, and compute-sanitizer versions alongside the exact commands; profiler section availability and supported metrics vary by tool and GPU.
--bench-hot is a convenient flag name, not evidence of cache residency: the program reports it as same-buffer. Percentiles use linear interpolation at index , so an even-count median averages the middle pair. Samples remain in acquisition order in the CSV. Match the selected CUDA device to its UUID, especially when CUDA_VISIBLE_DEVICES remaps ordinals; a GPU name alone isn't enough on a multi-GPU host.
Don't compare a hot baseline with a rotated candidate. Run both versions in the same regime and alternate order across rounds.
Diagnose contradictory evidence
GPU investigations often return signals that look inconsistent. Resolve by asking which scope each signal describes.
| Observation | Tempting conclusion | Better diagnosis | Next check |
|---|---|---|---|
| host timer is tiny | kernel is fast | timer stopped after enqueue | CUDA events or synchronized boundary |
| sanitizer fails but sampled outputs match | error is harmless | illegal access missed sampled state | reject candidate and repair bounds |
nvidia-smi utilization is high | kernel is efficient | GPU stayed busy doing some work | Nsight Systems critical path, then kernel counters |
| SpeedOfLight memory percentage is high | no optimization remains | one memory path is busy, perhaps wastefully | bytes per element and transaction efficiency |
| cache-hot timing wins | candidate is universally faster | benchmark changed residency regime | same-buffer versus rotated A/B under same policy |
| profiler duration is slower | optimization regressed | instrumentation or replay perturbed execution | clean rerun outside profiler |
| median improves while p90 worsens | clear win | distribution changed or throttling emerged | raw samples, clocks, power, temperature, paired order |
| kernel improves but request latency doesn't | profiler is wrong | optimized scope isn't end-to-end bottleneck | return to Nsight Systems and critical path |
Failure diagnosis should end with one controlled experiment. Changing block size, vector width, memory layout, and dtype together destroys attribution even if final number improves.
Gate 5: Reproducible receipts and machine-readable evidence
A chat message saying “A is faster” isn't reproducible. Save a machine-readable receipt plus raw artifacts. At minimum, another engineer should know exactly what ran, where it ran, what passed, and which files support the claim.
{
  "claim": "candidate lowers buffer-rotated triad_f32 kernel latency versus baseline",
  "source": {
    "repository": "<repository URL>",
    "commit": "<full commit SHA>",
    "file_sha256": "<triad_bench.cu SHA-256>",
    "binary_sha256": "<candidate binary SHA-256>",
    "compiler": "nvcc <version>",
    "flags": ["-O3", "-lineinfo", "-std=c++17"]
  },
  "baseline_source": {
    "commit": "<baseline full commit SHA>",
    "file_sha256": "<baseline source SHA-256>",
    "binary_sha256": "<baseline binary SHA-256>"
  },
  "hardware": {
    "gpu_uuid": "<GPU UUID>",
    "gpu_name": "<exact model>",
    "compute_capability": "<major.minor>",
    "driver": "<driver version>",
    "cuda_runtime": "<runtime version>",
    "power_limit_w": "<watts>",
    "clock_policy": "observed or locked",
    "isolation": "<exclusive host, MIG slice, or competing-work policy>"
  },
  "workload": {
    "operation": "y[i] = fmaf(1.25f, x[i], z[i])",
    "dtype": "float32",
    "n": 1000003,
    "threads_per_block": 256,
    "cache_regime": "buffer-rotated",
    "rotation_slots": "<measured run value>"
  },
  "correctness": {
    "reference": "CPU double FMA, one cast to float",
    "atol": 0.000002,
    "rtol": 0.00002,
    "failures": "<measured count>",
    "memcheck_errors": "<parsed count>",
    "sanitizer_exit_status": "<actual exit status>",
    "sanitizer_version": "<version>"
  },
  "measurement": {
    "timer": "CUDA events in kernel stream",
    "warmup": "<count and stability rule>",
    "samples": 200,
    "rounds": "<count>",
    "order": "ABBA within each round",
    "raw_samples": ["<round/block-specific baseline CSVs>", "<round/block-specific candidate CSVs>"],
    "raw_sample_sha256": "<digest for each artifact>",
    "quantiles": "linear interpolation at q*(N-1)",
    "profiler_attached": false
  },
  "artifacts": {
    "systems": "triad_systems.nsys-rep",
    "compute": "triad_compute.ncu-rep",
    "sanitizer": "memcheck-fixed.txt",
    "gpu_state_before": "gpu-state-before.csv",
    "gpu_state_after": "gpu-state-after.csv"
  },
  "result": {
    "baseline_median_us": "<value>",
    "candidate_median_us": "<value>",
    "round_speedup_median": "<value>",
    "round_speedup_interval": "<method and bounds>",
    "end_to_end_effect": "<measured separately or explicitly out of scope>"
  }
}
Store reports with the source revision, not in a personal profiler workspace that disappears. Hash the source and raw sample files. If the workload contains proprietary input, archive the deterministic generator, shape distribution, and a redacted data fingerprint so the receipt remains useful without leaking data.
The Python fixture below reads real temporary CSV files containing synthetic timings. It checks saved-byte hashes, sample order, positive finite durations, and matching comparison conditions before computing one round's ratio. It deliberately doesn't print “claim ready”: artifact integrity and a favorable ratio don't prove correctness, representative hardware conditions, or a repeatable improvement.
import csv
import hashlib
import io
import math
from pathlib import Path
from statistics import median
from tempfile import TemporaryDirectory

def read_samples(path, expected_sha256, slots):
    if type(slots) is not int or slots < 1:
        raise ValueError("positive slot count required")
    data = Path(path).read_bytes()
    if hashlib.sha256(data).hexdigest() != expected_sha256:
        raise ValueError("sample artifact changed")
    rows = csv.DictReader(io.StringIO(data.decode("utf-8")))
    if rows.fieldnames != ["sample", "slot", "elapsed_us"]:
        raise ValueError("unexpected CSV schema")
    samples = []
    for index, row in enumerate(rows):
        if None in row or any(value is None for value in row.values()):
            raise ValueError("malformed row")
        if int(row["sample"]) != index or int(row["slot"]) != index % slots:
            raise ValueError("sample sequence or rotation mismatch")
        elapsed = float(row["elapsed_us"])
        if not math.isfinite(elapsed) or elapsed <= 0:
            raise ValueError("duration must be finite and positive")
        samples.append(elapsed)
    if len(samples) < 2:
        raise ValueError("at least two samples required")
    return samples

def compare_pair(baseline, candidate):
    required = {"n", "dtype", "cache_regime", "slots", "gpu_uuid", "timer"}
    for record in (baseline, candidate):
        conditions = record["conditions"]
        if set(conditions) != required:
            raise ValueError("comparison conditions incomplete")
        if type(conditions["n"]) is not int or conditions["n"] < 1:
            raise ValueError("positive integer element count required")
        if conditions["dtype"] != "float32":
            raise ValueError("this lab requires float32")
        slots, regime = conditions["slots"], conditions["cache_regime"]
        if type(slots) is not int or slots < 1:
            raise ValueError("positive slot count required")
        if not ((regime == "same-buffer" and slots == 1)
                or (regime == "buffer-rotated" and slots >= 2)):
            raise ValueError("cache policy and slot count disagree")
        if any(not isinstance(conditions[key], str) or not conditions[key].strip()
               for key in ("gpu_uuid", "timer")):
            raise ValueError("device and timer labels required")
    if baseline["conditions"] != candidate["conditions"]:
        raise ValueError("comparison conditions differ")
    a, b = [read_samples(r["path"], r["sha256"], r["conditions"]["slots"])
            for r in (baseline, candidate)]
    if len(a) != len(b):
        raise ValueError("different sample counts")
    a_median, b_median = median(a), median(b)
    ratio = a_median / b_median
    if not all(math.isfinite(value) and value > 0 for value in (a_median, b_median, ratio)):
        raise ValueError("invalid derived statistic")
    return a_median, b_median, ratio

conditions = {"n": 1_000_003, "dtype": "float32", "cache_regime": "buffer-rotated",
              "slots": 2, "gpu_uuid": "fixture-only", "timer": "synthetic"}
with TemporaryDirectory() as directory:
    records = []
    for name, values in (("baseline", [102, 101, 104, 100, 103]),
                         ("candidate", [82, 81, 83, 80, 82])):
        path = Path(directory) / f"{name}.csv"
        text = "sample,slot,elapsed_us\n" + "".join(
            f"{i},{i % 2},{value}\n" for i, value in enumerate(values))
        path.write_text(text, encoding="utf-8")
        records.append({"path": path, "sha256": hashlib.sha256(path.read_bytes()).hexdigest(),
                        "conditions": conditions.copy()})
    a, b, ratio = compare_pair(*records)
    print(f"synthetic medians: {a:g} us and {b:g} us; ratio {ratio:.2f}x")
    print("timing direction:", "improvement" if ratio > 1 else "no improvement")
    records[1]["path"].write_text("truncated", encoding="utf-8")
    try:
        compare_pair(*records)
    except ValueError as error:
print("after artifact change:", error)synthetic medians: 102 us and 82 us; ratio 1.24x
timing direction: improvement
after artifact change: sample artifact changedA hash binds a receipt to bytes; it doesn't prove those bytes came from a GPU. Collect hardware state, source identity, correctness logs, sanitizer exit status, and timing artifacts through a trusted harness. This small parser checks timing-file integrity and the lab's declared conditions, not that entire collection process. Run it per matched round, then examine the round-level distribution.
Matching metadata can still be invalid metadata. Python considers True == 1, so dictionary equality alone won't validate an element count. Predict which declarations the same parser rejects below. These remain synthetic files; the checks don't authenticate a GPU UUID or verify a timing method.
with TemporaryDirectory() as directory:
    path = Path(directory) / "samples.csv"
    path.write_text("sample,slot,elapsed_us\n0,0,10\n1,1,11\n", encoding="utf-8")
    digest = hashlib.sha256(path.read_bytes()).hexdigest()
    for label, change in (("boolean length", {"n": True}),
                          ("wrong dtype", {"dtype": "float16"}),
                          ("one rotating slot", {"slots": 1}),
                          ("missing timer", {"timer": ""})):
        record = {"path": path, "sha256": digest, "conditions": conditions | change}
        try:
            compare_pair(record, record)
        except ValueError as error:
            print(f"{label}: {error}")
        else:
raise AssertionError("invalid declaration accepted")boolean length: positive integer element count required
wrong dtype: this lab requires float32
one rotating slot: cache policy and slot count disagree
missing timer: device and timer labels requiredDefend the claim in another engineer's rerun
Before choosing a candidate, ask a colleague to reproduce one matched round from the receipt. Can they identify the intended operation, replay the correctness cases, select the same GPU, explain the cache policy, and regenerate the summaries from saved samples? If a missing setting changes the outcome, improve the experiment before arguing about the ratio.
A fast kernel is useful only when it preserves the approved numerical contract and improves the intended scope. The isolated triad result is one piece of that evidence, not a promise about request latency.
Mastery check
Evaluation rubric
- Foundational: Separate reference checking, sanitizer evidence, profiler diagnosis, and clean timing into distinct runs.
- Intermediate: Compute useful bandwidth from declared algorithmic bytes while distinguishing it from measured HBM traffic.
- Advanced: Design alternating benchmark rounds, interpret system and kernel profiles at their proper scopes, and defend a speedup from a reproducible evidence receipt.
Common pitfalls
- Treating a clean sampled output as proof that an illegal memory access is harmless.
- Comparing a cache-hot candidate with a buffer-rotated baseline.
- Publishing profiler duration as clean latency or pooling samples across drifting rounds.
Follow-up questions
Why can an i <= n kernel pass an elementwise check for n=257 when its allocation has 512 elements?
Answer
It writes all 257 logical outputs correctly and also writes element 257. A comparison restricted to the logical output misses that extra store, while a memory checker sees an allocation-valid access. Use exact-sized allocations, output poisoning, and sanitizer padding to expose different parts of the failure.
A warm same-buffer run is fast, but a cache-flushed Nsight Compute report shows high HBM traffic. Can you divide that report's bytes by the warm event duration?
Answer
No. The numerator and denominator describe different cache regimes. Use traffic and duration from a consistent profiling experiment for its Roofline point, and report the clean benchmark separately. Record replay, cache, and clock controls so the difference is interpretable.