Personalize this lesson
Adapt explanations and teaching visuals to your background and preferred voice.
You change four lines of CUDA, recompile, and watch the kernel runtime drop by 40%. It feels like an instant win until your verification pass flags thousands of stale NaN values across the output matrix. The optimization didn't win anything; it just computed garbage at breakneck speed.
The investigation starts with a hypothesis about the bottleneck. Change one mechanism, check bit-exact output on boundary shapes, and see whether counters and timing support the prediction. A counter can corroborate an explanation; it doesn't prove that explanation is the only cause of a timing change.
You'll optimize an out-of-place single-precision () matrix transpose. It preserves values without floating-point arithmetic: one logical input read and output write per element. That makes address order easy to study. Indexing, predicates, barriers, instruction issue, insufficient parallelism, and launch gaps can still contribute to elapsed time.
Three prerequisites supply the vocabulary. CUDA for ML Training established grids, blocks, warps, asynchronous launches, and memory hierarchy. Accelerator Architecture Field Guide connected arithmetic intensity and resource ceilings to workload bounds. GPU Profiling, Correctness, and Benchmarking separated host timelines, kernel counters, and correctness evidence. Here those ideas control one kernel from first measurement through recovery.
Keep one experiment stable
The workload transposes an row-major float32 matrix into a separate output allocation. This is an out-of-place transpose; passing overlapping input and output would violate the contract. If lives at input[r * N + c], the output satisfies:
No floating-point arithmetic changes a value. The checker compares each float's 32-bit representation via bitwise equality, not a tolerance or checksum. It also reports maximum absolute error as a diagnostic; the mismatch count decides correctness. Positive and negative zero differ in bits even though their absolute difference is zero.
The harness limits N to 4096 and fills input with integers from zero through . At the largest shape, that ends at , within float32's consecutive exact-integer range. Unique values expose wrong permutations. Before each standalone validation launch, the harness fills every output byte with 0xff, producing NaN words. A skipped store fails instead of inheriting a previous correct value. These generated cases don't exercise every possible float bit pattern.
The supplied harness contains five variants:
| Variant | Purpose | Included in normal benchmark? |
|---|---|---|
copy | reads and writes every element without transposing, giving a same-harness memory-movement reference | yes |
naive | reads adjacent input words but writes the transpose with stride | yes |
tiled | stages a tile in shared memory so global reads and writes are adjacent | yes |
padded | changes shared tile to so column reads spread across banks | yes |
broken | removes required block barrier to create a shared-memory race | no, run deliberately |
copy isn't a transpose baseline. It performs a different operation with the same logical read and write volume. Treat it as context for the memory path, not as a denominator for a claimed transpose speedup.
Write the hypothesis before editing, reject incorrect candidates, then compare repeated timings under identical conditions. A surprising counter should change the next experiment, not become a story invented after the result.
Build the lab on an NVIDIA GPU
You need an NVIDIA GPU, a CUDA Toolkit with nvcc and Compute Sanitizer, and Nsight Compute's ncu command. Tool versions and GPU identity belong beside every result because compiler decisions, architecture, clocks, and profiler metric availability can change evidence. The coordinate exercises and shared host checker also run on CPU, but they don't establish GPU execution, memory safety, or performance. Collect those results on your target device.
Save the CUDA source and its host-checking header in the same directory. Save the recovery template for the deliberate failure later. The shell commands below target Bash on a CUDA-equipped machine. A CPU or Apple GPU can't execute these CUDA kernels; the later Python exercise checks indexing only.
Create an artifact directory and capture the environment. Keep pipefail enabled so a compiler or CUDA failure isn't hidden by a successful tee:
mkdir -p artifacts/run-01
set -euo pipefail
nvidia-smi -L | tee artifacts/run-01/gpu.txt
nvidia-smi | tee artifacts/run-01/nvidia-smi.txt
nvcc --version | tee artifacts/run-01/nvcc.txt
ncu --version | tee artifacts/run-01/ncu.txt
compute-sanitizer --version | tee artifacts/run-01/compute-sanitizer.txt
sha256sum transpose_lab.cu transpose_checks.hpp | tee artifacts/run-01/source.sha256
Compile optimized C++17 code with line information for attribution. -Xptxas=-v reports kernel resources and spills. -arch=native detects visible supported GPUs and generates their machine code without PTX fallback; it can cover multiple visible architectures. It isn't a portable artifact for arbitrary GPUs. For a separate build host, select targets supported by that Toolkit and the intended GPU.[1]
nvcc -std=c++17 -O3 -arch=native -lineinfo -Xptxas=-v \
  -o transpose_lab transpose_lab.cu \
  2>&1 | tee artifacts/run-01/build.txt
Inspect the build log rather than guessing resource consumption:
- the compiler names each instantiated kernel;
transpose_tiled<0>reserves bytes of static shared memory;transpose_tiled<1>reserves bytes;- register count is recorded directly from
ptxas; - record
spill storesandspill loads; zero is desirable here, but a spill isn't automatically a correctness failure or a slower kernel; - no compilation error is present.
First exercise boundary shapes, including tiles that aren't full. Each command must exit zero:
for n in 1 7 31 32 33 65 257; do
  ./transpose_lab all "$n" 1 > "artifacts/run-01/check-${n}.csv"
done
Then run the fixed performance case for 100 measured launches per normal variant:
./transpose_lab all 4096 100 \
  | tee artifacts/run-01/benchmark.csv
The harness prints CSV columns variant, correct, mismatches, max_abs_error, average_ms, and effective_gb_s. Device and launch shape go to standard error. A fresh-buffer check runs before warmup and another after timing. Failure suppresses performance fields and returns exit code 2. The known-racy broken variant always returns 2 and is never timed, even if its sampled output matches. Runtime or argument errors return 1.
Pass conditions for the four normal variants are:
| Field | Required evidence |
|---|---|
correct | true for copy, naive, tiled, and padded |
mismatches | 0 |
max_abs_error | 0 |
average_ms | positive average CUDA-event interval after five warmup launches |
effective_gb_s | positive logical read-plus-write rate, interpreted only with profiler evidence |
Don't rank variants yet. A single process run can be affected by clocks, device temperature, competing work, or startup state. Repeat separate processes under the same conditions, alternate order by round, and preserve every row:
{
  echo 'round,position,variant,correct,mismatches,max_abs_error,average_ms,effective_gb_s'
  for round in 1 2 3 4 5; do
    if (( round % 2 == 1 )); then
      order=(naive tiled padded)
    else
      order=(padded tiled naive)
    fi
    position=0
    for variant in "${order[@]}"; do
      row=$(./transpose_lab "$variant" 4096 100 2>> artifacts/run-01/repeated-launches.txt | tail -n 1)
      printf '%s,%s,%s\n' "$round" "$position" "$row"
      position=$((position + 1))
    done
  done
} | tee artifacts/run-01/repeated-benchmark.csv
These runs reuse buffers after warmup; they don't establish cache residency or a cold streaming regime. The event interval excludes allocation, transfers, and validation, but includes gaps between host-submitted launches. Each CSV row is one batch's average per launch, not an individual latency sample or a tail percentile. The post-timing correctness launch uses fresh poisoning; it doesn't inspect every timed launch's output. For tiny matrices, launch overhead can dominate. Replay and cache controls can change state, so don't combine profiler counters with clean timing automatically.
Compare repeated samples, not only the best row. Overlapping samples don't by themselves prove equality; report the variation and collect enough evidence to resolve a distinct difference. Don't claim a win from one favorable sample.
Read the naive memory path
CUDA combines a warp's accesses according to address coverage. For compute capability 6.0 and newer, the coalescing model counts the 32-byte sectors needed to service the lanes. A full warp reading adjacent aligned float32 words covers four sectors, not one 32-byte transaction.[2] A request, cache line, sector, and HBM transfer are different units. Nsight Compute's memory tables distinguish them.[3]
The naive kernel reads input with ideal spatial order, then scatters that order on output. Here is the indexing logic from transpose_naive:
__global__ void transpose_naive(float* output, const float* input, int n) {
  const int x = blockIdx.x * kTile + threadIdx.x;
  const int y = blockIdx.y * kTile + threadIdx.y;

  for (int offset = 0; offset < kTile; offset += kBlockRows) {
    if (x < n && y + offset < n) {
      const size_t input_index = static_cast<size_t>(y + offset) * n + x;
      const size_t output_index = static_cast<size_t>(x) * n + y + offset;
      output[output_index] = input[input_index];
    }
  }
}
Look closely at what happens across a single warp (32 threads where threadIdx.y is constant and threadIdx.x runs from 0 through 31):
- Input read:
input_index = (y + offset) * n + x. For the aligned interior case, the 32 lanes cover 128 contiguous bytes in four sectors. Odd row widths can misalign a later row, and edge warps have fewer active lanes. - Output store:
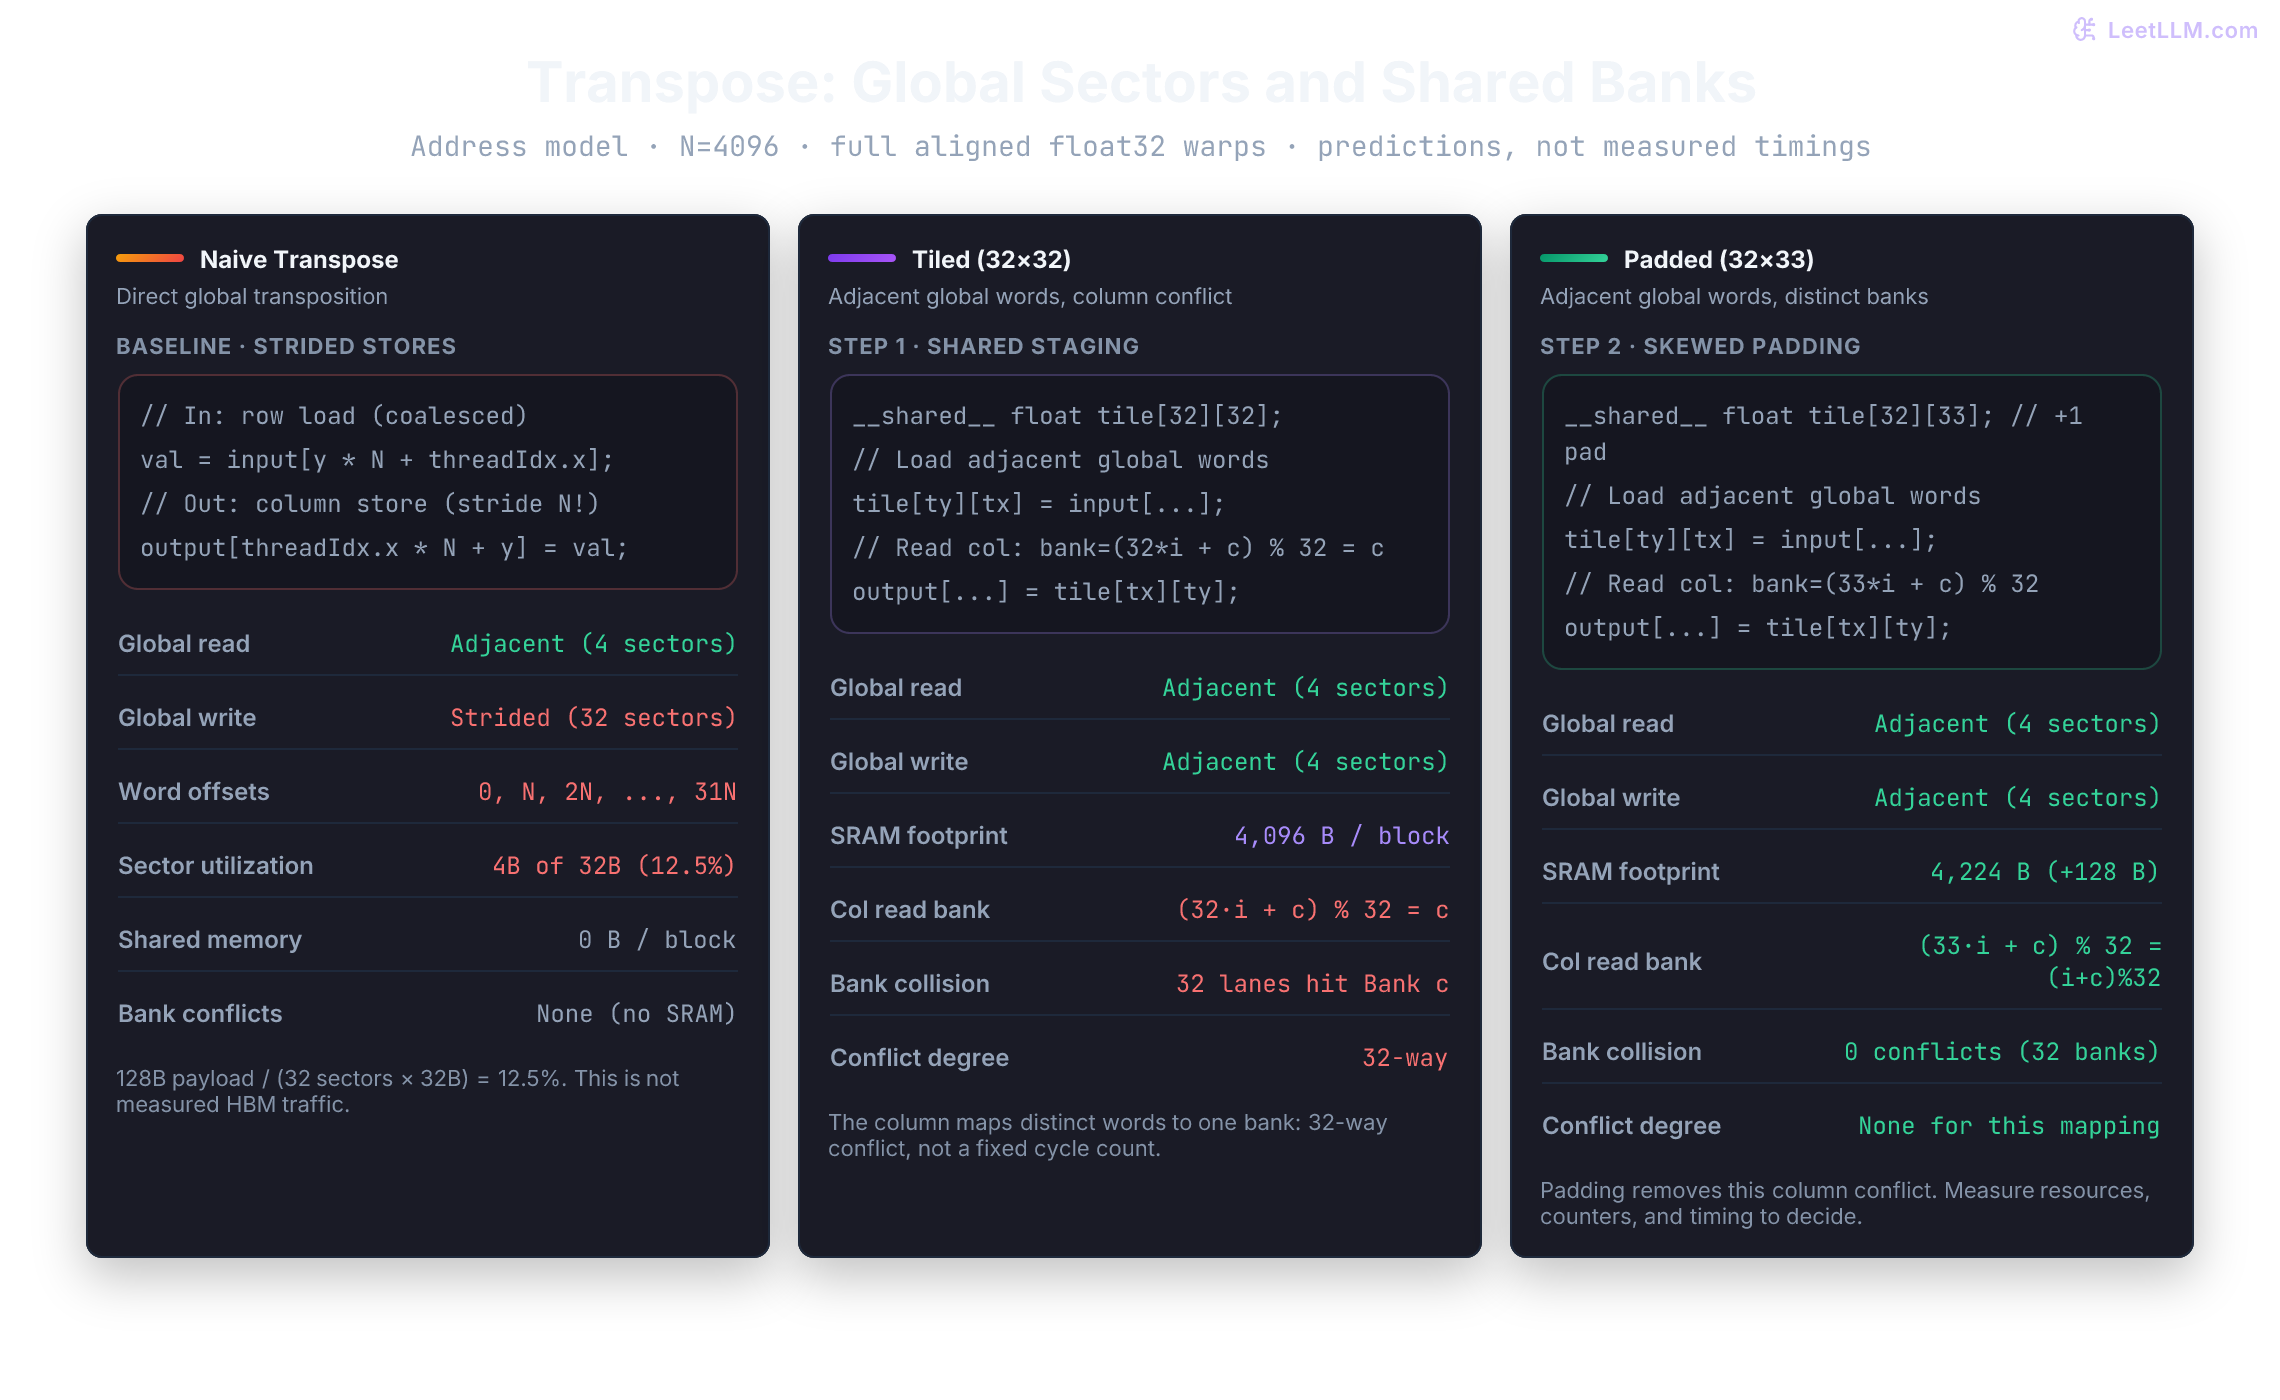
output_index = x * n + (y + offset). Consecutive lanes differ by floats. At , that is 16,384 bytes, or 16 KiB, so each lane reaches a different sector. - Sector coverage: This store instruction has 128 bytes of useful payload spread across 32 sectors. Its payload-to-sector-volume ratio is , compared with 100% for the aligned four-sector model.
That arithmetic predicts inefficient sector coverage at the access stage. It doesn't prove 1,024 bytes crossed HBM for this instruction: cache behavior, merging, write policies, and ECC affect downstream traffic. Identify the pressured stage before naming a DRAM bottleneck.
Transpose does almost no useful floating-point arithmetic. Its logical data volume per launch is one read and one write for every element:
For , that's bytes, or 128 MiB. The harness reports:
Effective bandwidth isn't physical DRAM traffic. Cache hits, excess transactions, error-correction traffic, and architecture-specific paths make hardware traffic differ. Use it as a workload-normalized rate for comparing the same operation on the same setup.
A transpose averages ms. What effective rate should the ledger record, and what hardware claim remains unsupported?
Answer
The logical volume is bytes. Dividing by seconds and then by gives about GB/s. That is a workload-normalized effective rate. It doesn't establish physical DRAM traffic or percentage of peak bandwidth without profiler counters and the matching hardware conditions.
Profile before editing
Nsight Compute groups kernel evidence into named sections. LaunchStats reports grid, block, registers, and shared memory. SpeedOfLight compares compute and memory resource throughput with device ceilings. MemoryWorkloadAnalysis traces traffic through the memory hierarchy. Occupancy reports active-warps capacity and its resource limiters.[3]
Collect the first measured naive launch, skipping its one validation launch and five warmups. The full section set can require replay, so use the unprofiled harness for timing. CLI filters and launch selection are documented separately from the profiling metrics.[4]
ncu --set full \
  --kernel-name-base function \
  --kernel-name transpose_naive \
  --launch-skip 6 \
  --launch-count 1 \
  --force-overwrite \
  -o artifacts/run-01/naive \
  ./transpose_lab naive 4096 1

ncu --import artifacts/run-01/naive.ncu-rep --page details \
  > artifacts/run-01/naive.txt
Read the report in this order:
- Confirm kernel name, matrix size, block
32 x 8, and one profiled launch. - Check whether memory throughput is closer to its ceiling than compute throughput (
dram__throughput.avg.pct_of_peak_sustained_elapsed). - Inspect the L1/TEX memory table's
Sectors/Reqseparately for loads and stores. For this full-warp mapping, predict four load sectors and 32 store sectors per request. The 12.5% payload fraction is address-model arithmetic, rather than a guaranteed metric value or HBM efficiency. Query installed metric names instead of assuming a copied suffix exists. - Check static shared memory is zero for the naive variant.
- Read the occupancy limiter, but don't optimize it unless evidence connects the limiter to latency or throughput.
Low arithmetic intensity makes the memory path the primary suspect, not a confirmed bottleneck. Small launches can instead be dominated by overhead, and even large kernels can hit memory-instruction throughput before DRAM bandwidth. Roofline is a ceiling model, not a promise that every low-intensity kernel reaches peak bandwidth.[5] Use the profiler to identify which resource limits this launch.
Write one bound statement before editing:
Workload: float32 transpose, N=4096, block=32x8
Correctness: <actual mismatch count and artifact>
Observed limiter: <resource supported by report, or not yet established>
Source evidence: <report file, section, observed values>
Address-model prediction: 32 store sectors versus 4 aligned load sectors per full warp
Hypothesis: make output stores adjacent by staging a tile in shared memory
If the report doesn't support a memory-path limit, revise the hypothesis before crediting a shared-memory rewrite with a speedup.
Coalesce both global directions
The tiled transpose uses block-local shared memory to exchange positions. Threads load adjacent input words, reach a block barrier, then read shared positions with swapped indexes and write adjacent output words. Mark Harris's original transpose walkthrough demonstrates this pattern; its historical GPU measurements aren't results for this lab.[6]
The core kernel below accepts Padding as a compile-time tile-width change. Variant tiled instantiates Padding = 0:
template <int Padding>
__global__ void transpose_tiled(float* output, const float* input, int n) {
  __shared__ float tile[kTile][kTile + Padding];

  const int input_x = blockIdx.x * kTile + threadIdx.x;
  const int input_y = blockIdx.y * kTile + threadIdx.y;

  for (int offset = 0; offset < kTile; offset += kBlockRows) {
    if (input_x < n && input_y + offset < n) {
      tile[threadIdx.y + offset][threadIdx.x] =
          input[static_cast<size_t>(input_y + offset) * n + input_x];
    }
  }

  __syncthreads();

  const int output_x = blockIdx.y * kTile + threadIdx.x;
  const int output_y = blockIdx.x * kTile + threadIdx.y;

  for (int offset = 0; offset < kTile; offset += kBlockRows) {
    if (output_x < n && output_y + offset < n) {
      output[static_cast<size_t>(output_y + offset) * n + output_x] =
          tile[threadIdx.x][threadIdx.y + offset];
    }
  }
}
Notice the symmetry in coordinates:
- Input reads advance with
threadIdx.x, giving adjacent lane addresses. Four-sector coverage applies to a full aligned warp, not every edge or odd-width row. __syncthreads()orders shared writes before the block's subsequent shared reads. All 256 threads reach it, including lanes without an admitted input element.- Output addresses also advance with
threadIdx.x. The transpose now preserves adjacent lane order in both global directions; the selected shape and alignment determine sector coverage.
Keep the barrier outside bounds checks so every thread in the block reaches it, including threads processing edge tiles.
Check the edge-tile mapping without a GPU
For N=33, most threads in the last tile are out of bounds. Does an admitted output read still have a producer? Its shared coordinate is (threadIdx.x, threadIdx.y + offset). The corresponding input coordinate is (blockIdx.y * 32 + threadIdx.x, blockIdx.x * 32 + threadIdx.y + offset), exactly the transpose of the admitted output coordinate. The two bounds conditions agree.
This CPU model enumerates those coordinates, requires every shared read to have a producer, and checks that every output location is written exactly once. It also checks the bank arithmetic. It doesn't execute CUDA, model warp scheduling, or measure a memory transaction.
from collections import Counter

def check_mapping(n):
    output = {}
    for by in range((n + 31) // 32):
        for bx in range((n + 31) // 32):
            tile = {}
            for ty in range(8):
                for tx in range(32):
                    for offset in range(0, 32, 8):
                        row, col = by * 32 + ty + offset, bx * 32 + tx
                        if row < n and col < n:
                            tile[ty + offset, tx] = (row, col)
            # All producer writes precede consumer reads in this model.
            for ty in range(8):
                for tx in range(32):
                    for offset in range(0, 32, 8):
                        row, col = bx * 32 + ty + offset, by * 32 + tx
                        if row < n and col < n:
                            assert (row, col) not in output
                            output[row, col] = tile[tx, ty + offset]
    assert len(output) == n * n
    assert all(value == (col, row) for (row, col), value in output.items())

for n in (1, 7, 31, 32, 33, 65, 257):
    check_mapping(n)
print("seven square shapes: index coverage and transpose mapping pass")
for stride in (32, 33, 34):
    banks = Counter((lane * stride) % 32 for lane in range(32))
    print(f"stride {stride}: {len(banks)} banks, {max(banks.values())} words per bank")
assert 2 * 4096**2 * 4 == 134_217_728
print(f"example effective GB/s: {134_217_728 / 0.000250 / 1e9:.1f}")seven square shapes: index coverage and transpose mapping pass
stride 32: 1 banks, 32 words per bank
stride 33: 32 banks, 1 words per bank
stride 34: 16 banks, 2 words per bank
example effective GB/s: 536.9The adjacent-address rule also needs alignment and active-lane counts. Predict the sector count for each case before running this address-only model. It counts 32-byte regions touched by scalar words, not cache misses, physical HBM transactions, or elapsed time.
def sector_coverage(word_indexes):
    addresses = list(word_indexes)
    sectors = {4 * word // 32 for word in addresses}
    useful = 4 * len(set(addresses))
    return len(sectors), useful / (32 * len(sectors)) if sectors else 0.0

cases = (
    ("aligned row, N=4096", range(32)),
    ("second row, N=33", range(33, 65)),
    ("naive column, N=4096", (lane * 4096 for lane in range(32))),
    ("one active edge lane", [32]),
)
for name, addresses in cases:
    sectors, fraction = sector_coverage(addresses)
print(f"{name}: {sectors} sectors, {fraction:.1%} payload fraction")aligned row, N=4096: 4 sectors, 100.0% payload fraction
second row, N=33: 5 sectors, 80.0% payload fraction
naive column, N=4096: 32 sectors, 12.5% payload fraction
one active edge lane: 1 sectors, 12.5% payload fractionRun correctness and event timing first, then collect the profiler report:
./transpose_lab tiled 4096 100 \
  | tee artifacts/run-01/tiled-benchmark.csv

ncu --set full \
  --kernel-name-base function \
  --kernel-name 'regex:transpose_tiled' \
  --launch-skip 6 \
  --launch-count 1 \
  --force-overwrite \
  -o artifacts/run-01/tiled \
  ./transpose_lab tiled 4096 1
Expected evidence shows two distinct shifts:
- global reads and writes now use adjacent lane addresses, reducing the predicted store-sector count from 32 to four for the full aligned warp;
- the shared-memory column read triggers a severe bank conflict.
For the scalar 32-bit access model here, successive words map cyclically across 32 shared-memory banks: . Different words in the same bank create conflicts; reading the same word can use broadcast. Conflict-free mapping removes this serialization, but doesn't establish a one-cycle load latency.
In the unpadded tile tile[32][32], row , column sits at 1D float offset . When reading down column , thread lane reads row :
All 32 lanes request distinct words in bank , producing the mapping's 32-way bank conflict.[6] In the scalar service model, that requires 32 conflict-free wavefronts rather than one. Service steps aren't the entire load-to-use latency, and they don't imply a 32x kernel-time multiplier.
Query the installed Nsight Compute metrics to inspect shared memory conflicts:
ncu --query-metrics | rg 'bank_conflicts|shared.*conflict' \
  | tee artifacts/run-01/bank-metrics.txt
If supported by the installed tool and GPU, inspect l1tex__data_bank_conflicts_pipe_lsu_mem_shared_op_ld.sum and the Shared Memory table. Expect evidence consistent with the column mapping, and use available source correlation to locate it. A particular counter isn't guaranteed to exist or provide instruction-by-instruction attribution on every target.
Change the shared-memory stride
The next candidate changes only the tile declaration width:
__shared__ float tile[32][33];By adding a single padding float to each row, the row stride increases from 32 to 33. The column element for lane at column now sits at word offset :
Because ranges from 0 through 31, generates a complete cyclic permutation of the integers 0 through 31. Lane 0 accesses Bank , Lane 1 accesses Bank , and Lane 31 accesses Bank .
Each lane hits a unique bank, removing this column conflict. Padding doesn't change matrix shape or logical global traffic. It changes the shared row stride and adds 128 bytes per block. Actual service latency and kernel speed still need measurement.[6]
Would float tile[32][34] remove the column conflict as completely as float tile[32][33]? Derive the bank pattern before answering.
Answer
No. A 34-word row gives . Because , lanes 0 through 15 reach 16 distinct banks, then lanes 16 through 31 repeat those exact same banks. Each bank receives two different words, leaving a two-way conflict. A 33-word row works because , so its stride is one modulo 32.
Check the padded result before timing or profiling it:
./transpose_lab padded 4096 100 \
  | tee artifacts/run-01/padded-benchmark.csv

ncu --set full \
  --kernel-name-base function \
  --kernel-name 'regex:transpose_tiled' \
  --launch-skip 6 \
  --launch-count 1 \
  --force-overwrite \
  -o artifacts/run-01/padded \
  ./transpose_lab padded 4096 1
Compare identical evidence fields across tiled and padded:
| Evidence | tiled expectation | padded expectation | Decision use |
|---|---|---|---|
| exact transpose | 0 mismatches | 0 mismatches | reject either candidate that fails |
| logical global bytes | same | same | keeps rate comparable |
| global access order | adjacent reads and writes | adjacent reads and writes | confirms padding didn't regress coalescing |
| shared bank conflicts | column conflict present | conflict removed for shown mapping | tests causal hypothesis |
| static shared memory | 4096 bytes | 4224 bytes | feeds resource-limit check |
| event time | measured distribution | measured distribution | keep change only if repeat evidence improves |
Don't write that padding is faster without citing your hardware, software, shape, precision, timing method, baseline, and correctness record. Architecture and toolchain decide the size of the benefit, so a universal speedup claim would be unfounded.
A candidate is 6% faster, but its edit both pads the tile and changes the block from 32 x 8 to 32 x 16. What can the evidence ledger conclude, and how should the experiment recover?
Answer
The run shows that the combined candidate differs, but it can't attribute the change to padding or launch geometry. Restore 32 x 8 and measure padding alone against the fixed baseline. Then hold tile width fixed and test 32 x 16 separately. Each branch still needs the same exact-output, profiler, sanitizer, and repeated-timing gates.
Loop unrolling and instruction-level parallelism
Hardware needs independent work in flight to hide memory latency. Resident warps and independent instructions within a thread can provide it. The latency depends on the target, cache outcome, contention, and clocks; there isn't a universal 200–800-cycle range to use as this lab's result.
In transpose_tiled, 256 threads cover 1,024 floats, so each handles four rows separated by kBlockRows = 8. The download has no explicit unroll pragmas. As a separate experiment, add one immediately before a selected loop, as shown here:[7]
#pragma unroll
for (int offset = 0; offset < kTile; offset += kBlockRows) {
  if (input_x < n && input_y + offset < n) {
    tile[threadIdx.y + offset][threadIdx.x] =
        input[static_cast<size_t>(input_y + offset) * n + input_x];
  }
}
The compiler already unrolls small constant-trip loops by default, so the pragma may leave generated code unchanged. Unrolling can reduce loop-control instructions and expose independent operations. It doesn't guarantee four loads are issued before their dependent shared stores or that all memory latency overlaps. Inspect generated assembly and compare compiler resources and timing.[7]
More live state can increase registers, reduce resident warps, or cause spills. The allocation boundaries depend on the GPU and block configuration, rather than a universal 32- or 48-register threshold. Local-memory spills use device-memory-backed storage and can be cached; they don't automatically destroy throughput. Record their measured cost before rejecting an otherwise faster candidate.[2]
Interior warps have all lanes admitted; edge warps may mask some lanes. Keep global accesses inside their bounds checks and keep the block barrier outside them. Moving a load or store beyond its guard to increase lane utilization would break correctness.
Occupancy is a constraint, not a score
Occupancy is the ratio of active warps on a Streaming Multiprocessor (SM) to the hardware maximum. More resident warps can hide latency, but highest occupancy doesn't automatically deliver highest performance. Registers, shared memory, threads per block, and barriers can limit resident blocks, while forcing resource use down can introduce spills or extra instructions.[2][3]
The lab block uses 32 x 8 = 256 threads, or eight 32-thread warps. The concrete resource comparison across variants shows:
| Resource | naive | tiled | padded | What to inspect |
|---|---|---|---|---|
| threads per block | 256 | 256 | 256 | LaunchStats |
| static shared memory per block | 0 B | 4096 B | 4224 B | compiler output and LaunchStats |
| added shared memory from padding | 0 B | 0 B | 128 B | arithmetic plus report |
| registers per thread | compiler-specific | compiler-specific | compiler-specific | -Xptxas=-v and LaunchStats |
| resident blocks or warps | device-specific | device-specific | device-specific | Occupancy limiter |
The 128-byte increase from padding may leave occupancy unchanged or cross an allocation boundary for a particular resource configuration. Read the report. Don't infer resident blocks from source alone.
Use these diagnoses when evaluating profiler evidence:
| Profiler evidence | Likely constraint | Next experiment |
|---|---|---|
| low occupancy limited by static shared memory | too much per-block tile storage | reduce tile footprint or test smaller blocks, one change at a time |
| low occupancy limited by registers plus local-memory traffic | register pressure and spilling | reduce live state or revisit unrolling, then check instruction count |
| adequate occupancy but high memory throughput | memory path may limit the workload | identify the pressured memory stage and test fewer transactions or bytes |
| many waves but long barrier stalls | synchronization or imbalance | inspect work per warp and barrier placement |
| too few blocks to fill SMs | grid lacks parallel work | test larger workload or different decomposition |
Evaluate the padded variant using repeated timing and the operational budget, including its added shared storage. If the conflict improves but the timing benefit remains unresolved, record that uncertainty and investigate. A counter change alone doesn't establish a faster kernel.
Deliberately remove the barrier
Performance edits often break synchronization before they break memory bounds. Variant broken uses the padded tile but omits __syncthreads() between shared writes and shared reads. Some warps read shared memory locations before producer warps finish writing them.
Run a smaller matrix under the tools. Compute Sanitizer documentation recommends running memcheck before racecheck because racecheck doesn't check invalid memory addresses.[8] The harness intentionally exits 2 for broken; capture that expected application failure without aborting the diagnostic sequence. Keep the full logs: --error-exitcode 99 applies to detected sanitizer errors when the application itself would otherwise succeed. A nonzero exit alone isn't evidence of a race: tool startup failures and application errors also fail the command. Identify the reported shared-memory hazard in the racecheck log.
for tool in memcheck racecheck synccheck; do
  if compute-sanitizer --tool "$tool" --error-exitcode 99 \
      ./transpose_lab broken 33 1 \
      > "artifacts/run-01/broken-${tool}.txt" 2>&1; then
    echo "unexpected success for known-broken variant" >&2
    exit 1
  else
    status=$?
    echo "${tool} exit=${status}" | tee -a artifacts/run-01/broken-exits.txt
  fi
done
Expected diagnostic split:
memcheckreports no illegal addresses because every index stays within allocation bounds;racecheckreports shared-memory ordering hazards around the missing barrier, such as RAW or WAR hazards under the instrumented schedule;synccheckreports no misuse because the kernel omitted a barrier instead of executing an invalid barrier;- output checker may fail, but an accidental correct output on one run doesn't clear the race.
That last point is critical. Scheduler timing can hide data races during an ordinary run. Dynamic race evidence invalidates a kernel even when sampled output happens to match.
Recover by restoring the block barrier. Validate every candidate you intend to keep, including a partial tile and a full-tile case. These checks run outside the performance measurement:
for variant in copy naive tiled padded; do
  for n in 33 1024; do
    for tool in memcheck racecheck synccheck; do
      compute-sanitizer --tool "$tool" --error-exitcode 99 \
        ./transpose_lab "$variant" "$n" 1 \
        > "artifacts/run-01/${variant}-${n}-${tool}.txt" 2>&1
    done
  done
done

./transpose_lab padded 4096 100 \
  | tee artifacts/run-01/recovered-benchmark.csv
The recovery record connects the symptom to the ordering requirement:
| Field | Minimum content |
|---|---|
| failure | missing block barrier between shared writes and cross-warp reads |
| detection | racecheck hazard plus output result, whether pass or fail |
| repair | restored __syncthreads() reached by every thread in block |
| validation | exact transpose, memcheck and racecheck results for the recorded cases |
| performance | same event-timed shape and iteration count after repair |
| provenance | GPU, toolkit, source hash, compiler resource output, report paths |
Fill recovery-template.md and keep it with the raw reports. A reviewer should be able to trace the failure, repair, tested shapes, and post-recovery cost. Clean dynamic checks cover those executions, not every possible input or schedule.
Decide between transpose, reduction, and scan
Shared-memory tiling works well for spatial reordering. It isn't a universal answer for every memory-bound kernel. Ask what output dependency requires before choosing a primitive:
| Primitive | Output contract | Neighbor interaction | Typical use |
|---|---|---|---|
| transpose | preserve every value, change two-dimensional index order | threads exchange tile positions | switch row-major and column-major access orientation |
| reduction | combine many values into fewer values with associative operator | partial aggregates merge | sum loss, maximum error, count mismatches, row sum [9] |
| scan | emit prefix aggregate for every input position | each output depends on preceding range | prefix offsets, stream compaction positions, cumulative token counts |
Consider moving the correctness check from CPU back to GPU. If you need only total mismatch count and maximum absolute error, use reductions. Both outputs collapse comparisons into scalars. Specify how nonfinite values enter the maximum. Floating-point sums also need a numerical contract because addition isn't exactly associative under rounding. A scan would produce per-comparison prefixes the summary doesn't need.
Now consider compacting indexes of mismatched elements. Each failing element needs a destination position based on the number of failures before it. That is a prefix dependency, so a scan computes offsets. A reduction can count total failures but can't assign each failure a unique compacted slot.
The decision rule remains mechanical:
- Same number of values, different layout: transpose.
- Fewer summary values: reduction.
- Same number of prefix states or compaction offsets: scan.
Tiling can appear inside all three implementations, but the dependency graph picks the algorithm. Don't start by copying a transpose tile into a reduction or scan kernel.
Report the result you measured
Complete the comparison only after the variants share the same workload and validity contract. The entries below are hypotheses and required observations, not supplied benchmark results:
| Run | Hypothesis | One code change | Correctness | Profiler evidence | Event timing | Verdict |
|---|---|---|---|---|---|---|
| naive | direct transpose wastes global-store transactions | none | exact | memory-bound, strided store source line | five-run distribution | baseline |
| tiled | shared tile coalesces output stores | add tile and block barrier | exact | global access improves; bank conflict appears | five-run distribution | keep for next iteration or reject |
| padded | extra column changes bank mapping | tile width 32 to 33 | exact plus sanitizer | bank conflict falls; resource use recorded | five-run distribution | keep only with repeat benefit |
| broken | barrier is required for cross-warp tile reuse | remove barrier | unreliable | racecheck hazard | timing invalid | reject and recover |
One row isn't complete if its correctness cell says only that it looks right. Keep raw CSV, .ncu-rep files, sanitizer logs, compiler resource output, environment files, source hash, and the filled recovery record.
You've finished when you can defend all six claims:
- workload and timing method stayed fixed;
- baseline bound came from profiler evidence;
- each candidate changed one causal mechanism;
- output check matched transpose exactly;
- sanitizer results are clean for the accepted kernels and tested shapes;
- reported performance includes conditions and distribution, not unsupported headline speedup.