Personalize this lesson
Adapt explanations and teaching visuals to your background and preferred voice.
In this synthetic incident, request r-7812 asks replica summarizer-7f9d6 for another 1.50 GiB at 14:03:17 UTC on August 29, 2026. The allocation fails. Node gpu-a17 still answers health checks, peer replicas still serve traffic, and the alert says only CUDA out of memory. The timestamps, shortened GPU IDs, and rounded memory values are teaching data, not measurements from a real fleet.
The first receipt is more specific:
node=gpu-a17  pod=summarizer-7f9d6  gpu=GPU-7f3
capacity=40.00 GiB  device_free=0.62 GiB
pytorch_allocated=30.10 GiB  pytorch_reserved=36.70 GiB
inactive_split_blocks=6.10 GiB  largest_inactive_split_block=0.88 GiB
allocation_request=1.50 GiB
nvml_device_used=39.38 GiB  new_xids=[]  new_uncorrectable_ecc=0
There is no universal repair command after this receipt. A request retry, process restart, device quarantine, and node drain act at different scopes. First stop new work reaching the failing replica. Then use evidence to choose the smallest sufficient repair scope.
Why is CUDA out of memory insufficient evidence for draining gpu-a17?
Answer
The error names a failed allocation in one process. It doesn't yet distinguish live application demand, allocator fragmentation, memory held outside PyTorch, a stale process, or a device fault. Draining the node would evict unrelated workloads before that scope is known.
Build an incident receipt before changing state
An incident receipt is a time-aligned record of request, process, device, node, and cluster evidence. The serving lesson established admission and readiness controls; here they isolate a failing worker while you investigate. PyTorch can record allocator history and dump a snapshot for memory_viz, its memory visualizer. A snapshot includes allocator state and OOM events, but only for memory visible to that allocator.[1]
For r-7812, preservation comes before restart:
- Remove the replica from application readiness so new work stops arriving.
- Record request ID, pod UID, container restart count, PID, node, GPU UUID, model revision, allocator backend and configuration, CUDA runtime, driver, and timestamps.
- Dump the PyTorch memory snapshot if the process still responds.
- Record device-wide memory, process accounting, ECC counters, clocks, power, temperature, Xid events, and device-plugin health.
- Copy logs and artifacts to incident storage with access controls.
- Only then choose containment and repair scope.
A process exit destroys unsaved allocator history. A reset or reboot can erase volatile device evidence and logs. Capture what you can within a bounded incident deadline; don't delay required isolation or termination while a broken process hangs on a snapshot call. Preservation isn't permission to collect another tenant's prompts, model inputs, or secrets.
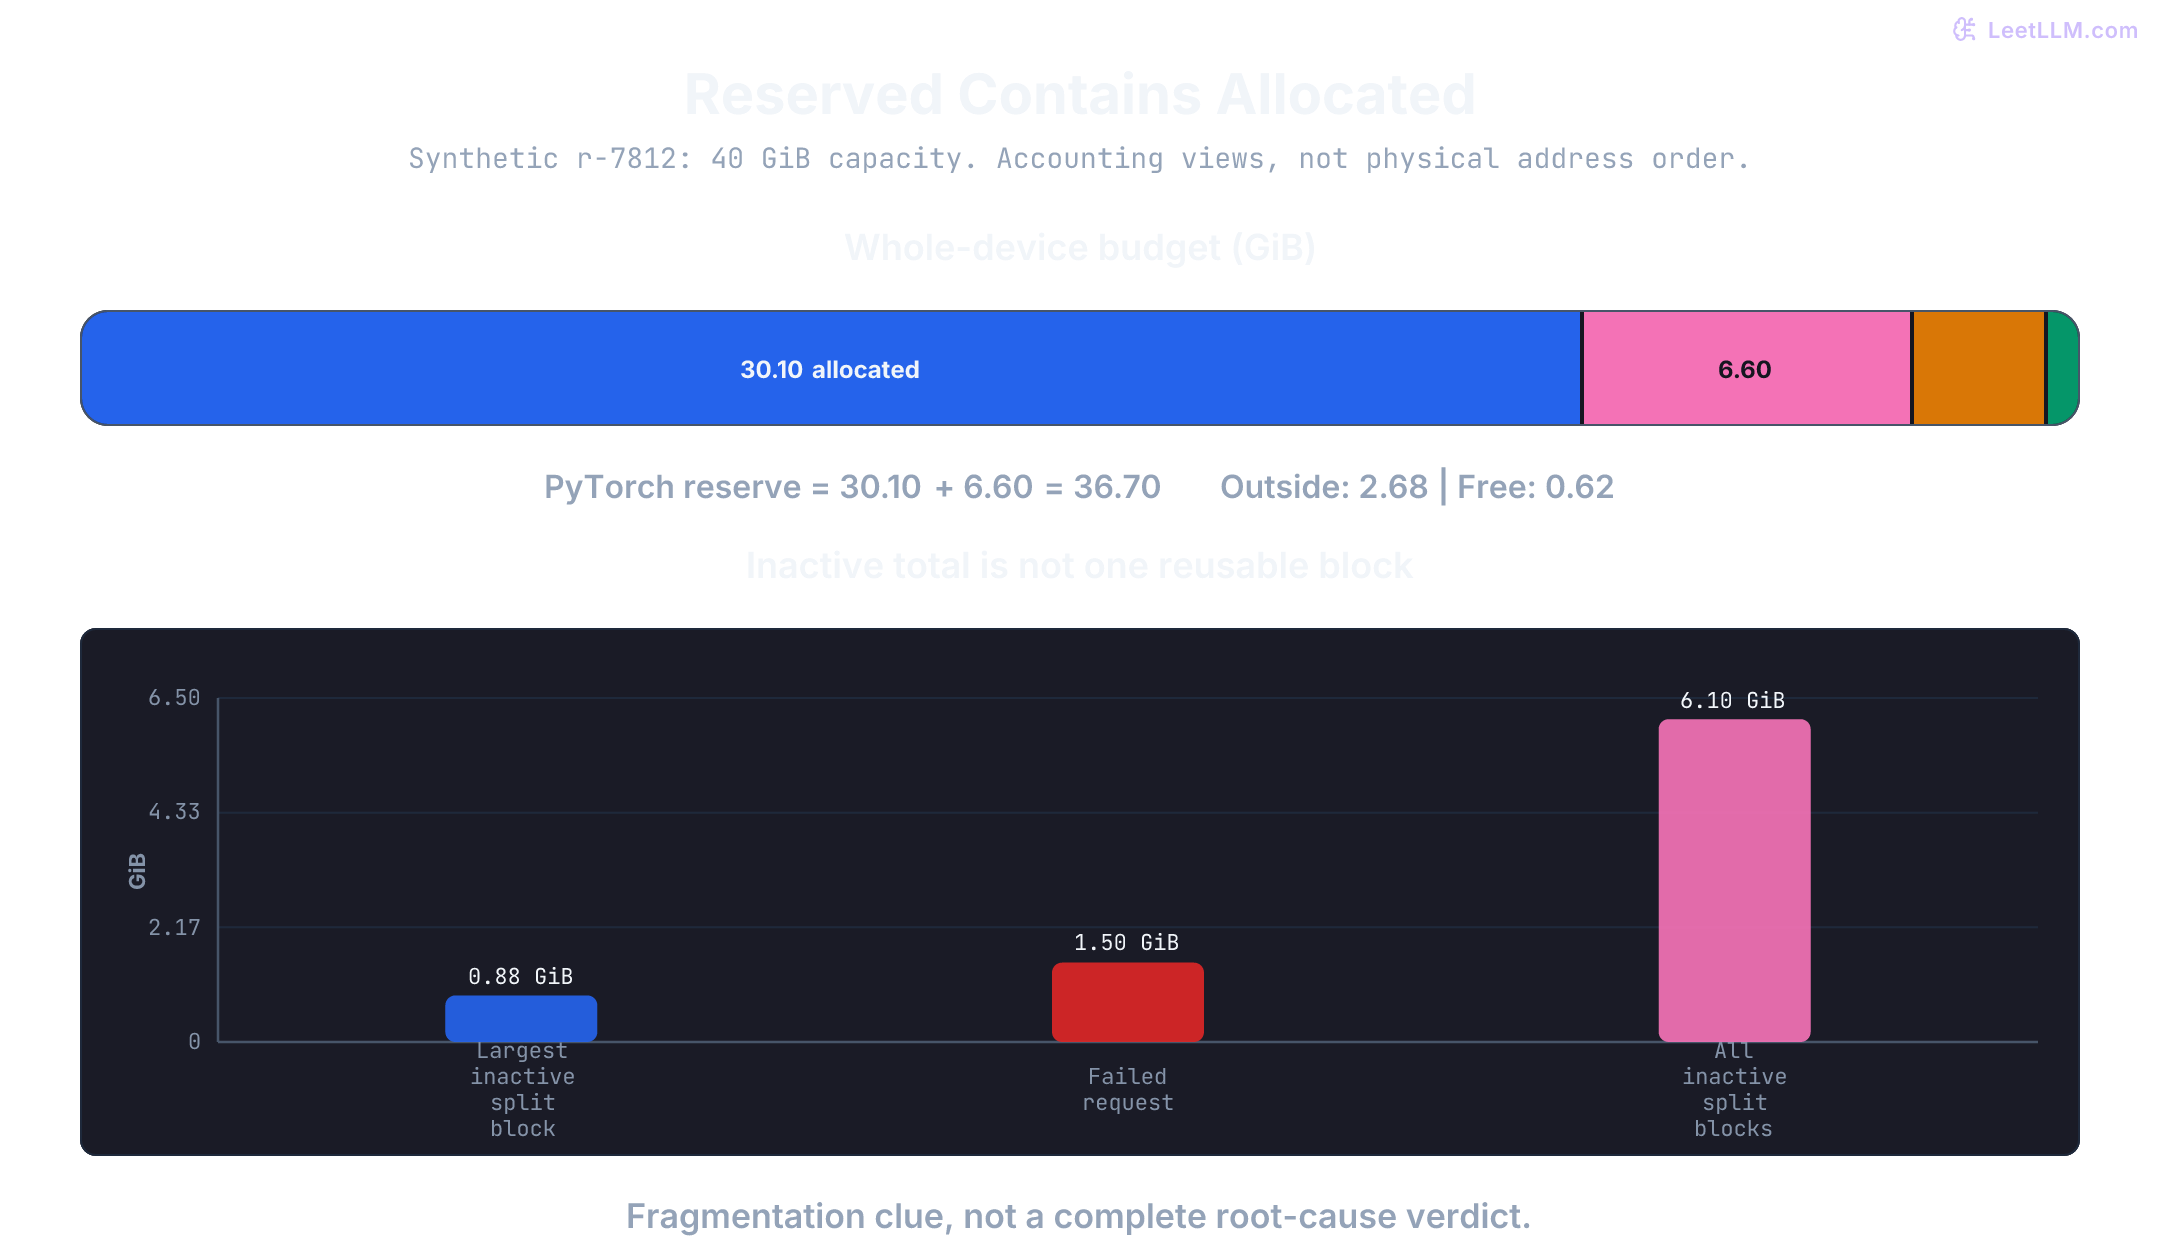
The receipt separates several memory quantities:
| View | Exact value | What it can support | What it can't prove |
|---|---|---|---|
| PyTorch allocated | 30.10 GiB | Live tensor blocks known to allocator | Which tensor is semantically necessary |
| PyTorch reserved | 36.70 GiB | Segments allocator still holds | Contiguous availability for a 1.50 GiB request |
| Reserved minus allocated | 6.60 GiB | Allocator accounting gap to reconcile in snapshot | Bytes currently inactive and reusable |
| Inactive split blocks | 6.10 GiB | Free fragments trapped in partly active segments at OOM | One reusable block of sufficient size |
| Largest inactive split block | 0.88 GiB | Largest observed fragment in snapshot | Future allocation layout after workload changes |
| NVML device used | 39.38 GiB | Whole-device usage across CUDA users | Ownership without process or subsystem attribution |
| NVML used minus reserved | 2.68 GiB | Approximate use outside PyTorch reserve | Whether NCCL, another process, or driver state owns it |
reserved - allocated is an accounting gap, not a reusable-byte counter. The snapshot's 6.10 GiB of inactive split blocks suggests fragmentation, because its largest observed fragment is only 0.88 GiB. Inspect segments, pending frees, stream ordering, and allocator pools before claiming those are all possible sources of space. A free fragment in one segment can't simply be added to a nonadjacent fragment to satisfy one allocation.
The outside-PyTorch delta also matters. The request exceeds device-free memory by 1.50 - 0.62 = 0.88 GiB; the 2.68 GiB delta is larger than that deficit. Releasing some of it could change the outcome, but you haven't established who owns it or whether it can be released. Fragmentation under memory pressure is a working hypothesis, not proof of one exclusive cause.
The subtraction assumes the same physical GPU, compatible accounting scope, and nearly simultaneous samples. Match GPU UUID and, when applicable, MIG instance identity. Missing NVML readings, counter resets, or mismatched device scopes are missing evidence, never zero usage.
Record the NVML query version too. NVML v2's reserved field describes system reservation, which it includes in device-used memory; it isn't PyTorch's allocator reserve. On systems where GPUs are NUMA nodes, operating-system framebuffer accounting can retain pages after a process terminates. Device-used bytes remaining after exit therefore don't, by themselves, prove a stale CUDA process.[2]
Keep memory layers separate
GPU memory pressure has four common software layers. Combining them into one “leak” diagnosis produces the wrong repair.
| Layer | Strong evidence | Typical containment | Repair question |
|---|---|---|---|
| Application allocations | Allocated memory tracks batch, sequence, KV cache, workspace, or retained tensors | Reject, shed, or reroute bounded work | Which live state exceeded the admission envelope? |
| Allocator reservation | Reserved stays above allocated; snapshot shows inactive blocks and split segments | Remove replica, preserve snapshot, restart process if policy allows | Is layout fragmented, or is cached reserve expected? |
| Non-PyTorch allocation | NVML/device use materially exceeds PyTorch reserve | Attribute libraries and processes before tuning allocator | Does NCCL, direct CUDA allocation, or another framework own it? |
| Process leak | Device process list shows stale or duplicate owners after expected teardown | Stop admission to affected device; process owner cleans up within policy | Which lifecycle failed to release the process or context? |
PyTorch explicitly warns that its memory profiler can't see allocations made directly through CUDA APIs. NCCL is a documented example. torch.cuda.device_memory_used() provides a device-wide cross-check, and NVML exposes device and process telemetry for independent attribution.[1][2]
Don't treat reserved - allocated as wasted memory by definition. The caching allocator holds segments so later allocations avoid expensive device synchronization. Fragmentation becomes plausible when an OOM snapshot shows enough inactive split bytes but no fragment large enough for the failed request. PyTorch allocator configuration can change split behavior, yet tuning it before identifying the workload shape can hide an admission-control bug.[3]
This receipt assumes PyTorch's native caching allocator. With backend:cudaMallocAsync, some allocator statistics have backend-specific or undefined meaning, and native split-block tuning options don't apply. Record the backend and use its documented evidence instead of copying this inference unchanged.[3]
Record a finite allocator history
Enable history before the incident window when overhead and privacy policy permit:
import torch

torch.cuda.memory._record_memory_history(
    enabled="all",
    context="all",
    stacks="python",
    max_entries=100_000,
)

torch.cuda.memory._dump_snapshot("r-7812-memory.pickle")
This is a CUDA-only instrumentation fragment, not a runnable CPU diagnostic. Enable history before the workload and dump it from that same process near the failure; the two adjacent calls here show the API, not an observation window. The initial _ marks private APIs, so pin and validate the fleet's PyTorch version. PyTorch says memory_viz processes the file locally without uploading it.[1] Treat snapshots as sensitive artifacts: stack traces and source paths can expose application details.
History is a ring buffer, not an infinite flight recorder. Once max_entries fills, the oldest entries are replaced. Large histories can produce multi-gigabyte snapshots. Set a bounded window, record the start time and entry limit in the receipt, and trigger a dump near the failure. A snapshot with no OOM event may mean capture began too late or history wrapped, not that the alert was false.
A snapshot shows 6.10 GiB across inactive split blocks, but NVML reports 2.68 GiB more device use than PyTorch reserved. What should you conclude?
Answer
Two hypotheses remain. Allocator layout may block the 1.50 GiB request, while another CUDA user owns about 2.68 GiB. Inspect snapshot blocks and attribute device processes or libraries. Neither number alone proves a leak.
Classify beyond memory
An OOM can be the visible end of a different failure. A collective stalls, a peer disappears, requests accumulate, and healthy ranks hold buffers until an allocation fails. Build a parallel device and node view. NVML is NVIDIA's Management Library; DCGM is its Data Center GPU Manager. ECC means error-correcting code memory protection. An Xid is a driver-reported error code, not a verdict that the physical GPU is broken.
| Fault class | Evidence to correlate | Why symptom can mislead | Initial scope |
|---|---|---|---|
| ECC or device fault | New uncorrectable ECC, GPU UUID, kernel timestamp, device health | OOM or timeout can follow lost device access | Device or node quarantine pending memory-error guidance |
| Xid event | Exact code, GPU UUID, kernel timestamp, catalog action, nearby events | Same code family can reflect application, NVIDIA software, or hardware | Scope named by event-specific catalog and surrounding evidence |
| PCIe or NVLink fault | DCGM PCIe, NVLink, nvbandwidth, or NCCL test; link counters; peer topology | One slow or failed rank appears as a distributed timeout | Affected GPU topology, then node if isolation is unavailable |
| Clock limiting | Exact clock-event reasons, configured limits, temperature, power, clocks, workload phase | An expected power cap and a thermal fault can both reduce clocks | Replica first; platform path if unexpected under controlled load |
| Driver or runtime fault | Driver/runtime versions, module logs, NVML initialization, DCGM software test | Application sees initialization or unknown CUDA error | Stop admission; platform owner validates stack contract |
| CUDA process-state fault | Exact CUDA error, first failing operation, synchronization point | Asynchronous execution reports an earlier failure later | Process, unless device evidence expands scope |
NVML clock-event reasons name the active limiter, not its root cause. GPU idle and configured application clocks can be expected. Software power cap means clocks are respecting a configured power limit, while thermal slowdown points to temperature protection. Correlate reason, workload phase, configured limits, measured power, and temperature before calling it a fault.[2]
An Xid entry is not a root cause label. NVIDIA states that Xid events can arise from hardware, NVIDIA software, or an application. Recovery actions differ by event, and newer catalog guidance can attach a specific recovery action to the reported event.[4][5]
For example, the current catalog distinguishes Xid 94, a contained memory error requiring restart of the affected application, from Xid 95, an uncontained memory error requiring GPU reset before applications restart. With Xid 94, other running applications are unaffected and reset is recommended when convenient. Contained describes the error's scope, not whether the GPU was idle or whether the affected application survived. A reset still belongs to the platform owner.[5]
The GPU Operator device plugin listens for health events and can report a GPU unhealthy. Kubernetes then lowers allocatable device count, but pods already assigned to that device remain assigned and may fail or crash-loop.[6][7] Application readiness and workload containment still need an explicit controller or operator action. Device-plugin health alone is not retrospective eviction.
Respect asynchronous error reporting
CUDA work is asynchronous. An API call can enqueue work and return before the device executes it; an error may surface at a later synchronization boundary. Capture the first observed failure, stream, request, kernel, and correlation timestamp. CUDA_LAUNCH_BLOCKING=1 can help reproduce ordering in a controlled debug run, but it changes execution and should not become a fleet-wide production setting.[8]
cudaGetLastError() retrieves and clears the last-error record; an immediate second call can return cudaSuccess. Clearing that record doesn't undo the failed operation or restore a corrupted process. Preserve the first result, and correlate a successful status with the particular operation it describes.[8][9]
Some CUDA runtime errors explicitly leave the process in an inconsistent state. NVIDIA documents illegal address, kernel-execution launch timeout, launch failure, and several hardware-stack errors as requiring process termination and relaunch. Retrying another request in that same process is unsafe. This rule doesn't apply to every CUDA error, so preserve the exact error enum and originating API operation rather than matching the word “CUDA.”[9]
Contain at smallest broken scope
Use a ladder. Move outward only when evidence says the smaller boundary can't protect users or hardware.
| Action | Appropriate evidence | What must be true first | Why a broader action is risky |
|---|---|---|---|
| Retry request elsewhere | Idempotent or deduplicated request; healthy alternate replica; failed process still trustworthy or excluded | Retry budget and side-effect contract permit replay | Blind retries amplify memory pressure and duplicate effects |
| Remove replica from readiness | One worker is unhealthy or near its memory envelope | Gateway and scheduler honor readiness quickly | Traffic can keep reaching a process that should be preserved |
| Restart process | Allocator fragmentation, process leak owned by replica, or fatal CUDA process-state error | Bounded evidence capture attempted; restart budget permits it | Restart erases volatile evidence and can loop on a bad device |
| Quarantine GPU | New uncorrectable ECC, isolation-requiring Xid action, fabric finding, or repeated device-scoped evidence | Device identity and cluster owner are known | Shared node may lose capacity; peer topology can be affected |
| Cordon or drain node | Node-wide driver, fabric, power, cooling, or repair requirement | Platform owner authorizes scope; workload disruption reviewed | Drain can evict unrelated tenants and destroy local ephemeral data |
Cordon and drain aren't synonyms. Cordoning makes the node unschedulable for ordinary new placements; it doesn't evict existing pods. Draining requests workload eviction and may wait on disruption budgets or other blockers. Removing a replica from readiness also doesn't cancel in-flight requests or immediately close every existing connection. Confirm the actual admission boundary before restarting anything.[10]
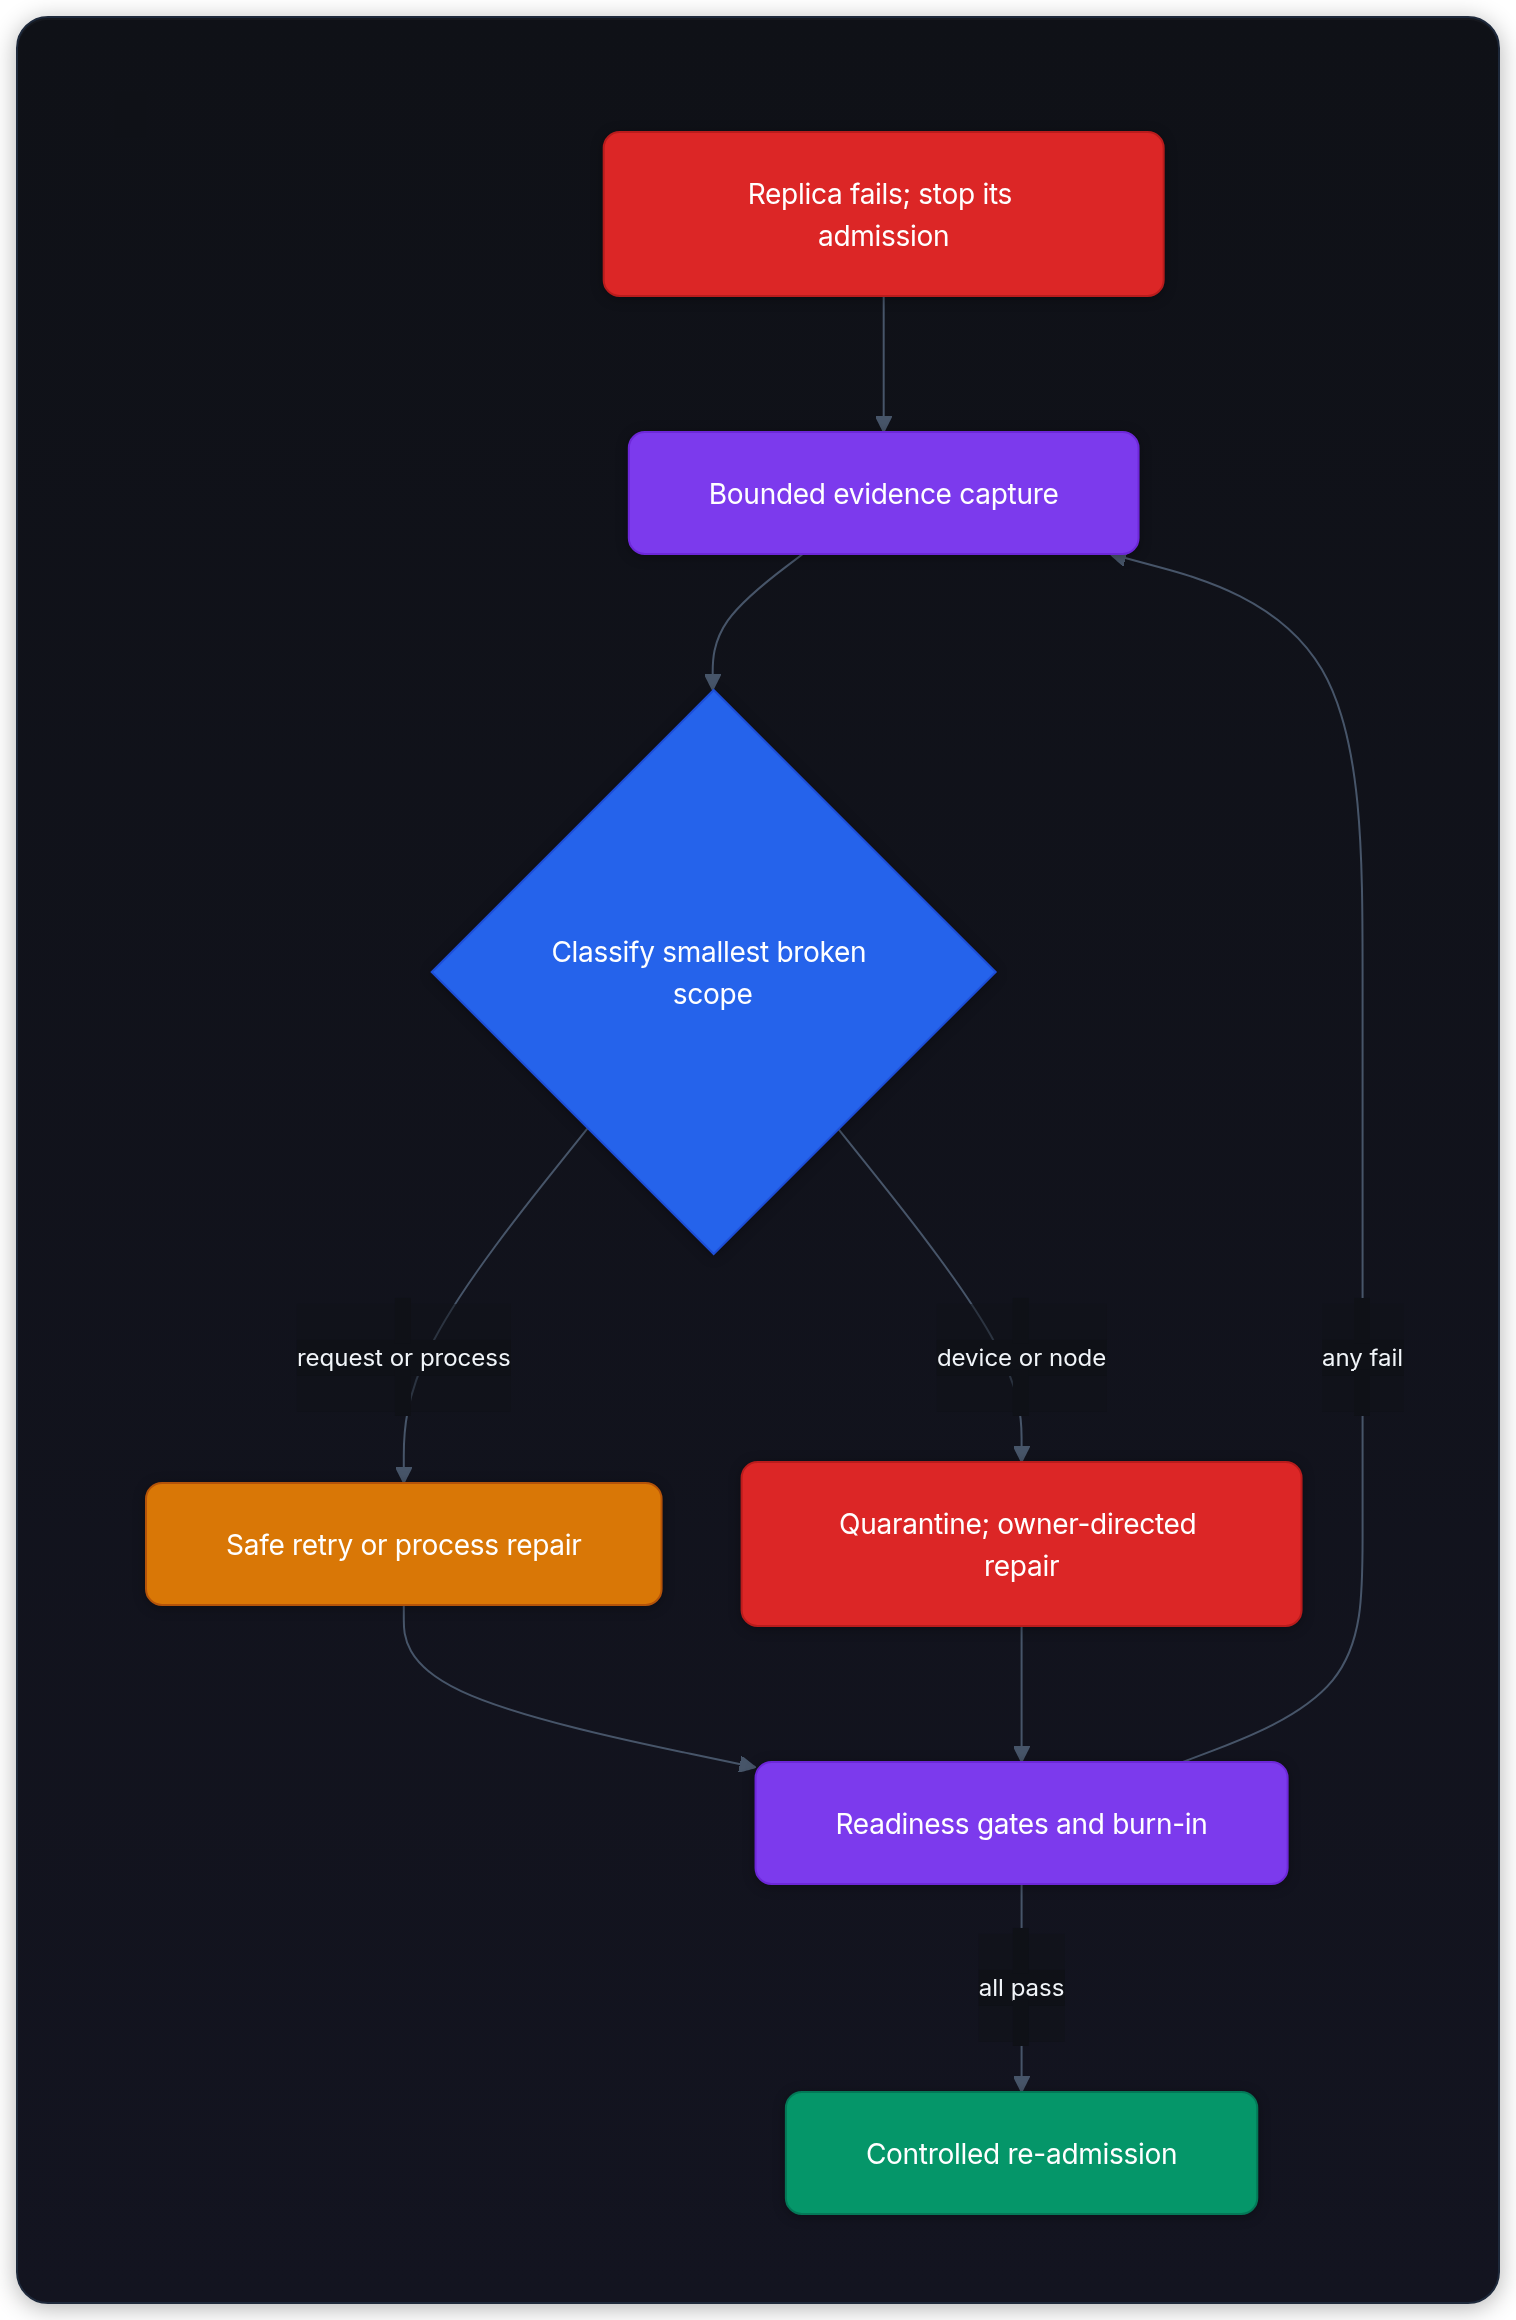
For r-7812, rerouting a retry still requires an idempotent or deduplicated operation. The failed replica leaves readiness, with in-flight requests handled separately. Capture its snapshot and receipt if possible. OOM alone doesn't require process relaunch, but policy may choose one to contain recurring allocator pressure. The supplied receipt has no new ECC or Xid events; link, thermal, and power evidence still need collection. Absence of those fields isn't proof they passed. Nothing supplied yet justifies a node drain.
An illegal-address error appears after a request, but the next health check passes. May the worker serve another request?
Answer
No. CUDA documents illegal address as leaving the process in an inconsistent state. Remove the worker from readiness, preserve evidence, terminate and relaunch the process, then apply re-admission gates. A passing application probe doesn't repair CUDA process state.
Run diagnostics with an explicit question
DCGM diagnostics are active tests, not repair commands. NVIDIA describes four levels:
| DCGM level | Intended operational use | Representative additions | Scheduling rule |
|---|---|---|---|
| Level 1 | Fast readiness signal before work | Deployment and software checks | May fit an admission gate after local validation |
| Level 2 | Failure epilogue or brief health check | PCIe, memory, memory bandwidth, NVLink | Run outside user traffic when tests can contend |
| Level 3 | Admin post-mortem | Diagnostic stress, targeted power/stress, nvbandwidth, NCCL tests | Quarantined or idle hardware only |
| Level 4 | Extended post-mortem | Longer memory and pulse-style coverage | Maintenance window with platform ownership |
Exact tests depend on DCGM version, hardware, driver, and installed plugins. In the current run-level table, pcie covers PCIe and NVLink checks; nvbandwidth and nccl_tests start at Level 3, not Level 2. A named test may be unavailable. Pass applies only to checks that ran, Fail may be a device finding or setup error, and Skip or Not Run supplies no health verdict.[11][12]
Ask one question per run:
- “Can this GPU enumerate and pass deployment checks?” points toward Level 1.
- “Did memory or PCIe fail around this incident?” points toward selected Level 2 tests.
- “Can the quarantined tensor-parallel topology sustain fabric traffic?” points toward nvbandwidth or NCCL plugins at an admin level.
- “Does the device reproduce a memory or power failure under burn-in?” points toward selected stress tests on idle hardware.
Record command, DCGM version, selected entities, test names, parameters, wall time, plugin availability, raw result, and exit status. DCGM doesn't claim comprehensive diagnosis or automatic repair. A passing suite narrows evidence; it doesn't erase an Xid or guarantee future health.[11]
Make ownership part of automation
A multi-tenant GPU node has four ownership boundaries, even if one team handles several:
| Boundary | Owner decision | Automation may do safely | Escalation trigger |
|---|---|---|---|
| Request | Serving team | Bound retries, deduplicate effects, route away from unhealthy replica | Side-effect ambiguity or exhausted retry budget |
| Process or pod | Workload owner | Toggle readiness, preserve app receipt, restart within disruption budget | Repeated crash or cross-process memory owner |
| GPU device | Platform GPU controller | Mark device unavailable, attach evidence, stop new allocation | New uncorrectable ECC, isolation-requiring Xid action, fabric finding, or repeated burn-in failure |
| Node and rack | Cluster or hardware owner | Cordon, drain, repair, reboot, or replace under policy | Shared driver, cooling, power, PCIe, or topology fault |
Error-aware automation consumes structured facts, not log substrings alone. A useful event includes GPU UUID, node UID, workload UID, process identity, exact CUDA or Xid code, source, first and last timestamps, recurrence count, and evidence links. Its transition should be idempotent: one device fault creates one quarantine record, not a storm of repeated drains.
Never let a workload controller reset a shared GPU or drain a node by inference. NVIDIA's own GPU Operator upgrade workflow separates cordon, workload termination, validation, and uncordon. Its documentation warns that full drain can evict unrelated pods and can permanently remove emptyDir data.[10] Production remediation needs equivalent scope checks and authority.
Preserved evidence also needs tenancy controls:
- Snapshot allocator metadata, not prompt bodies, unless incident policy explicitly requires content.
- Restrict process lists and command lines when they expose another tenant's paths or arguments.
- Attach retention, encryption, and access policy to receipts.
- Store stable IDs and hashes so responders can correlate without copying sensitive payloads.
Repair path for gpu-a17
The repair is intentionally narrow:
- Contain: Set
summarizer-7f9d6not ready. Stop scheduler admission to its process. - Preserve: Save snapshot, application logs, exact versions, NVML memory and process view, ECC counters, clocks, power, temperature, and kernel Xid window.
- Classify: Confirm
30.10 GiBallocated,36.70 GiBreserved,6.10 GiBinactive across split blocks,0.88 GiBlargest fragment, and39.38 GiBdevice-wide use. Attribute the2.68 GiBdelta. - Repair process: Finish or reject in-flight work according to the request contract. Relaunch the serving process under its normal supervisor.
- Prove baseline: Load the same model revision and configuration. Confirm expected idle memory and the expected process owners for this isolation mode.
- Burn in: Replay a bounded canary workload that includes the 1.50 GiB allocation shape. Watch allocator headroom, device-wide delta, Xid/ECC, link status, clocks, temperature, power, and latency.
- Re-admit: Restore only a small traffic fraction. Expand after a fixed observation window with no gate failure.
If fragmentation returns under the same bounded workload, process restart was containment, not repair. Revisit admission envelopes, KV-cache sizing, batch and sequence caps, workspace lifetime, CUDA graph pools, and allocator configuration. If outside-PyTorch use grows, attribute NCCL, custom CUDA, peer processes, or context lifecycle before changing allocator settings.
Re-admission gates
Use explicit pass/fail gates rather than “looks stable”:
| Gate | Example evidence | Failure action |
|---|---|---|
| Identity | Expected GPU UUID, driver/runtime pair, model revision, and process owners for the isolation mode | Hold admission and resolve inventory mismatch |
| Idle baseline | Device-wide and allocator memory inside known band | Investigate stale process, context, or changed model footprint |
| Functional probe | Deterministic canary returns expected shape and status | Keep replica out of readiness |
| Memory envelope | Peak allocated, reserved, largest reusable block, and outside delta remain within policy | Adjust workload or allocator plan before retry |
| Device health | No new disqualifying Xid/ECC; required DCGM checks ran and passed | Keep quarantined; follow event-specific owner runbook |
| Fabric health | Required peer path and selected fabric tests pass on affected topology | Keep topology unavailable |
| Thermal and power | Clocks, temperature, and power within workload-approved bands during bounded load | Investigate unexplained limits before escalating cooling, power, or hardware |
| Soak | Fixed request count or duration completes without recurrence | Extend quarantine and compare receipts |
Burn-in must resemble the failed allocation and communication shape without carrying production traffic. “One inference succeeded” misses fragmentation that emerges after many allocation cycles and fabric faults that need multi-GPU load. Define duration, load, pass thresholds, and abort conditions before starting.
A diagnostic receipt reports PCIe Pass and nvbandwidth Skip. Can automation re-admit a topology whose incident requires bandwidth coverage?
Answer
No. PCIe Pass covers only the check that ran. Skip is no health verdict, and the missing fabric coverage is relevant to the incident. Keep the topology quarantined until the required test can run or an authorized owner chooses another evidence path.
A small coverage check makes the distinction executable. Assume these results came from one fresh, identified run on the required GPU topology. The function checks only diagnostic coverage, not the other re-admission gates:
def coverage_complete(required, results):
    if not required:
        raise ValueError("declare required tests before running diagnostics")
    return (
        all(results.get(name) == "Pass" for name in required)
        and "Fail" not in results.values()
    )

required = {"pcie", "nvbandwidth"}
for status in ("Skip", "Not Run", "Fail", "Pass"):
    results = {"pcie": "Pass", "nvbandwidth": status}
    complete = coverage_complete(required, results)
    assert complete == (status == "Pass")
    print(f"nvbandwidth={status:7} coverage_complete={complete}")
assert not coverage_complete(required, {"pcie": "Pass"})
assert not coverage_complete(required, {
    "pcie": "Pass", "nvbandwidth": "Pass", "memory": "Fail",
})
try:
    coverage_complete(set(), {})
except ValueError:
    pass
else:
raise AssertionError("an empty plan must not pass vacuously")nvbandwidth=Skip coverage_complete=False
nvbandwidth=Not Run coverage_complete=False
nvbandwidth=Fail coverage_complete=False
nvbandwidth=Pass coverage_complete=TrueEven the final True isn't permission to unquarantine. Identity, telemetry freshness, process state, workload canaries, ownership, and the other required gates must still pass.
Downloadable receipt analyzer
The fixture contains eight synthetic receipts spanning allocator fragmentation, application capacity, outside-PyTorch ownership, device fault, fabric fault, clock limiting, process-corrupting CUDA error, and driver/runtime failure.
The analyzer is a read-only worksheet. It doesn't connect to hardware, run diagnostics, or change cluster state. It emits a primary hypothesis and a separate must_relaunch flag so a hardware finding can't hide an unsafe process state. A false flag means only “no listed relaunch-required error,” not “healthy.”
Its inputs are already normalized. new_xids and ECC increments cover one incident window; an empty list or zero counter requires a successful collection, not a failed telemetry query. clock_event_reasons includes only limiters correlated with an unexpected regression. An operator or version-pinned parser has decoded DCGM defect classes from the full code and message; raw Fail, Skip, and Not Run aren't defect classes. CUDA labels come from exact enums and API context, not substring matches. The relaunch set is illustrative, not an exhaustive replacement for the CUDA catalog.[9]
For memory arithmetic, samples must share device scope and time. Missing memory readings or an unavailable failed-request size use JSON null. The analyzer rejects nonfinite, negative, and contradictory numbers rather than clamping them into a plausible result (accounting comparisons allow 0.000001 GiB rounding tolerance). Native split-block logic requires both allocator_backend="native" and a captured OOM with a positive request size. Memory layout alone doesn't establish allocation failure. The 4.0 GiB outside-PyTorch threshold is a fixture policy, not a universal alarm threshold.
Run the downloadable analyzer from the article directory. The code below executes that same source, avoiding a second implementation that could drift:
import runpy

runpy.run_path("assets/analyze_gpu_receipts.py", run_name="__main__")r-7812: allocator-fragmentation | outside=2.68 GiB | must_relaunch=False
r-7813: application-capacity | outside=0.20 GiB | must_relaunch=False
r-7814: outside-pytorch | outside=16.40 GiB | must_relaunch=False
r-7815: device-memory-fault | outside=1.10 GiB | must_relaunch=False
r-7816: fabric-fault | outside=1.00 GiB | must_relaunch=False
r-7817: clock-limited | outside=1.00 GiB | must_relaunch=False
r-7818: process-corrupted | outside=0.70 GiB | must_relaunch=True
r-7819: driver-runtime | outside=unknown | must_relaunch=FalseFor r-7813, live allocation plus the request is 39.10 + 1.00 = 40.10 GiB, above the fixture's entire 40 GiB capacity. That supports reducing live demand even before attributing other users. For r-7819, NVML initialization failed: its outside-PyTorch value must remain unknown, not 0.00 GiB. Neither a hypothesis nor a false relaunch flag authorizes re-admission.
Hold the memory layout constant
Keep r-7812's memory readings and change only the event evidence. Predict which cases support fragmentation. The successful case has no recorded allocation failure; its leftover request-size field mustn't create one. Here success is the captured operation result, not a later query that cleared an earlier error.
import json
import runpy
from pathlib import Path

analyze = runpy.run_path("assets/analyze_gpu_receipts.py")["analyze"]
original = json.loads(Path("assets/gpu_failure_receipts.json").read_text())[0]
cases = [
    ("captured OOM", original, "allocator-fragmentation"),
    ("no recorded failure", dict(original, cuda_error="success"), "unclassified"),
    ("OOM, size unavailable", dict(original, oom_request_gib=None), "oom-unresolved"),
]
for name, row, expected in cases:
    result = analyze(row)
    assert result["hypothesis"] == expected
    print(f"{name}: {result['hypothesis']}")

assert analyze(dict(original, oom_request_gib=0))["hypothesis"] == "oom-unresolved"
for change in (
    {"allocator_backend": []}, {"receipt_id": ""},
    {"capacity_gib": 10**400}, {"oom_request_gib": True},
):
    try:
        analyze(dict(original, **change))
    except ValueError:
        pass
    else:
raise AssertionError(f"invalid receipt accepted: {change}")captured OOM: allocator-fragmentation
no recorded failure: unclassified
OOM, size unavailable: oom-unresolvedThe missing size weakens the fragmentation inference while preserving the reported OOM. The successful case still shows memory pressure worth investigating; it supplies no failed allocation to explain. None of these labels substitutes for device-health evidence or clears quarantine.
When two signals arrive together
Suppose r-7818 reports both illegal address and an Xid. The Xid still needs catalog interpretation, but the process-relaunch requirement can't wait for that classification. Predict both outputs before running this extension:
import json
import runpy
from pathlib import Path

analyze = runpy.run_path("assets/analyze_gpu_receipts.py")["analyze"]
rows = json.loads(Path("assets/gpu_failure_receipts.json").read_text())
mixed = dict(rows[6], new_xids=[31])
result = analyze(mixed)
assert result["hypothesis"] == "xid-event"
assert result["must_relaunch"] is True
print(result["hypothesis"], "| process relaunch required:", result["must_relaunch"])

contained = dict(rows[6], cuda_error="contained", new_xids=[94])
assert analyze(contained)["must_relaunch"] is True

missing = dict(rows[0], nvml_device_used_gib=None)
result = analyze(missing)
assert result["hypothesis"] == "incomplete-memory"
assert result["outside_gib"] is None
print(result["hypothesis"], "| outside memory:", result["outside_gib"])

async_allocator = dict(rows[0], allocator_backend="cudaMallocAsync")
assert analyze(async_allocator)["hypothesis"] == "oom-unresolved"
print("native fragmentation inference withheld for cudaMallocAsync")xid-event | process relaunch required: True
incomplete-memory | outside memory: None
native fragmentation inference withheld for cudaMallocAsyncThese are local classification checks, not injected GPU failures. Real automation also needs authenticated ownership, sample freshness, incident deduplication, and a durable quarantine state. A later receipt with no new events mustn't clear an existing quarantine. Re-admission requires its own authorized transition through the gates above.
Pitfalls that widen blast radius
- Calling cached reserve a leak. Reserved memory is allocator policy; snapshot block history decides whether fragmentation is plausible.
- Reading NVML delta as proof of another process. Direct CUDA, NCCL, libraries, and peer processes all need attribution. PyTorch-managed CUDA graph pools can already be inside its reserve.
- Retrying in a corrupted CUDA process. Exact runtime error semantics decide whether relaunch is mandatory.
- Treating every Xid alike. Xid is a structured clue; catalog guidance and surrounding evidence decide scope.
- Treating Skip as Pass. Missing plugin coverage can't satisfy a readiness gate.
- Restarting before preservation. The restart may clear the only allocator or kernel evidence.
- Draining for convenience. Shared-node eviction and ephemeral-data loss require platform authority and review.
- Re-admitting after one probe. Short probes miss allocation-cycle fragmentation, topology load, and thermal soak failures.