Personalize this lesson
Adapt explanations and teaching visuals to your background and preferred voice.
Your vector-add kernel passed every correctness check yesterday. Suppose the same source now takes 300 milliseconds on its first call, or fails on a newer GPU with "no kernel image is available." Reading the source again won't explain either symptom. The GPU never executes CUDA C++ or Python directly.
The accelerator field guide mapped execution and memory owners across hardware. The parallel primitives lab then made synchronization scope, reduction trees, and prefix dependencies measurable. Keep those habits. Here we follow compiler artifacts between source and hardware, because each boundary owns a different class of bugs.
One addition, several representations
For 1,000 pairs of numbers, add each pair into a separate output slot. At index zero, ; at index one, . In general, write for each valid index .
CUDA C++ expresses the work from one thread's point of view. With 256 threads per block, 1,000 elements require four blocks: 1,024 threads, of which 24 must skip memory access. The same fixture below also checks lengths immediately around a block boundary.
Save this as vector_add.cu. It requires a CUDA toolkit to build and compatible NVIDIA hardware to run. The checks use small, exactly representable FP32 values; exact equality here isn't a general tolerance policy for reductions or matrix multiplication.
#include <cuda_runtime.h>

#include <cmath>
#include <cstddef>
#include <cstdlib>
#include <iostream>
#include <limits>
#include <stdexcept>
#include <vector>

void check(cudaError_t status) {
    if (status != cudaSuccess) {
        std::cerr << cudaGetErrorString(status) << "\n";
        std::exit(1);
    }
}

__global__ void add_kernel(
    const float* x,
    const float* y,
    float* out,
    int n
) {
    std::size_t i = static_cast<std::size_t>(blockIdx.x) * blockDim.x + threadIdx.x;
    if (i < static_cast<std::size_t>(n)) {
        out[i] = x[i] + y[i];
    }
}

void launch_add(const float* x, const float* y, float* out, int n) {
    if (n < 0) throw std::invalid_argument("negative length");
    if (n == 0) return;  // A zero-block GPU launch is invalid.
    constexpr int threads = 256;
    int blocks = n / threads + (n % threads != 0);
    add_kernel<<<blocks, threads>>>(x, y, out, n);
}

bool matches(const std::vector<float>& actual,
             const std::vector<float>& expected) {
    if (actual.size() != expected.size()) return false;
    for (std::size_t i = 0; i < actual.size(); ++i) {
        if (!std::isfinite(actual[i]) || actual[i] != expected[i]) return false;
    }
    return true;
}

bool run_case(int n) {
    std::vector<float> x(n), y(n), expected(n), out(n);
    for (int i = 0; i < n; ++i) {
        x[i] = 0.25F * i;
        y[i] = float(i % 7 - 3);
        expected[i] = x[i] + y[i];
    }

    float *d_x, *d_y, *d_out;
    check(cudaMalloc(&d_x, n * sizeof(float)));
    check(cudaMalloc(&d_y, n * sizeof(float)));
    check(cudaMalloc(&d_out, n * sizeof(float)));
    check(cudaMemcpy(d_x, x.data(), n * sizeof(float), cudaMemcpyHostToDevice));
    check(cudaMemcpy(d_y, y.data(), n * sizeof(float), cudaMemcpyHostToDevice));

    // All-one FP32 bit patterns are NaNs: skipped writes must fail the check.
    check(cudaMemset(d_out, 0xff, n * sizeof(float)));
    launch_add(d_x, d_y, d_out, n);
    check(cudaGetLastError());
    check(cudaDeviceSynchronize());
    check(cudaMemcpy(out.data(), d_out, n * sizeof(float), cudaMemcpyDeviceToHost));

    check(cudaFree(d_x));
    check(cudaFree(d_y));
    check(cudaFree(d_out));

    bool correct = matches(out, expected);
    std::cout << (correct ? "PASS" : "FAIL") << " n=" << n << "\n";
    return correct;
}

int main() {
    // Test the checker itself: NaNs and wrong values must fail.
    if (matches({std::numeric_limits<float>::quiet_NaN()}, {4.0F}) ||
        matches({3.0F}, {4.0F}) || matches({}, {4.0F})) return 1;
    launch_add(nullptr, nullptr, nullptr, 0);  // No GPU access.
    for (int n : {1, 255, 256, 257, 1000}) {
        if (!run_case(n)) return 1;
    }
    return 0;
}
Successful execution prints PASS n=1, PASS n=255, PASS n=256, PASS n=257, and PASS n=1000. Distinct input values help catch misplaced writes; checking finiteness prevents a NaN from disappearing inside a maximum-error reduction. These small fixtures don't test large-index overflow, arbitrary strides, or aliasing.
At source level, you can inspect the bounds check and the index formula. You can't yet prove which machine instructions were emitted, how many physical registers they require, or whether a deployed binary contains code for the target GPU.
NVIDIA's offline compiler driver, nvcc, coordinates separate host and device compilation. For this SIMT device kernel, the compilation path reaches Parallel Thread Execution (PTX), a versioned virtual instruction set architecture (ISA). PTX names virtual registers such as %r0 and %f0; these names don't assign physical registers. It still specifies a target feature set, and its producer can optimize for that target. A PTX file isn't independent of architecture, ISA version, or driver support.[1][2]
The optimizing assembler, ptxas, transforms PTX into a CUDA binary, called a cubin, for a specific streaming multiprocessor target such as sm_90. A cubin is an ELF container holding encoded GPU machine instructions and metadata.[3] Target compilation allocates physical registers, schedules instructions, and may spill values to memory. The proprietary allocator's exact algorithm isn't a public contract. Nor does scheduling guarantee that every load's latency is hidden.
Engineers commonly call the human-readable native instruction listing SASS. SASS isn't an executable artifact or a portable source format. It's a disassembly of target-specific machine instructions stored in a cubin.
This illustrative PTX fragment expresses the core arithmetic. It omits declarations, indexing, and bounds handling; it isn't a complete PTX file or captured compiler output:
// Illustrative virtual-register operations.
ld.global.f32   %f1, [%rd3];
ld.global.f32   %f2, [%rd4];
add.f32         %f3, %f1, %f2;
st.global.f32   [%rd5], %f3;
What should the native version look like? Build and disassemble your own cubin below. Locate the two input loads, addition, output store, and edge predicate. Check whether a physical register is reused after its old value's last use. The register numbers, load widths, instruction order, and total allocation depend on the build; an invented SASS listing can't establish them.
There can also be an earlier compiler layer. NVVM intermediate representation (IR) is NVIDIA's GPU-oriented subset and extension of LLVM IR. Language frontends can generate NVVM IR, and libNVVM compiles compatible NVVM IR into PTX.[4][5] That makes this conceptual path useful:
Don't turn a conceptual compiler layer into a deployment promise. nvcc publicly documents source-to-PTX and PTX-to-cubin stages; it doesn't promise a stable, human-readable NVVM file for every build. Another frontend may use different IRs before it reaches PTX, and a non-NVIDIA backend won't target PTX at all. CUDA Tile, introduced later, has a separate Tile IR path; the SIMT path here isn't a universal pipeline for every CUDA language.
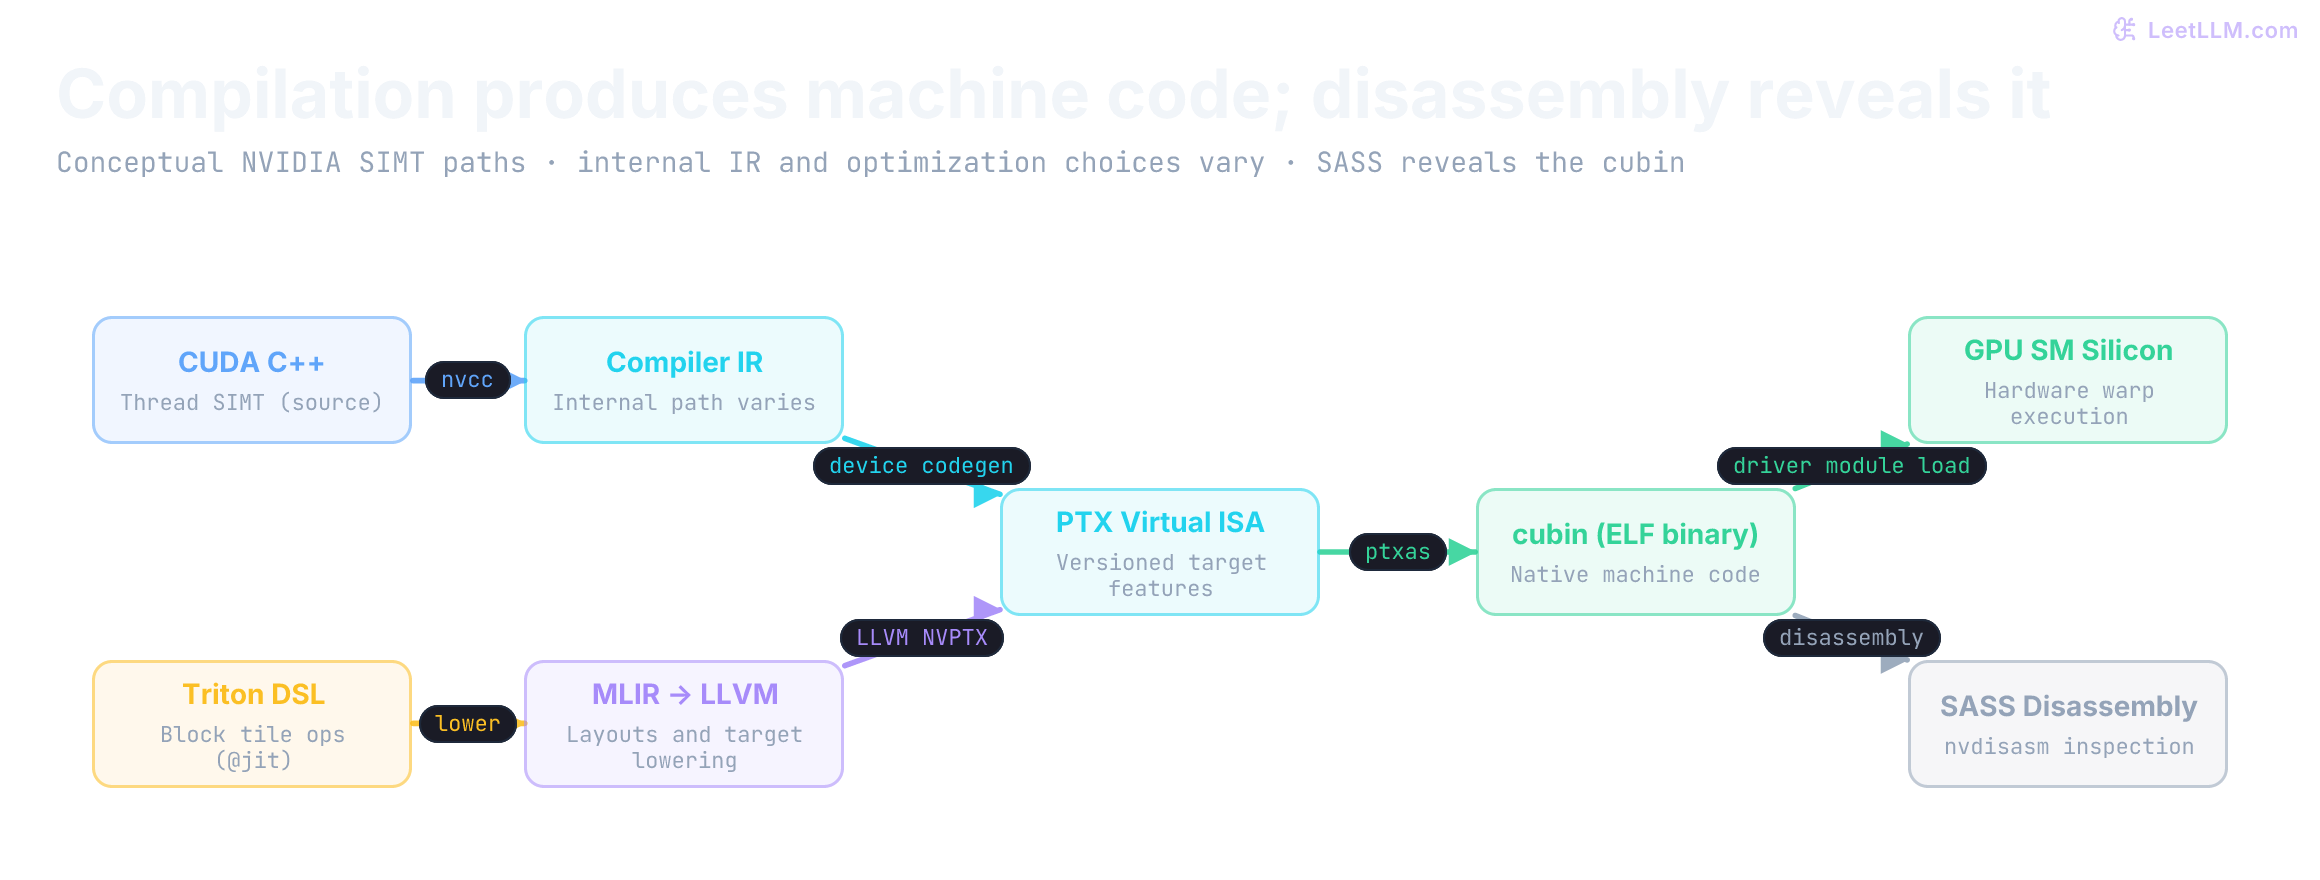
You find an FFMA instruction in nvdisasm output. Which layer has supplied the strongest evidence that this native operation exists?
Answer
The target cubin. nvdisasm reads encoded machine instructions from a cubin and renders them as SASS. A source expression or PTX instruction can suggest an FFMA, but a later compiler stage may still fuse, split, remove, or replace it.
nvcc builds a package, not one universal binary
A CUDA translation unit may contain CPU host code and GPU device code. nvcc separates those paths, sends the host path to a supported C++ compiler, compiles device code for requested virtual and real architectures, and embeds device images into the host object. The container of one or more device images is a fatbinary, usually shortened to fatbin.[1]
The distinction between compute_90 and sm_90 records intent:
| Target spelling | Artifact meaning | Runtime consequence |
|---|---|---|
compute_90 | PTX using the virtual feature set associated with compute capability 9.0 | Driver may just-in-time compile it for a compatible current or later GPU |
sm_90 | Cubin containing native code assembled for the 9.0 hardware target | Compatible GPU can load it without PTX code generation |
| Both in a fatbin | Native code for known deployment plus PTX fallback | Loader prefers compatible binary and retains a forward-compatibility path |
Ordinary PTX targets such as compute_90 provide a forward path to compatible later NVIDIA targets, not to older GPUs missing required features. The driver must also understand the emitted PTX ISA version. A toolkit upgrade can therefore raise the required driver version even when compute_90 stays unchanged.
Target suffixes matter: architecture-specific PTX such as compute_90a doesn't have the same forward-compatibility guarantee, and family-specific targets such as compute_100f restrict compatibility to their documented family. Cubins are narrower still, with compatibility rules within supported major compute-capability families, not across major versions. Check the exact target, not just the word “PTX.”[1]
The runtime flow branches after packaging:
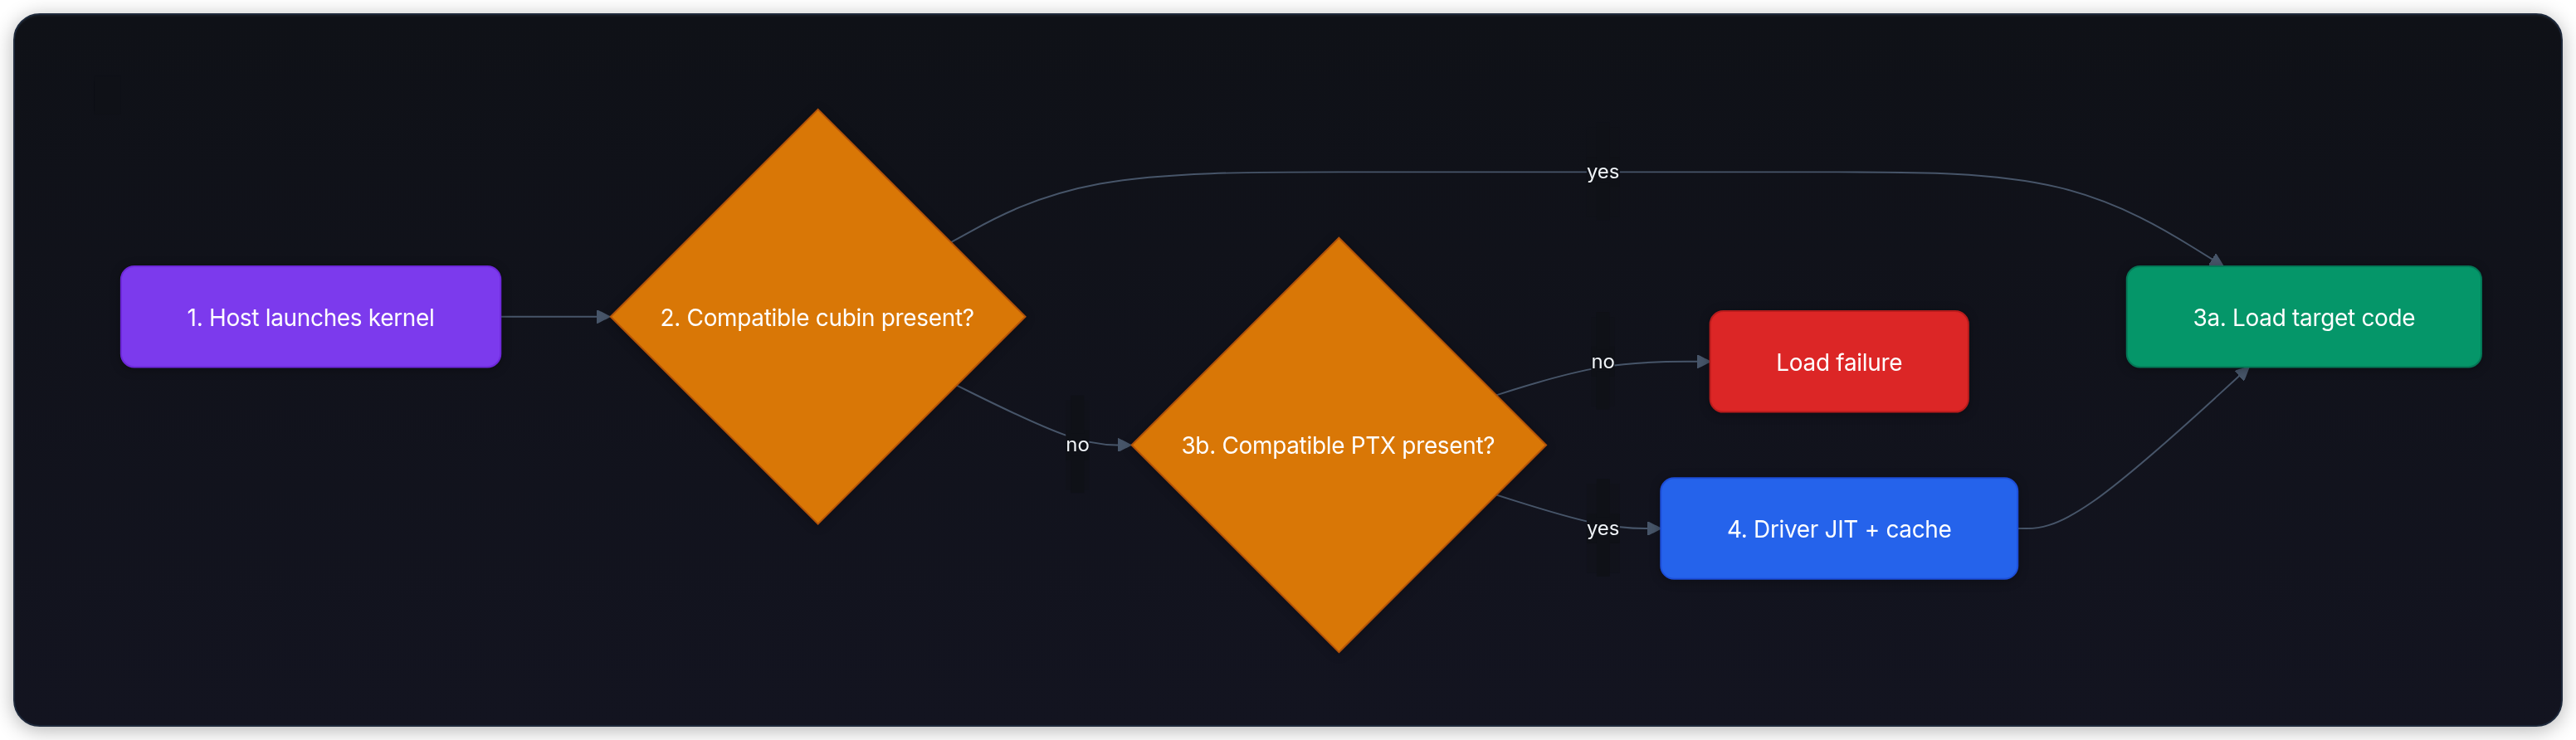
This branch explains two otherwise confusing observations. A cold process may pay compilation or lazy-loading cost before the first kernel. A package may run on the build machine yet fail on another GPU because neither a compatible cubin nor usable PTX was embedded.
Produce artifacts you can inspect
On a supported CUDA development system, compile the CUDA source for one native Hopper target and keep PTX for future targets. --keep asks nvcc to retain supported intermediate files, while the two --generate-code entries package both sm_90 cubin and compute_90 PTX. Offline compilation and disassembly don't require a GPU, but they do require these NVIDIA tools and a supported host toolchain. Apple Clang alone can't run this lab. Use your deployment targets instead of copying sm_90 onto unrelated hardware.
mkdir -p build/keep

nvcc -O3 -lineinfo \
  --generate-code arch=compute_90,code=sm_90 \
  --generate-code arch=compute_90,code=compute_90 \
  --keep --keep-dir build/keep \
  vector_add.cu -o build/vector_add
Create standalone PTX and cubin files as well. Keeping both makes the boundary explicit and gives nvdisasm a cubin it can read directly.
nvcc -O3 --ptx \
  --gpu-architecture=compute_90 \
  vector_add.cu -o build/vector_add.compute_90.ptx

nvcc -O3 -lineinfo --cubin \
  --generate-code arch=compute_90,code=sm_90 \
  vector_add.cu -o build/vector_add.sm_90.cubin
Now inspect the package before judging performance. cuobjdump accepts a standalone cubin or a host executable, object, library, or external fatbin. nvdisasm accepts standalone cubins and adds richer control-flow and register-liveness views.[3]
# What did the host executable package?
cuobjdump --list-elf build/vector_add
cuobjdump --list-ptx build/vector_add

# Read virtual and native instruction forms.
cuobjdump --dump-ptx build/vector_add > build/embedded.ptx
cuobjdump --dump-sass build/vector_add > build/embedded.sass

# Check per-kernel registers, local memory, shared memory, and stack use.
cuobjdump --dump-resource-usage build/vector_add

# Read one standalone cubin with source lines.
nvdisasm --print-code \
  --print-line-info \
  build/vector_add.sm_90.cubin > build/vector_add.lines.sass

# Generate a separate register-liveness view.
nvdisasm --print-code \
  --print-life-ranges \
  build/vector_add.sm_90.cubin > build/vector_add.liveness.sass
Read these outputs as a chain of evidence:
- PTX header: Check
.version,.target, address size, and kernel entry name. A mismatched.targetcan explain a deployment failure before launch. - PTX body: Look for global loads, bounds predication, arithmetic, and the store. This confirms virtual operations, not final scheduling.
- Resource report: Record registers, static shared memory, local memory, and stack per kernel. Local memory can indicate spills, although not every local-memory use is a spill.
- SASS listing: Confirm native loads, arithmetic, stores, predicates, and architecture-specific instructions. Compare against compiler flags and source line info.
- Profiler trace: Measure executed instructions, memory behavior, and time on the target GPU. Static disassembly can't tell you which path dominates wall time.
⚠️ Common mistake: A shorter SASS listing isn't automatically faster. Instruction latency, issue rate, dependency chains, memory transactions, occupancy, and input-dependent control flow still decide runtime behavior.
Register pressure, occupancy cliffs, and spilling
Register count constrains how many blocks can reside on an SM. It doesn't tell you how busy the execution units are. Shared memory, block size, block limits, allocation granularity, and architecture also constrain residency; dependencies and available work determine what resident warps actually execute.
Hopper compute capability 9.0 and Blackwell 10.0 support up to 64 resident warps per SM. Ada 8.9 and Blackwell 12.0 support 48. These targets have 65,536 32-bit registers per SM, but their other limits differ. “32 registers means 100% occupancy” therefore isn't a universal rule.[6][7][8]
Try a resource puzzle with explicit assumptions: 256 threads per block (eight warps), 65,536 registers per SM, a 64-warp limit, and allocations rounded to 256 registers per warp. Ignore shared memory, block-count limits, and hardware partition constraints. This is a simplified model, not an occupancy calculator for a named GPU.
| Registers per thread | Rounded registers per block | Resident blocks in this model | Resident warps | Occupancy against 64 warps |
|---|---|---|---|---|
| 32 | 8,192 | 8 | 64 | 100% |
| 33 | 10,240 | 6 | 48 | 75% |
| 41 | 12,288 | 5 | 40 | 62.5% |
| 65 | 18,432 | 3 | 24 | 37.5% |
| 129 | 34,816 | 1 | 8 | 12.5% |
import math

def resident_warps(registers, *, warp_limit=64, shared_per_block=0):
    warps_per_block = 8
    registers_per_warp = math.ceil(32 * registers / 256) * 256
    blocks = min(65536 // (warps_per_block * registers_per_warp),
                 warp_limit // warps_per_block)
    if shared_per_block:
        blocks = min(blocks, (96 * 1024) // shared_per_block)
    return blocks * warps_per_block

assert [resident_warps(r) for r in (32, 33, 41, 65, 129)] == [64, 48, 40, 24, 8]
for r in (32, 33, 41, 65, 129):
    w = resident_warps(r)
    print(f"R={r}: {w} warps, {100 * w / 64:g}%")
assert resident_warps(33, warp_limit=48) == 48
assert resident_warps(32, shared_per_block=32 * 1024) == 24
print("R=33, 48-warp limit: 100%; R=32, shared-memory constraint: 37.5%")R=32: 64 warps, 100%
R=33: 48 warps, 75%
R=41: 40 warps, 62.5%
R=65: 24 warps, 37.5%
R=129: 8 warps, 12.5%
R=33, 48-warp limit: 100%; R=32, shared-memory constraint: 37.5%The last case additionally assumes a 96 KiB shared-memory budget. It shows why low register use alone doesn't ensure full residency. For actual hardware, use the CUDA occupancy APIs with the compiled kernel, launch size, and dynamic shared-memory size, then compare theoretical residency with achieved occupancy and stall data. Higher occupancy can help hide latency; it can also lose to a lower-occupancy kernel with better reuse or fewer instructions.[9]
Spills change the memory workload
Thread-private .local memory is backed by device memory and can be served through caches. A local access isn't automatically an HBM round trip, and local allocations can have causes other than spilling. Spill cost depends on access frequency, cache behavior, and dependencies; there is no universal 10–50× penalty.
CUDA 13.0 introduced opt-in shared-memory register spilling in whole-program compilation mode. It prioritizes shared memory and falls back to local memory when necessary. The documented feature doesn't support dynamic shared memory or warp register reallocation. More shared memory can reduce block residency, so evaluate the resulting resource report and timing together. Explicit launch bounds are recommended for predictable allocation, not a universal prerequisite.[10]
Parsing ptxas -v reports
To catch register pressure and spills before running a kernel, pass -Xptxas -v (or --ptxas-options=-v) to nvcc:
nvcc -O3 -Xptxas -v --gpu-architecture=sm_90 vector_add.cu -o build/vector_addSave the actual compiler log. Depending on the build, it reports allocated registers, stack frame size, spill-load/store byte counts, shared memory, and constant-memory usage. Don't fill these in from the source or the puzzle above. A compiler spill-byte count isn't measured runtime traffic or a count of distinct spilled variables; loops and branches change how often instructions execute.
Use this blank comparison to design a controlled experiment:
| Build | Registers/thread | Stack and spill report | Shared bytes/block | Predicted residency | Warm time and profiler evidence |
|---|---|---|---|---|---|
| Baseline | Collect | Collect | Collect | Calculate for target | Measure |
| Register-cap variant | Collect | Collect | Collect | Recalculate | Measure |
--maxrregcount=N requests a register ceiling; values below the ABI minimum are raised to that minimum. The compiler may spill or change instructions to meet the limit. __launch_bounds__(maxThreadsPerBlock, minBlocksPerMultiprocessor) supplies constraints used to derive a register limit and guide optimization. Launching more than the specified maximum threads per block fails; the second argument doesn't guarantee that many blocks will reside despite other resource limits. Function-specific register qualifiers and toolkit rules can alter how options interact. Read the resulting report, not just the requested flags.[1][11]
Keep an artifact manifest
A benchmark result becomes easier to reproduce when its compiler state travels beside it. This is a template, not a captured build. Replace every placeholder and record at least these fields:
{
  "source_revision": "git-sha",
  "compiler": "nvcc",
  "toolkit_version": "capture nvcc --version",
  "driver_version": "capture nvidia-smi",
  "virtual_target": "compute_90",
  "native_targets": ["sm_90"],
  "compile_flags": ["-O3", "-lineinfo"],
  "embedded_images": ["compute_90 PTX", "sm_90 cubin"],
  "kernel": "add_kernel",
  "correctness": "record actual PASS/FAIL for n=1,255,256,257,1000"
}
Hash the source, compile options, target, compiler version, and any compile-time constants into a JIT cache key. Shape-specialized kernel systems also need shape, stride, data type, alignment, and algorithmic mode when those values change generated code. Caching only by function name can silently load a valid cubin for the wrong contract.
For example, two variants can have 1,000 elements but strides 1 and 2. A specialization that assumes stride 1 mustn't be reused for stride 2. Architecture suffixes are another contract: Hopper's WGMMA requires sm_90a, whereas baseline bulk asynchronous copies are available with sm_90. Enabling a feature doesn't prove a particular kernel uses it. Unsupported cubins fail compatibility checks; don't describe this as an inevitable device crash.[2]
This CPU exercise builds a canonical key from an explicit compilation recipe, including launch geometry and pipeline stages. It doesn't compile a kernel or implement a production artifact store.
from dataclasses import asdict, dataclass, replace
import hashlib
import json

@dataclass(frozen=True)
class Recipe:
    source_sha256: str
    toolchain: str
    target: str
    flags: tuple[str, ...]
    shape: tuple[int, ...]
    strides: tuple[int, ...]
    dtype: str
    block: int
    num_warps: int = 4
    num_stages: int = 2

    def key(self):
        encoded = json.dumps(asdict(self), sort_keys=True, separators=(",", ":"))
        return hashlib.sha256(encoded.encode()).hexdigest()

base = Recipe(
    source_sha256=hashlib.sha256(b"vector-add-example-v1").hexdigest(),
    toolchain="illustrative-compiler-build-A", target="sm_90",
    flags=("-O3",), shape=(1000,), strides=(1,), dtype="float32", block=256,
)
assert base.key() == replace(base).key()
variants = [
    replace(base, source_sha256=hashlib.sha256(b"v2").hexdigest()),
    replace(base, toolchain="illustrative-compiler-build-B"),
    replace(base, target="sm_100"), replace(base, flags=("-O3", "--use_fast_math")),
    replace(base, shape=(257,)), replace(base, strides=(2,)),
    replace(base, dtype="float16"), replace(base, block=128),
    replace(base, num_warps=8), replace(base, num_stages=3),
]
assert len({base.key(), *(variant.key() for variant in variants)}) == 11
cache = {base.key(): "fixture-artifact-handle"}
assert cache.get(replace(base).key()) == "fixture-artifact-handle"
assert all(cache.get(variant.key()) is None for variant in variants)
print("same recipe: hit; 10 code-generation changes: miss")same recipe: hit; 10 code-generation changes: missThe marker string stands in for source bytes only in this exercise. A real cryptographic cache key must cover transitive includes, linked device libraries, compiler components, backend options, and assumed pointer alignment. Alignment can enable wider loads; it doesn't require the compiler to emit them. Preserve flag order because repeated flags can override earlier ones. Runtime tensor values needn't enter the key unless compilation specializes on them. This dataclass receives known fixture values; frozen=True isn't input validation or a guarantee that caller-supplied nested objects are immutable. Store the artifact's hash and compatibility metadata separately; a cache hit isn't evidence that an untrusted binary is safe to load.
Suppose vector_add.cu includes scale.cuh, which defines a multiplier. The CUDA file hasn't changed, but the multiplier changes from 1 to 2. Predict what a source-file-only key retrieves for inputs 4 and 5:
headers_v1 = {"scale.cuh": b"#define SCALE 1\n"}
headers_v2 = {"scale.cuh": b"#define SCALE 2\n"}
source_only_cache = {base.key(): lambda x, y: (x + y) * 1}
stale_result = source_only_cache[base.key()](4, 5)
assert stale_result == 9 and stale_result != (4 + 5) * 2

def dependency_key(recipe, headers):
    dependencies = [(path, hashlib.sha256(data).hexdigest())
                    for path, data in sorted(headers.items())]
    encoded = json.dumps([recipe.key(), dependencies], separators=(",", ":"))
    return hashlib.sha256(encoded.encode()).hexdigest()

old_key = dependency_key(base, headers_v1)
new_key = dependency_key(base, headers_v2)
assert old_key != new_key
dependency_cache = {old_key: "old-artifact"}
assert dependency_cache.get(new_key) is None
print(f"source-only hit: result={stale_result}, required=18")
print("changed included header: dependency-aware key misses")source-only hit: result=9, required=18
changed included header: dependency-aware key missesThe callable models a cached compiled operation; it doesn't compile CUDA. The explicit header dictionary also assumes the full dependency set has already been collected. A real build must discover nested includes and resolve their paths consistently. This responsibility extends to precompiled headers: NVRTC documents that checking whether their header contents changed belongs to the caller.[12]
JIT is part of request latency
Just-in-time (JIT) compilation moves work from build time to runtime. NVIDIA's runtime compiler, NVRTC, accepts CUDA C++ strings and can emit PTX, cubin, or link-time optimization IR depending on target and options. In CUDA 13.4, its Tile path emits CUDA Tile IR, rather than directly generating a Tile cubin. The CUDA Driver API loads compatible outputs, and nvJitLink can combine device-code inputs into a linked cubin.[12][13]
PTX loaded at runtime is compiled by the device driver's JIT compiler. Generated cubins enter a compute cache, and a driver upgrade invalidates that cache so the new JIT compiler can regenerate code.[9]
That runtime behavior creates an operational contract:
| Contract | Evidence to capture | Failure when omitted |
|---|---|---|
| Compilation identity | Source or IR hash, compiler version, flags, target, specialization values | Wrong artifact reused or rollout can't be reproduced |
| Load compatibility | GPU compute capability, driver version, PTX target, cubin targets | Missing image or unsupported PTX at module load |
| Cold-start budget | Compile time, module-load time, cache state, first launch time | First request violates latency objective while steady state looks healthy |
| Correctness | Reference outputs, tolerances, edge shapes, alignment and mask cases | Fast specialization returns wrong values on a boundary case |
| Performance | Warmups, synchronization, target GPU, input shapes, precision, profiler evidence | JIT or lazy-load time is mistaken for kernel execution time |
Eight ranks, two different cache questions
Suppose eight workers encounter the same missing specialization. They may all compile it. That wastes startup time, but doesn't by itself prove cache corruption. Ask separately: Can readers see incomplete files? Can workers avoid duplicate compilation?
In the pinned Triton file-cache implementation, inspected on October 10, each writer uses a unique PID/UUID temporary directory inside the cache, closes the completed file, and publishes it with os.replace. It doesn't perform an fsync in that path or acquire an advisory compilation lock. A lock_path attribute exists, but an attribute isn't evidence that locking occurs. Its group metadata checks child-file existence, not an atomic transaction over every artifact.[14]
On a filesystem providing the required same-filesystem atomic replacement semantics, publishing a completed file prevents readers from opening a partially written destination. This is atomic visibility, not proof of persistence after power loss. Durable publication needs additional file/directory synchronization and a filesystem-specific failure contract. Concurrent compilers can still consume redundant CPU and memory. Host launcher shared objects, device cubins, and metadata are distinct artifacts; avoid treating every Triton cache entry as a kernel .so.
For a cache you implement, a cooperating-writer lock can reduce duplicate work: acquire it, recheck the exact key, compile only if still missing, publish, then release. Check the lock and rename semantics on the actual local or shared filesystem. Locks don't compensate for an incomplete specialization key or a writer that ignores the protocol.
A rank-0 warmup followed by a barrier is another possible initialization design. It requires accessible shared storage, identical code-generation recipes, and failure/timeout handling. Different targets or worker-local directories still miss after the barrier. Predict this example's result before running it:
rank_recipes = [base, replace(base, target="sm_100")]
shared_cache = {rank_recipes[0].key(): "rank-0-artifact"}
hits = [recipe.key() in shared_cache for recipe in rank_recipes]
assert hits == [True, False]
assert base.key() not in {}  # A separate worker-local cache is still empty.
print("after rank-0 warmup: shared-cache hits [True, False]; local cache misses")after rank-0 warmup: shared-cache hits [True, False]; local cache missesAn invalid ELF header calls for an investigation, not an automatic diagnosis. Preserve the bad artifact's hash, actual path and type, compiler/writer versions, recipe, logs, and filesystem details. Test whether the responsible writer exposes incomplete bytes, selects the wrong artifact, or leaves invalid metadata after a failure. The CPU exercise models recipe lookup; it doesn't exercise distributed barriers, filesystem races, or GPU loading.
Use the driver's switches to test both deployment branches. The first command forces embedded PTX through JIT and disables its disk cache for the run. The second disables PTX JIT, so success requires a compatible embedded cubin.[15]
CUDA_FORCE_PTX_JIT=1 CUDA_CACHE_DISABLE=1 ./build/vector_add
CUDA_DISABLE_PTX_JIT=1 ./build/vector_add
Run each mode in a fresh process. These shell assignments affect only that invocation; unset any conflicting JIT variables you previously exported. These are packaging tests, not kernel benchmarks.
CUDA module loading is lazy by default in current documentation. First use can therefore include module or kernel loading even when a compatible cubin exists. Warm the exact kernel or use eager loading when a latency-sensitive service needs that work outside the request path.[15]
A service packages sm_90 cubin plus compute_90 PTX. Its first request on a future compatible GPU is slow, but later requests are fast. What should you separate in the trace?
Answer
Separate process initialization, module loading, PTX-to-cubin JIT, cache write, first kernel launch, and steady-state execution. A fast warm kernel doesn't disprove expensive compilation or loading on the first request.
Same kernel, different unit of thought
CUDA C++ asks you to describe one thread, then organize threads into blocks. Triton asks you to describe one blocked program instance operating on vectors of offsets. Both versions below compute the same masked vector add.
The Triton kernel forms a block of 256 indices, loads two blocks under a mask, adds them, and stores the result. The compiler maps that blocked program to GPU threads and memory operations. The kernel follows Triton's vector-add tutorial; the wrapper below adds explicit input checks.[16][17]
import torch
import triton
import triton.language as tl

@triton.jit
def add_kernel(x_ptr, y_ptr, out_ptr, n, BLOCK: tl.constexpr):
    offsets = tl.program_id(axis=0).to(tl.int64) * BLOCK + tl.arange(0, BLOCK)
    mask = offsets < n
    x = tl.load(x_ptr + offsets, mask=mask, other=0.0)
    y = tl.load(y_ptr + offsets, mask=mask, other=0.0)
    tl.store(out_ptr + offsets, x + y, mask=mask)

def add(x: torch.Tensor, y: torch.Tensor) -> torch.Tensor:
    if not (x.is_cuda and y.is_cuda and x.device == y.device):
        raise ValueError("inputs must share a CUDA device")
    if x.ndim != 1 or y.ndim != 1 or x.shape != y.shape:
        raise ValueError("inputs must be matching one-dimensional vectors")
    if x.dtype != torch.float32 or y.dtype != torch.float32:
        raise ValueError("this fixture supports float32 only")
    if x.requires_grad or y.requires_grad:
        raise ValueError("this wrapper has no autograd rule")
    if not (x.is_contiguous() and y.is_contiguous()):
        raise ValueError("strided views require a different address calculation")
    out = torch.empty_like(x)
    n = x.numel()
    if n:
        with torch.cuda.device(x.device):
            add_kernel[(triton.cdiv(n, 256),)](x, y, out, n, BLOCK=256)
    return out

if __name__ == "__main__":
    for n in (0, 1, 255, 256, 257, 1000):
        i = torch.arange(n, device="cuda", dtype=torch.float32)
        x, y = 0.25 * i, i.remainder(7) - 3
        actual = add(x, y)
        torch.cuda.synchronize(x.device)
        torch.testing.assert_close(actual, x + y, rtol=0, atol=0, equal_nan=False)
        print(f"PASS n={n}")
    try:
        add(x[::2], y[::2])
    except ValueError:
        print("PASS rejected strided views")
    else:
        raise AssertionError("strided views were accepted")
Run this on a supported Linux/PyTorch/Triton CUDA environment. It should print six shape passes and one strided-view rejection. The CPU checks below separately verify index arithmetic; they don't establish Triton compilation or GPU memory safety. Inputs requiring autograd aren't supported by this wrapper: a custom backward rule would be separate work.
The arithmetic stayed fixed. Ownership changed:
| Question | CUDA C++ answer | Triton answer |
|---|---|---|
| What does one source instance own? | One scalar thread | One block of values |
| How is the global index formed? | blockIdx, blockDim, threadIdx | program_id plus arange |
| How are edge elements protected? | Scalar branch or predicate | Vector mask on load and store |
| Who chooses thread mapping? | Programmer chooses block size and per-thread work | Compiler maps blocked program; author supplies block and launch meta-parameters |
| What evidence closes the loop? | Cubin resource report, SASS, profiler, correctness test | Compiler artifacts, generated target code, profiler, correctness test |
Triton removes some thread-level bookkeeping. It doesn't remove the need to reason about coalescing, block size, occupancy, specialization, or numerical behavior. A blocked expression is an optimization hypothesis until generated artifacts and measurements support it.
How Triton compiles: the MLIR lowering pipeline
Triton isn't an interpreter or a simple string-template emitter. It's an optimizing compiler built on the Multi-Level Intermediate Representation (MLIR) framework. It lowers abstract block mathematics into native GPU machine code through a sequence of explicit intermediate dialects:
For the NVIDIA backend at the cited source revision, the stages are ttir, ttgir, llir, ptx, and cubin.[18]
- Triton IR: The frontend translates the Python kernel into MLIR block operations such as loads, stores, and dot products, alongside other dialects' operations. Scalar addition isn't a
tt.addoperation simply because it appears in a Triton kernel. This stage precedes explicit distributed-layout assignment; it doesn't imply the whole compilation is unaware of target options. - TritonGPU IR: Layout encodings describe element ownership across lanes and warps. Optimization passes can improve coalescing, dot-product layouts, and eligible loops' pipelining. Their choices depend on architecture, operations, and meta-parameters.
- LLVM IR: Target lowering introduces GPU-specific operations and allocates shared-memory resources where needed. The inspected backend records shared-memory use during this stage. A plain vector add doesn't require a shared-memory matrix pipeline.
- PTX: The LLVM NVPTX backend emits virtual assembly for NVIDIA targets.
- Cubin: Triton's backend invokes the
ptxasexecutable itself, then reads its generated binary. This isn't the CUDA driver's PTX JIT invoking the toolkit command.
Where do the enticing optimization claims need qualification? A shared-memory swizzle can avoid conflicts for particular access patterns, not every access. A supported loop can overlap asynchronous copies with computation, not necessarily with three or four stages. Contiguous offsets don't prove the base pointer is suitably aligned: a contiguous tensor view can start at an offset. Wider per-thread load instructions also aren't the same thing as one warp transaction or HBM bus saturation. Inspect generated code and profile the actual specialization before claiming any of these outcomes.
Check ownership without a GPU
A CPU enumeration can verify the index arithmetic independently of either compiler. It can't detect generated-code bugs, GPU races, or invalid device memory access. Predict the counts before running it: length 257 requires two 256-lane blocks, with 255 lanes masked out.
def covered_indices(n, block=256, *, include_equal=False):
    if n < 0 or block <= 0:
        raise ValueError("length must be nonnegative and block positive")
    blocks = (n + block - 1) // block
    active = []
    for program in range(blocks):
        for lane in range(block):
            i = program * block + lane
            if i < n or (include_equal and i == n):
                active.append(i)
    return blocks, active

for n in (0, 1, 255, 256, 257, 1000):
    blocks, indices = covered_indices(n)
    assert indices == list(range(n))  # No duplicates, omissions, or excess.
    print(f"n={n}: blocks={blocks}, active={len(indices)}, masked={blocks * 256 - n}")

# Deliberately change < to <=. It only looks correct on full blocks.
assert covered_indices(256, include_equal=True)[1] == list(range(256))
bad = covered_indices(257, include_equal=True)[1]
assert bad[-1] == 257 and bad != list(range(257))
print("off-by-one mask: full block passes; n=257 exposes index 257")n=0: blocks=0, active=0, masked=0
n=1: blocks=1, active=1, masked=255
n=255: blocks=1, active=255, masked=1
n=256: blocks=1, active=256, masked=0
n=257: blocks=2, active=257, masked=255
n=1000: blocks=4, active=1000, masked=24
off-by-one mask: full block passes; n=257 exposes index 257Now change the block size to 128 and repeat. Length 257 needs three blocks, with 127 masked lanes. A passing multiple-of-block test alone misses the off-by-one error; that's why both GPU fixtures include 255 and 257.
Python's integers hid another risk in the first version of the CUDA helper: (n + 255) / 256 overflows signed int near its maximum. The corrected helper uses quotient plus remainder and forms device indices in std::size_t. Check the boundary without allocating billions of elements:
n, block = (1 << 31) - 1, 256
assert n + block - 1 > (1 << 31) - 1
blocks = n // block + (n % block != 0)
padded = blocks * block
assert (blocks, padded, padded - n) == (8388608, 2147483648, 1)
last_index = padded - 1
assert last_index == n  # This last lane must skip memory access.
print("int32 maximum: 8388608 blocks, 2147483648 lanes, 1 masked lane")int32 maximum: 8388608 blocks, 2147483648 lanes, 1 masked laneThe Triton example also widens the program ID before multiplication, so large offsets don't first wrap in a 32-bit intermediate. This exercise proves integer-model arithmetic. It doesn't allocate device buffers, establish a supported grid limit, or test either GPU compiler's generated address calculations.
Six authoring surfaces, six control contracts
A kernel language isn't a ranking from easy to powerful. Each surface chooses which decisions belong to author, compiler, library, and runtime.
CUDA C++
CUDA C++ uses single instruction, multiple threads (SIMT) semantics. You control thread and block geometry, address calculations, synchronization, memory spaces, and low-level intrinsics. That directness fits irregular algorithms, architecture experiments, and cases where a higher layer hides a critical decision. Its portability surface is NVIDIA GPUs, with source, PTX, and fatbins handling generations inside that ecosystem.[9]
Evidence should reach the cubin. Keep ptxas resource output, disassemble native code, profile target hardware, and compare results against a trusted implementation.
Triton block programs
Triton is a Python-embedded domain-specific language (DSL) whose program instances operate on blocks. Its compiler performs block-level data-flow analysis and can automate coalescing, vectorization, shared-memory management, synchronization, and instruction selection.[16] Current project documentation lists NVIDIA and AMD GPU support, but backend support and generated code still vary by hardware and Triton release.[19]
Triton fits custom fusion and dense or structured kernels where block ownership is natural. Inspect specialized IR and target assembly when available, because one Python function can compile into many shape, type, and meta-parameter variants.
CUTLASS and CuTe
CUTLASS supplies CUDA C++ templates for high-performance linear algebra. CuTe, used inside modern CUTLASS, models hierarchical tensor layouts, tensors, copy atoms, and matrix multiply-accumulate atoms. Its C++ surface keeps detailed control over thread-data mapping and architecture features. CuTe DSL brings the same low-level concepts into a Python JIT stack while preserving explicit memory, thread, and data hierarchy.[20]
Consider this family when matrix multiplication, convolution, attention building blocks, or unusual layouts need explicit layout and hardware-atom control. Whether it exposes a needed capability depends on the specific APIs and releases being compared. Expect a steeper layout-algebra learning curve and a larger specialization space. Use CUTLASS profiler or an equivalent harness, inspect PTX and SASS, and keep compile-time policies in the benchmark manifest.
CUDA Tile
CUDA Tile changes CUDA's unit of thought from one SIMT thread to one block operating collectively on immutable multidimensional tiles. The compiler chooses the number of threads per block and maps tile operations onto registers, shared memory, tensor cores, and other hardware resources. SIMT and tile kernels can coexist in one application.[21]
Tooling snapshot, checked October 10, 2026: The CUDA 13.4 guide lists cuTile Python through
cuda.tileand CUDA Tile C++ from toolkit 13.3 onward. Each tile dimension must be a compile-time power of two. Pin the toolkit and language package used for a build; these features aren't assumptions for earlier toolkits.[21]
CUDA Tile offers source portability across NVIDIA generations by hiding thread mapping, not cross-vendor portability. Inspect Tile IR or emitted device images where supported, record compiler version, then profile on each architecture you claim to support.
Pallas
Pallas extends JAX with custom kernels for GPU and tensor processing unit (TPU) backends. Kernels use references (Refs), launch grids, block specifications (BlockSpecs), and backend-specific pipelining or hardware APIs. Shared concepts don't make the APIs interchangeable.[22]
Pallas is useful when JAX composition or GPU and TPU integration matters. Check transformation support and supply derivative rules when needed. JAX 0.11 deprecated the Pallas Triton backend; 0.11.2, released September 17, removed Mosaic GPU's pl.pallas_call support. Mosaic GPU kernels now use jax.experimental.pallas.mosaic_gpu.kernel. The same release removed pl.dot and moved MGPU indexing toward jax.lax.axis_index and axis_size. A tutorial written against an older API may therefore fail before kernel compilation. Pin JAX and backend versions, inspect lowering, and profile each target; Pallas remains under active development.[23]
NKI
Neuron Kernel Interface (NKI) targets AWS Trainium, Inferentia2, Trainium2, and Trainium3 NeuronCores. Its high-level nki.language API handles tensor indexing and placement, while lower-level nki.isa exposes hardware operations for computation, data movement, dynamic control flow, and cross-core communication. The documented execution pattern moves inputs from high-bandwidth memory (HBM) into the on-chip state buffer (SBUF), computes on NeuronCore engines, then stores outputs to HBM.[24]
NKI fits workloads committed to AWS Neuron hardware that need custom operations or tighter control than framework compilation supplies. It isn't a CUDA portability layer. Keep Neuron compiler and instance type in the artifact record, use framework-level correctness comparisons, and collect Neuron profiler evidence.
The comparison is easier to use after each model has a concrete meaning:
| Surface | Author's main unit | Explicit control | Portability boundary | Minimum convincing evidence |
|---|---|---|---|---|
| CUDA C++ | Thread, warp, block | Explicit thread-level control | NVIDIA CUDA GPUs | PTX, cubin resources, SASS, target profile |
| Triton | Blocked program | Tile shape, loads, masks, launch meta-parameters | Supported Triton GPU backends | Specialization key, compiler IR or assembly, target profile |
| CUTLASS/CuTe | Hierarchical layout and hardware atom | Explicit layout, copy, pipeline, and MMA control | NVIDIA CUDA GPUs | Policy manifest, profiler, PTX/SASS, numeric check |
| CUDA Tile | Block-level immutable tiles | Tile partition and operations; compiler owns threads | CUDA Tile-capable NVIDIA stack | Tile/compiler artifact, version pin, per-target profile |
| Pallas | Grid program over Refs and blocks | Memory movement, block specs, backend pipeline APIs | JAX GPU and TPU backends, with backend-specific constraints | JAX/backend pin, lowering evidence, per-target profile |
| NKI | Tile over Neuron memory and engines | SBUF placement plus optional low-level ISA control | AWS Inferentia2 and Trainium families | Neuron compiler record, profiler, framework comparison |
A Triton kernel and a CuTe rewrite pass the same correctness fixture. Triton is faster on H100, while CuTe is faster on B200. What must the review artifact contain before either implementation becomes the default?
Answer
Keep both source revisions, compiler and backend versions, specialization keys, compile flags, native targets, correctness tolerances, cold and warm timings, emitted-code evidence, and per-target profiler results. Choose against the deployment GPU mix and latency objective. One architecture's timing or a PTX instruction count can't establish a portable winner.
Diagnose the first failing boundary
Compiler failures become manageable when you ask which representation last satisfied its contract.
| Symptom | Likely boundary | Evidence to collect | Next action |
|---|---|---|---|
| Source compile rejects type, address space, or intrinsic | Source to frontend IR | Full compiler log, minimal source, language and compiler versions | Reduce to smallest rejected construct; check supported language subset |
ptxas rejects target or instruction | PTX to cubin | PTX header, ptxas log, toolkit version, requested sm | Align PTX feature set, toolkit, and target architecture |
| "No kernel image" at load or launch | Fatbin selection | GPU compute capability, cuobjdump --list-elf, --list-ptx | Package compatible cubin or usable PTX fallback |
| Forced PTX JIT fails, normal mode works | Driver JIT path | Embedded PTX, driver version, JIT error log | Fix PTX compatibility or driver floor; don't treat cubin success as forward-compatibility proof |
| First call is slow, warm calls are fast | Compile or lazy-load path | Fresh-process timeline, cache state, module-loading mode | Precompile, warm exact variants, or move eager loading outside request path |
| Register count rises and throughput falls | IR or target-code optimization | Old and new resource reports, SASS, occupancy and stall profile | Find specialization or code change that extended live ranges or caused spills |
| Edge shape returns wrong values | Source mask or specialization contract | Failing shape, strides, alignment, generated variant, reference output | Fix boundary mask and include shape or stride in specialization key |
nvdisasm rejects host executable | Inspection tool input | File type and packaged image list | Use cuobjdump on host file or extract cubin before nvdisasm |
Don't skip directly from source to profiler. A profiler identifies an executed bottleneck, but it can't explain a missing image that never loaded. Disassembly proves emitted code, but it can't prove correct answers. Correctness tests prove values for their fixtures, but they can't establish speed. The evidence layers complement one another.
Choose by the decision you must own
Start with a framework or vendor library if it meets the need. For a custom kernel, choose by the decision you need to express:
- Use a framework or vendor library when an existing operation already meets correctness and performance needs.
- Use Triton when custom block structure, fusion, or masking is central and compiler-managed thread mapping is acceptable.
- Use Pallas when the kernel must compose naturally with JAX or span its GPU and TPU ecosystem.
- Use NKI when NeuronCore memory placement or engines are the target, not an afterthought.
- Use CUDA Tile when block-level tile semantics fit and NVIDIA's compiler should own intra-block threads.
- Use CUTLASS/CuTe when tensor layouts, asynchronous copies, and matrix hardware atoms need explicit control.
- Use CUDA C++ when per-thread behavior, synchronization, special instructions, or unsupported irregularity requires it.
These are alternatives, not a ranked ladder. A prototype may begin in Triton, expose a compiler limitation, and move one hot kernel to CuTe or CUDA C++. Another kernel may move upward after a compiler learns the missing transformation.
If you have a compatible NVIDIA environment, practice the full artifact path before moving on. Build the vector-add executable with an sm_90 cubin and compute_90 PTX, save its manifest and cuobjdump image inventory, then run forced-PTX and cubin-only checks in fresh processes. Capture the resource report, SASS, correctness output, and separate cold and warm timings in one review artifact. Run the Triton version on the same five nonempty shapes. Both implementations should match the same reference exactly, and the strided-view test must reject before launch. For a memory-safety check, run the CUDA executable under compute-sanitizer --tool memcheck ./build/vector_add. Capture failures as well as passes. On CPU-only machines, complete the indexing and cache-identity exercises without claiming a GPU build or benchmark.