Your evaluation log says deepseek-v4-pro. The architecture report says 1.6 trillion parameters; Hugging Face displays 1.7 trillion. Meanwhile, an older run used the same API name but a different release. None of those facts necessarily contradicts the others. They describe different parts of the system you tested.
DeepSeek V4 is a useful case study in reading a model release without turning its strongest number into a deployment recommendation. The checkpoints, long-context architecture, and hosted prices are concrete. Whether they improve your coding assistant depends on what survives a comparison with the same tasks, tools, and budgets.
Scope and date: Flash 0731 and Pro 0813 text builds, checked against official sources on September 2, 2026. The experimental deepseek-v4-flash-vision-exp API released on August 21 is outside this comparison.[1]
One API name, several releases
V4 Preview arrived on April 24. Flash received new post-training on July 31, while Pro reached general availability on August 13. The hosted names stayed the same through those upgrades.[2][1][3]
| Release | What changed | Artifact to distinguish |
|---|---|---|
| April 24: V4 Preview | Pro and Flash introduced | Original preview checkpoints and report |
| July 31: Flash 0731 | Flash post-training updated; Pro API unchanged at that point | DeepSeek-V4-Flash-0731 |
| August 13: Pro 0813 | Pro GA rolled out to app, web, and API | DeepSeek-V4-Pro-0813 |
The current pricing page maps deepseek-v4-flash to Flash 0731 and deepseek-v4-pro to Pro 0813.[4] Those model IDs select a product, not an immutable build. Record the provider's documented mapping and the evaluation date; if a response exposes version metadata, save that too. Don't assume a run from June is reproducible just because its model string matches today's.
For an open checkpoint, record the repository revision, file hashes, tokenizer/encoding implementation, and serving configuration. You can freeze those artifacts, unlike a mutable hosted alias, but they still don't reproduce the hosted service's entire runtime.
Why the parameter counts differ
The report describes two mixture-of-experts models: Flash has 284B total parameters with 13B active per token; Pro has 1.6T total with 49B active.[5] An MoE activates only some expert networks for each token. Active parameters help explain compute, while the full weight pool still requires storage and a residency or offloading plan. Neither count alone predicts latency. Mixture of Experts Architecture explains the routing and communication costs.
The newer checkpoint packages also include DSpark, a speculative-decoding module. It proposes tokens for the target model to verify. DeepSeek's DSpark card describes an attached draft path, and the dated Flash and Pro cards identify that module in their packages.[6][7][8]
| Model | Published target architecture | Hub package listing, September 2 |
|---|---|---|
| Flash 0731 | 284B total / 13B active | 304B parameters; package includes DSpark |
| Pro 0813 | 1.6T total / 49B active | 1.7T parameters; package includes DSpark |
The July changelog explicitly says Flash 0731 retains the preview architecture and size. The Pro 0813 card likewise says it retains the preview Pro structure with DSpark attached.[1][8] The Hub badges count a different artifact than the target-architecture figures. Don't subtract rounded badges to infer an exact draft-module size, or interpret the larger badge as evidence that the target became wider.
This distinction also affects measurement. Speculation adds draft work and verification overhead; its speedup depends on acceptance and the serving workload. Speculative Decoding shows why a larger packaged checkpoint can still generate faster, without guaranteeing that it will.
What makes the long-context design different
The preview models support a reported one-million-token context window. Their attention layers combine two ways to reduce the number of key-value cache entries used for long-range context:
- Compressed Sparse Attention (CSA): compress the sequence, then select a subset of compressed entries for each query.
- Heavily Compressed Attention (HCA): compress more aggressively, then attend densely over that smaller representation.
The report uses a fourfold sequence compression rate for CSA and 128-fold for HCA, with an additional sliding-window path for recent local detail. These are interleaved layer types, not a pipeline that first runs all CSA outputs through HCA. The report also introduces constrained residual connections (mHC) and uses Muon for most parameter updates, with AdamW for selected components.[5]
DeepSeek's estimated costs at 1M context are plotted below. FLOPs are single-token inference work expressed in equivalent FP8 operations; KV cache is accumulated cache size. These are different quantities, not two measurements of request latency.[5]
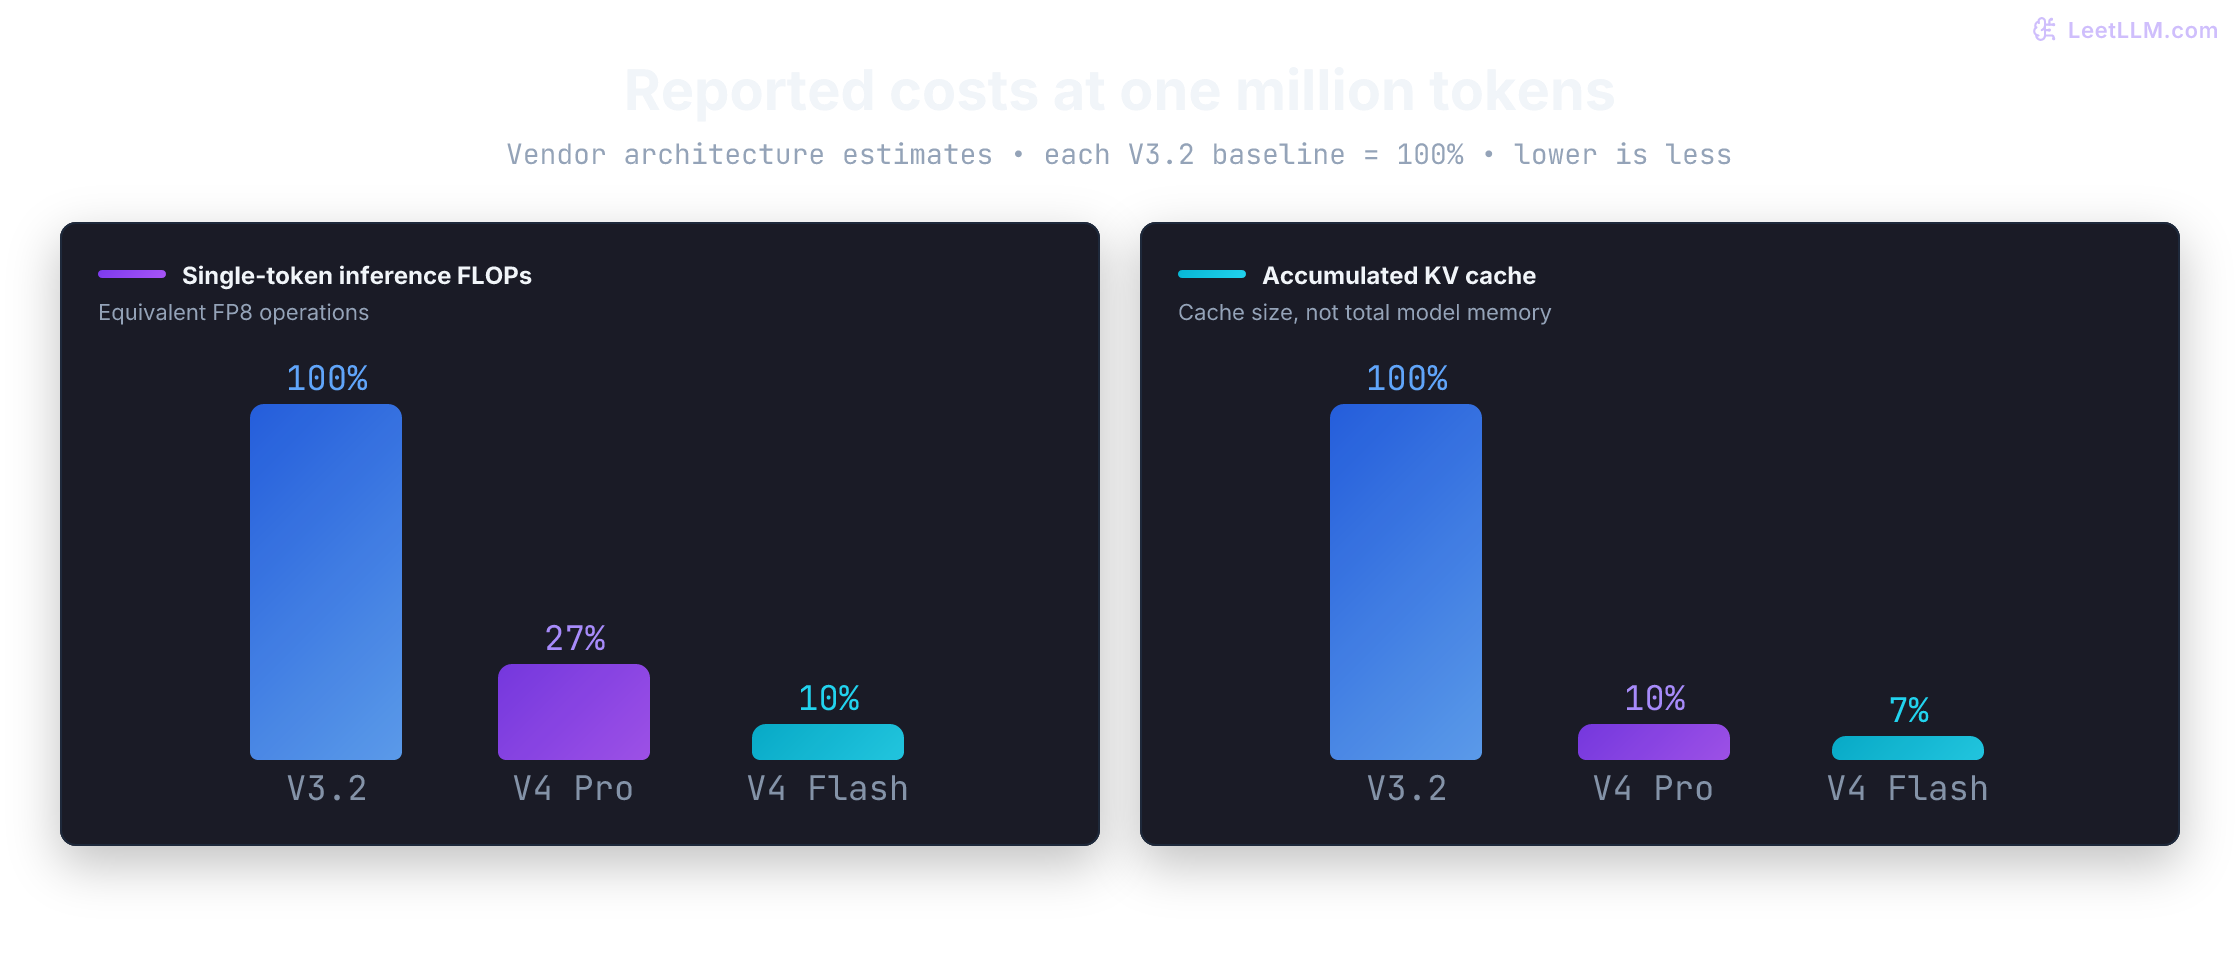
The baseline is DeepSeek-V3.2, which already uses sparse attention, not a hypothetical dense model. The reductions reflect compression, sparsity, precision choices, and different model configurations together. They don't isolate the benefit of a single component.
A small cache also doesn't prove that a model will retrieve a buried identifier or reconcile two distant policy clauses. Test those cases at your actual input lengths. Measure prefill, decode, and memory separately; a single-token FLOPs ratio isn't an end-to-end speedup. KV Cache and PagedAttention separates cache capacity from allocation and scheduling.
Read benchmark rows with their conditions attached
The Pro 0813 card reports these selected results. DeepSeek published the measurements; we haven't independently reproduced them.[8]
| Benchmark | Pro preview | Flash 0731 | Pro 0813 |
|---|---|---|---|
| Terminal-Bench 2.1 | 72.1 | 82.7 | 87.9 |
| NL2Repo | 38.5 | 54.2 | 61.5 |
| DeepSWE | 12.8 | 54.4 | 62.7 |
| Toolathlon-Verified | 55.9 | 70.3 | 74.1 |
The public code-agent evaluation notes specify DeepSeek Harness minimal mode, max reasoning effort, temperature=1.0, and top_p=0.95. The cards also include two internal DSBench datasets, which outside readers can't fully inspect.[7][8]
One subtle reproducibility problem: DeepSeek's hosted thinking-mode API ignores caller-supplied temperature and top_p, even though those settings appear in the benchmark notes. Copying the numbers into an API call doesn't recreate the published experiment.[9] Record what the endpoint actually honors, not just the JSON your client sends.
The table supports a narrower observation than "Pro wins": under the vendor's reported setup, Pro 0813 scores above Flash 0731 on these four rows. It doesn't establish cost per successful task, a latency advantage, or a general ranking against other providers. Those need measurements with comparable tasks, harnesses, retry limits, and acceptance criteria.
Turn the rate card into a workload bill
As of September 2, both text IDs advertise 1M context, a maximum output of 384K tokens, thinking and non-thinking modes, tool calls, JSON output, Responses API support, and an Anthropic-compatible interface. Context and output limits still constrain each individual request.[4]
Peak/off-peak pricing took effect at 16:00 UTC on August 16.[3] Peak hours are 01:00 to 04:00 and 06:00 to 10:00 UTC, Monday through Friday; every other hour is off-peak. The rates below are USD per million tokens, checked September 2.[4]
| Model | Billing period | Cache-hit input | Cache-miss input | Output |
|---|---|---|---|---|
| Flash | Off-peak | $0.007 | $0.22 | $0.66 |
| Flash | Peak | $0.014 | $0.44 | $1.32 |
| Pro | Off-peak | $0.022 | $0.66 | $1.98 |
| Pro | Peak | $0.044 | $1.32 | $3.96 |
For a batch of requests totaling 2M input tokens and 0.5M output tokens, cold-cache off-peak charges are $0.77 for Flash and $2.31 for Pro. This isn't one oversized request. It assumes every token uses the indicated billing period and excludes tools, retries not already counted, and human review.
The calculator uses token counts rather than a guessed request-level cache-hit rate. A 70% input-token hit share means 1.4M cached input tokens and 0.6M uncached ones, not that 70% of requests were cached. Split a mixed peak/off-peak workload into separate usage buckets before summing.
1from dataclasses import dataclass
2from decimal import Decimal
3
4@dataclass(frozen=True)
5class HostedModelRate:
6    name: str
7    cache_hit_per_m: Decimal
8    cache_miss_per_m: Decimal
9    output_per_m: Decimal
10
11    def workload_cost(
12        self,
13        cache_hit_tokens: int,
14        cache_miss_tokens: int,
15        output_tokens: int,
16    ) -> Decimal:
17        counts = (cache_hit_tokens, cache_miss_tokens, output_tokens)
18        if any(type(count) is not int or count < 0 for count in counts):
19            raise ValueError("token counts must be nonnegative integers")
20        return (
21            cache_hit_tokens * self.cache_hit_per_m
22            + cache_miss_tokens * self.cache_miss_per_m
23            + output_tokens * self.output_per_m
24        ) / Decimal(1_000_000)
25
26# Strings preserve the published decimal rates exactly.
27rates = [
28    HostedModelRate("flash-offpeak", Decimal("0.007"), Decimal("0.22"), Decimal("0.66")),
29    HostedModelRate("flash-peak", Decimal("0.014"), Decimal("0.44"), Decimal("1.32")),
30    HostedModelRate("pro-offpeak", Decimal("0.022"), Decimal("0.66"), Decimal("1.98")),
31    HostedModelRate("pro-peak", Decimal("0.044"), Decimal("1.32"), Decimal("3.96")),
32]
33for rate in rates:
34    cold = rate.workload_cost(0, 2_000_000, 500_000)
35    warm = rate.workload_cost(1_400_000, 600_000, 500_000)
36 print(f"{rate.name}: cold=${cold:.4f}, warm(70% input hit)=${warm:.4f}")1flash-offpeak: cold=$0.7700, warm(70% input hit)=$0.4718
2flash-peak: cold=$1.5400, warm(70% input hit)=$0.9436
3pro-offpeak: cold=$2.3100, warm(70% input hit)=$1.4168
4pro-peak: cold=$4.6200, warm(70% input hit)=$2.8336These are exact calculations for the stated token buckets, not a reproduction of invoice rounding or a prediction of cache behavior. Use provider-reported usage after each run. A lower token bill can still accompany more failed tasks or more review work.
Compatibility doesn't remove operational differences
The current docs enable thinking by default at high effort. low maps to low; medium, high, and xhigh map to high; max maps to max.[9] Include the effective effort in your experiment record and latency budget.
Account-level concurrency limits are 2,500 for Flash and 500 for Pro, with expansion available by request. A request counts until its response completes, and excess concurrency returns HTTP 429. Multiple API keys under one account don't create independent quotas.[10] Those limits aren't throughput guarantees: a long reasoning request occupies a slot much longer than a short classification.
The April release note scheduled deepseek-chat and deepseek-reasoner for retirement after July 24 at 15:59 UTC.[2] Use the documented V4 IDs; we haven't made authenticated calls to test the retired aliases or measured live availability here.
Self-hosting changes different responsibilities. Both dated checkpoint cards specify MIT licensing and provide vLLM/SGLang recipes that load the target and DSpark from the same checkpoint.[7][8] They also provide custom message encoding rather than a Jinja chat template. A serving migration must check that encoding and output parsing, not merely whether the weights load.
Record the checkpoint revision, runtime version, quantization, DSpark setting, GPU topology, and tested context length. Open weights don't establish hosted equivalence, privacy, or sufficient cluster capacity. Decide which data a provider may receive before sending evaluation traffic; self-hosting still needs its own access, logging, and retention controls.
A pilot that can change your decision
Use tasks whose success you can inspect. For a repository assistant, a small starting pack might contain these cases:
| Task | Acceptance evidence | Failure to watch |
|---|---|---|
| Locate a configuration owner | Correct file and symbol at a frozen commit | Plausible but nonexistent path |
| Fix a parser edge case | Held-out regression and existing tests pass | Patch special-cases the visible test |
| Explain conflicting policies | Both source IDs and the applicable version | Newer rule omitted from a long context |
| Handle a failed tool call | Bounded recovery without duplicate writes | Retry loop or repeated side effect |
This is an illustrative starting pack, not a representative benchmark by itself. Expand it from real failures. Compare Flash, Pro, and the incumbent with equivalent permissions and acceptance tests, recording every attempt's tokens, tool costs, latency, and outcome. Give each model its supported prompt/encoding contract while keeping the task and resource budget comparable.
If Flash succeeds on source lookup but fails the parser case, you've learned something more useful than "cheap models handle easy tasks." You have a candidate task-specific routing rule and a failure set for the next experiment. Confirm it on held-out cases before a bounded canary, and keep a rollback route that respects the same data policy.
LLM Cost Engineering develops the usage ledger. Model Gateways, Routing, and Fallbacks covers enforcing those routing contracts.
DeepSeek's releases give teams specific alternatives to measure. They don't establish that US labs are being displaced, or that one provider is the right destination for every high-risk task. A deployment decision needs the dated artifact, effective runtime settings, and accepted work per dollar. The launch narrative can't supply those last measurements.