You can put $148,100 and $500,000-$850,000 on the same screen and still learn almost nothing about an AI-engineering offer. The first is the US annual mean (average) wage for software developers in the Bureau of Labor Statistics (BLS) May 2025 table. The second is the annual-salary range on one Anthropic reinforcement-learning research posting.[1][2]
Both numbers are real. They aren't two ends of one "AI engineer" salary band.
Pay figures below are US dollars for US roles, before tax. Before comparing them, identify the work, the level, the location, the pay field, and the date attached to each number. If job families still feel blurry, start with the AI engineer role guide.
Start with the measuring stick
Picture a recruiter saying, "The range is $500K." What should you write down: annual salary, base salary, target cash, or total compensation? Base salary is the fixed pay rate for your work. Target cash adds the bonus the employer aims to pay, which may differ from the actual payout. Total compensation (TC) typically adds an equity value to cash; check what each source includes and which year it describes.
Salary sources answer different questions. Mixing them can make an offer look stronger or weaker than the source supports.
| Source | What it measures | What it misses | Best use |
|---|---|---|---|
| BLS Occupational Employment and Wage Statistics[1] | Employer-surveyed wages for a broad occupation and geography | No AI engineer category; the wage definition excludes stock, nonproduction bonuses, and benefits[3] | Broad US occupation and location context |
| Employer posting | One role's disclosed salary or pay range, location, and sometimes bonus or equity labels | Actual offer, internal level, grant size, and negotiable components may be absent | Current employer-specific anchor |
| Levels.fyi | Crowdsourced yearly base, stock, bonus, and normalized company levels[4] | User selection, changing samples, and inexact cross-company level mapping | Level-specific total-compensation cross-check |
| Department of Labor Office of Foreign Labor Certification (OFLC) disclosure data[5] | Employer-submitted wage fields from selected immigration applications | Equity, bonus, full workforce, and a clean market sample | A dated wage-record cross-check, never a total-compensation estimate |
Data boundary: Don't average rows from these sources. First match source definition, job family, level, location, and date. Only then compare values.
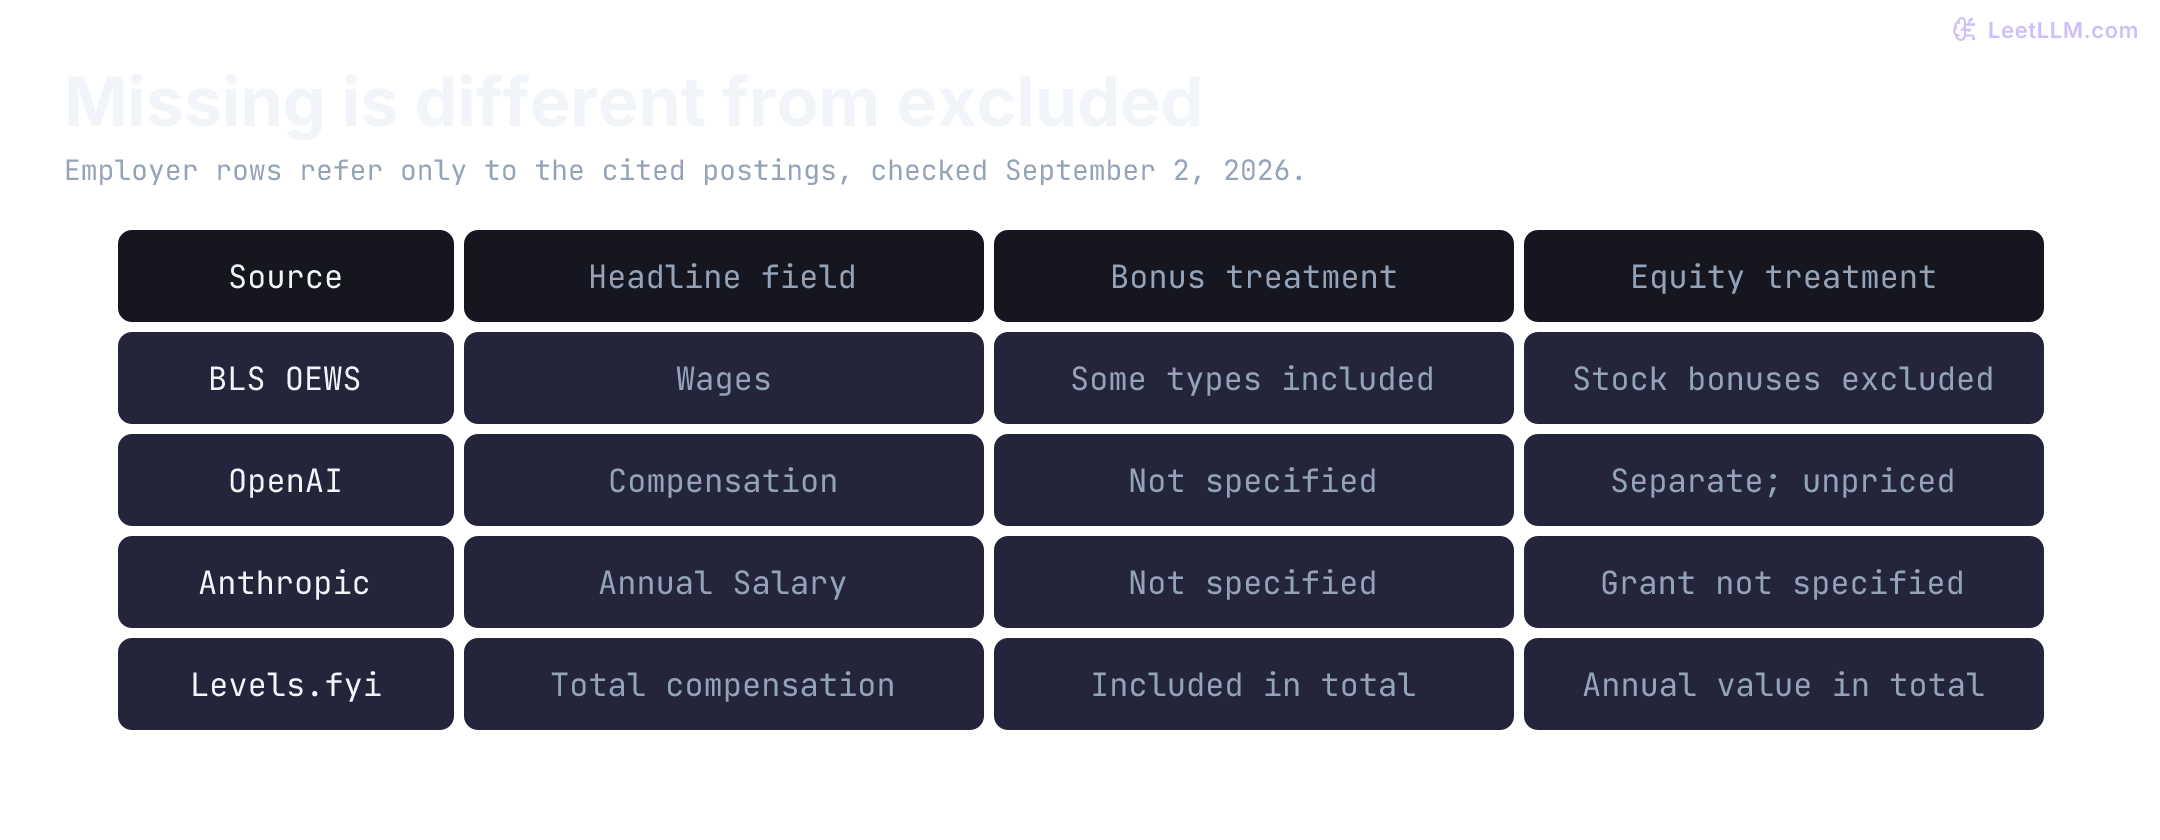
Now read the headline as a field, not as a verdict. BLS's published wage can include base rates and some incentive pay, but it excludes stock bonuses, nonproduction bonuses, and employer-paid benefits.[3]
A missing component isn't a zero. An employer might mention equity without pricing the grant, or publish salary without explaining bonuses. Levels.fyi combines base, stock, and bonus into a yearly total. Its component fields help you separate them again.[4]
Use occupation data for context
When you need a national baseline, BLS is useful precisely because its table is broad. The May 2025 release has no "AI engineer" row, so use nearby occupations only as context.
These are annual means, not medians, base-salary bands, or total compensation. Software developers also cover a much larger workforce than computer and information research scientists, so the latter's mean isn't a stand-in for "AI research pay." SOC means Standard Occupational Classification, the system used to identify the occupations.[1][3]
| BLS occupation | SOC code | US employment | US annual mean wage | Median hourly wage | Why it isn't an AI engineer range |
|---|---|---|---|---|---|
| Software developers | 15-1252 | 1,687,890 | $148,100 | $65.38 | Covers software work across industries and specialties |
| Data scientists | 15-2051 | 262,440 | $126,800 | $57.80 | Covers data-science work beyond model-backed product engineering |
| Computer and information research scientists | 15-1221 | 37,200 | $153,930 | $67.45 | Covers a much smaller research occupation, not every research engineer |
Read the two wage columns separately. A median is the middle worker's wage, while a mean is the average across workers. The columns also use different units: one covers a year and the other an hour. Neither describes a starting offer or an AI-specific pay band.
BLS also publishes state and metro estimates, which are better context when an offer is tied to one location.[3]
OEWS wages are closer to cash-wage context than to total compensation. They include base rates and some incentive pay, but exclude stock, nonproduction bonuses, and employer-paid benefits.[3] That boundary is why the next source, an employer posting, needs to be read field by field.
Read a posting field by field
These three employer pages were checked on September 2, 2026. They were selected to show different disclosed fields, not to estimate typical pay. All three are research-oriented roles at two frontier labs, so they say little about the wider applied-AI market. Recheck the pages before using them in an offer conversation.
| Posting | Exact published field | Role and level evidence | Location evidence |
|---|---|---|---|
| OpenAI Research Engineer[6] | Compensation: $250K-$445K + Offers Equity | Cited page publishes no internal level | San Francisco |
| Anthropic Research Engineer, ML (Reinforcement Learning)[2] | Annual Salary: $500K-$850K | Posting says required experience correlates with internal level; it doesn't publish that level | San Francisco or New York City; at least 25% office expectation |
| Anthropic ML/Research Engineer, Safeguards[7] | Annual Salary: $350K-$500K | Posting asks for 4+ years but doesn't publish an internal level | San Francisco or New York City; at least 25% office expectation |
OpenAI explicitly says its range comes with equity. Anthropic's two pages label their figures Annual Salary and don't state an equity grant next to those dollars.
Don't silently rename those Anthropic fields "base salary," and don't add hypothetical equity to their published numbers.
Anthropic's safeguards role asks for 4+ years, but years alone don't reveal staff or senior scope. OpenAI publishes no level on the cited page. None of these ranges support a universal junior, mid-level, senior, or staff AI-engineer band.
Field-name check: If a recruiter says "500 to 850," ask whether that string is annual salary, base salary, or total compensation. The cited Anthropic RL posting uses Annual Salary for those dollars.
When using Levels.fyi, match the level and location, then inspect base, stock per year, bonus, submission date, and sample details. A median across several levels answers a different question from a median for your level. Read the live breakdown instead of carrying a company-wide snapshot into an offer call.[4]
A posting gives you a field and a date. It still doesn't tell you whether you've chosen the right peer group. That is a work question.
Match the work before the title
Two jobs can use "AI engineer" while buying different work. Build your peer set from the deliverable and ownership boundary, not from the title.
| Role family | Work to match | Strong comparator |
|---|---|---|
| Applied AI engineer | Retrieval, tool use, product workflows, evals, and user-facing reliability | Product software roles with similar end-to-end scope |
| Machine learning engineer | Training, ranking, retrieval, feature pipelines, and deployed models | ML roles on comparable product and infrastructure ladders |
| ML systems engineer | GPU efficiency, distributed training, serving, compilers, or runtimes | Infrastructure roles with the same performance and scale ownership |
| Research engineer | Experiments, model methods, training loops, and evaluation design | Lab or research-platform roles with comparable research and systems depth |
| Agent systems engineer | Tool loops, sandboxes, coding agents, and long-horizon evaluation | Applied or systems roles with the same authority and reliability boundary |
Role family narrows the peer set; it doesn't guarantee a premium. Scope still decides the comparison. Owning one retrieval feature isn't the same level as setting evaluation and serving architecture across teams.
If the role specifically owns serving latency or throughput, Inference Mechanics explains the latency and memory constraints behind that work. Technical relevance makes a role a better comparator; it doesn't establish a salary premium by itself.
Match the employment arrangement too. A San Francisco office role and an international contractor quote differ in more than currency. Ask which location sets the band, whether a move changes it, and who pays for benefits, leave, equipment, and required travel. For a concrete budget check, an extra $1,500 a month in housing consumes $18,000 a year after tax. Don't subtract that directly from a pre-tax salary difference and call the remainder disposable income.
With the peer set fixed, you can finally compare packages. The next step is to put every component on one clock.
Put every offer on one clock
Recruiters may quote annual base, target bonus, a four-year grant, annualized equity, or first-year cash. Put each offer on the same four-year window, then write down when each component pays or vests. That keeps a large paper grant from hiding a weak first year or a long wait for liquidity.
Vesting is the schedule on which you earn rights to an equity award. A cliff delays the first vest until a specified date. Liquidity means you can actually sell the shares, which may happen much later than vesting. A restricted stock unit (RSU) is a promise to deliver shares or their value after specified conditions are met; an option is a right to buy shares at a fixed strike price. A refresher is a later equity award with its own vesting schedule, not automatically cash paid that year.
Worked example with explicit assumptions
These two offers are invented to teach the arithmetic. They aren't market benchmarks.
- Offer A, public company: $175K base, an initial $440K RSU grant vesting equally over four years, and a 15% target bonus. Also model an unpromised $40K refresher granted at the start of each of years 3 and 4, each vesting quarterly over four years with no cliff.
- Offer B, private company: $190K base, 10% target bonus, and an initial option grant quoted as $380K over four years ($95K annualized), vesting equally each year. No refresher or announced opportunity to sell shares back to the company or another buyer.
Assume four complete years of employment, unchanged base salaries, full target bonus, constant public share price, and no taxes or transaction fees. For now, carry the private options at the employer's stated value without treating that value as sale proceeds. Count only equity vesting within the four-year window, not the face value of every grant awarded during it.
| Four-year component | Offer A | Offer B |
|---|---|---|
| Base | 4 × $175K = $700K | 4 × $190K = $760K |
| Target bonus | 4 × $26.25K = $105K | 4 × $19K = $76K |
| Initial equity at stated value | 4 × $110K = $440K in public RSUs | 4 × $95K = $380K in private options |
| Illustrative refreshers vesting within the window | $10K in year 3 + $20K in year 4 = $30K | $0 |
| Stated pre-tax total | $1.275M | $1.216M |
The first refresher contributes $10K in year 3 and another $10K in year 4. Only $10K of the second grant vests in year 4. Another $50K vests after this comparison ends. Adding both full $40K grants would overstate Offer A's four-year value by $50K.
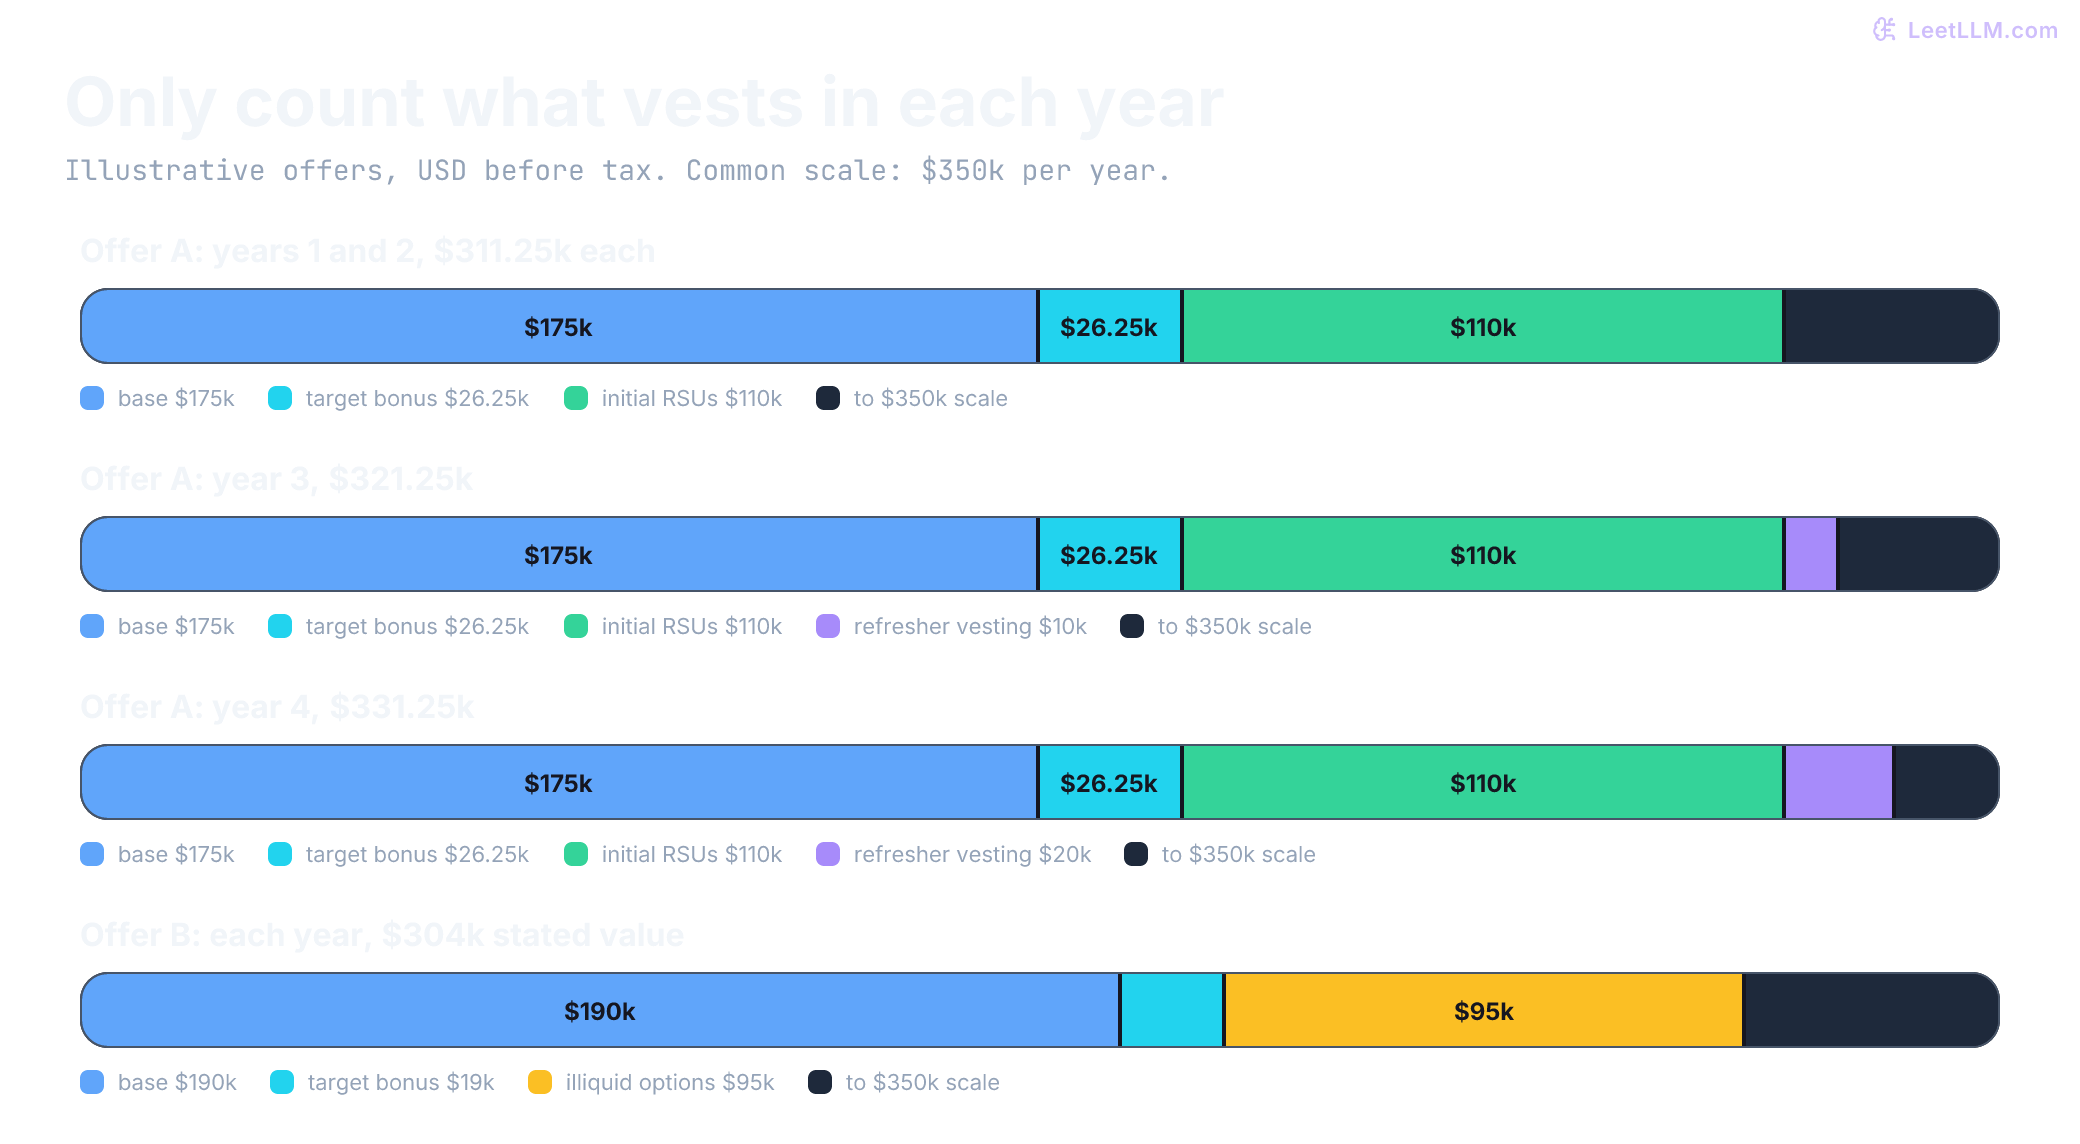
Comparison boundary: "Stated pre-tax total" isn't take-home pay or expected wealth. Re-run the table when stock price, bonus payout, vesting, start date, exercise cost, or refresher assumption changes.
The totals make the offers comparable on paper, but they still hide equity risk. Classify each slice before you count it.
Let uncertainty show up in the math
Salary belongs on the payment schedule while employment continues; four years of employment aren't guaranteed by a quoted annual rate. Target bonus needs payout scenarios. Public stock needs price and sale-restriction scenarios. Private options need exercise cost, dilution, tax, and liquidity scenarios. Dilution reduces your ownership percentage when the company issues additional shares. Start by separating the components in these two offers:
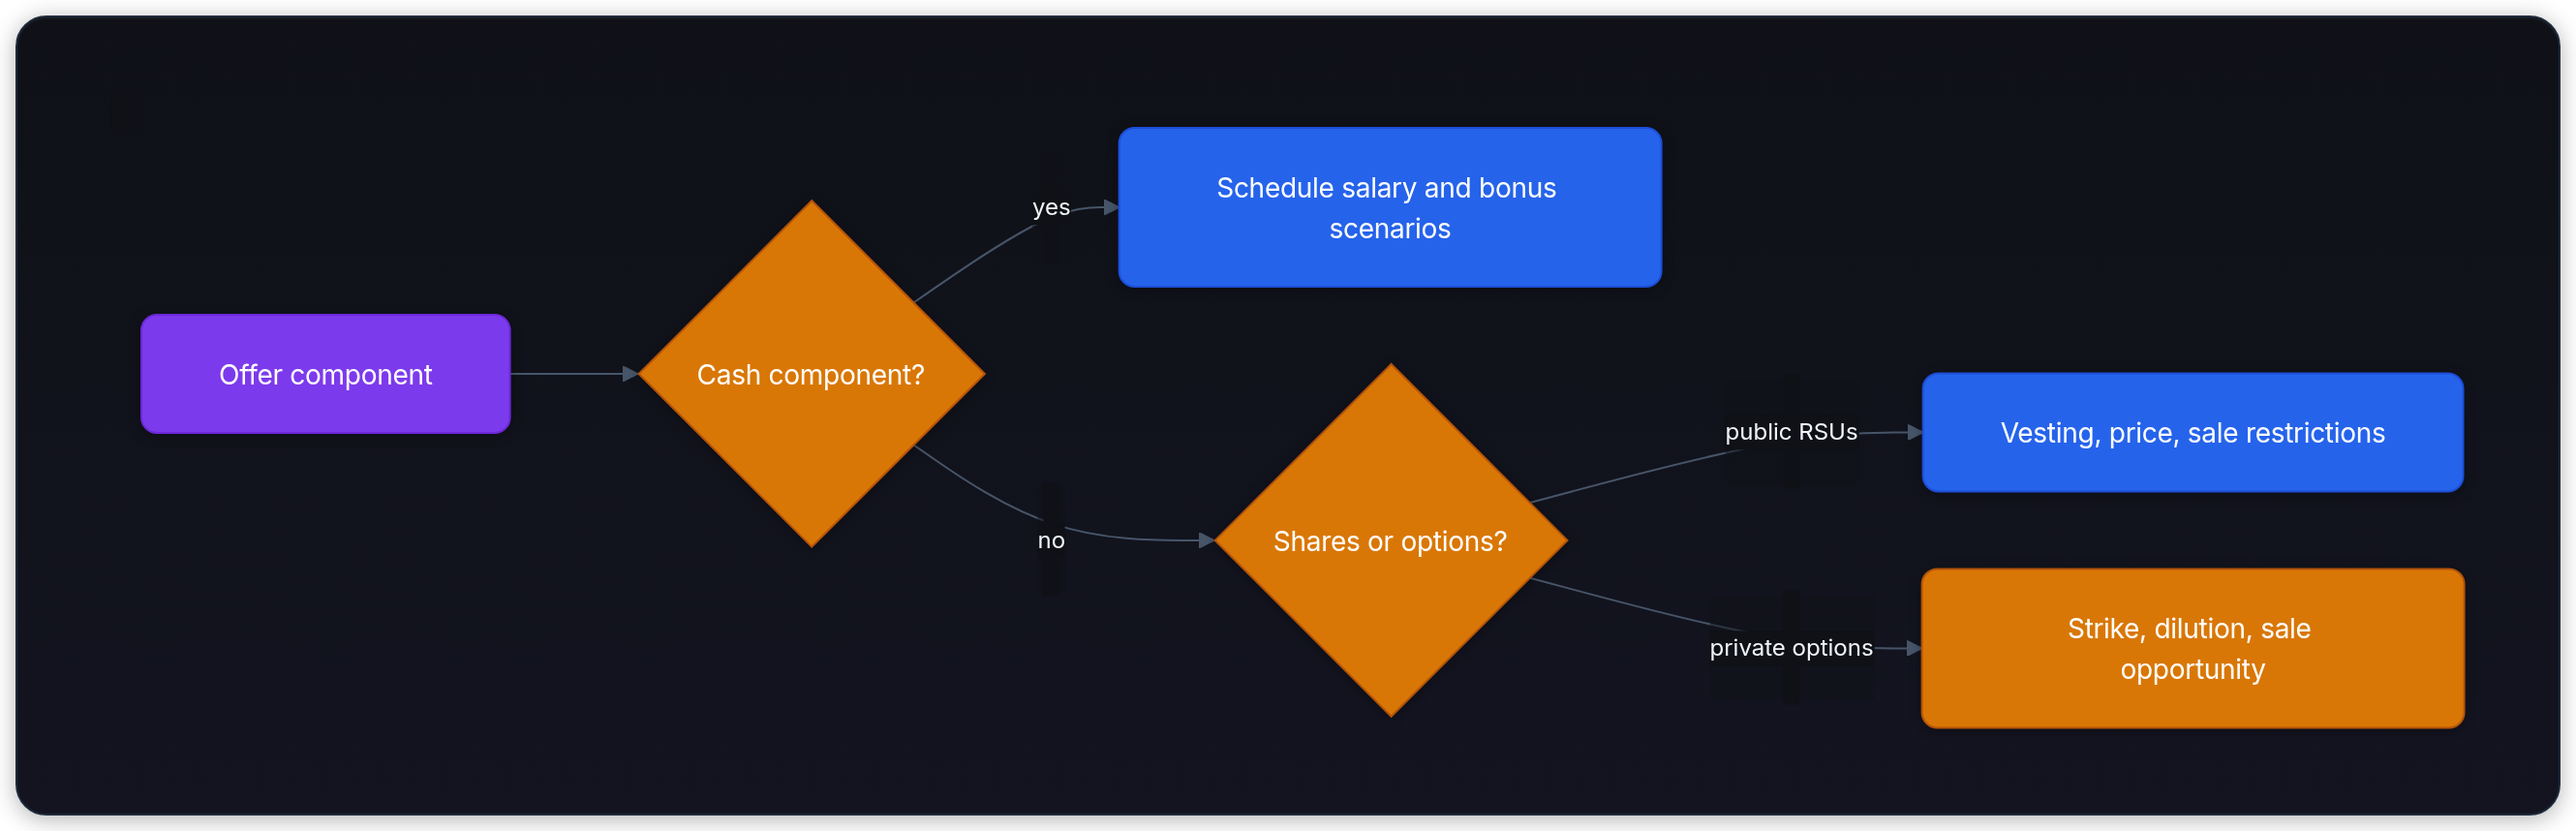
If all equity becomes worthless but target bonuses pay in full, Offer A leaves $805K and Offer B leaves $836K over four years. If bonuses also pay zero, those figures fall to the salary-only $700K and $760K. This separates a higher cash rate from a higher headline package.
For Offer B, counting options at 0%, 50%, and 100% of stated value produces $836K, $1.026M, and $1.216M. Those are sensitivity checks, not forecasts or estimated probabilities. An option valuation needs an additional calculation. Suppose the quoted $380K represents 20,000 options with a $4 strike and a hypothetical $23 sale price for common shares. Ignoring taxes and fees, proceeds after exercise cost would be 20,000 × ($23 − $4) = $380K. A $13.50 sale price gives $190K; a price at or below $4 gives no positive exercise payoff. If there's no permitted sale, none of those scenarios produces spendable proceeds yet.
The purchase alone costs 20,000 × $4 = $80K. Exercising before a sale can therefore put your own cash at risk, even if a compensation spreadsheet assigns the options a positive value. A headline company valuation or preferred-investor share price isn't necessarily the amount common shareholders receive. Ask how the employer calculated its quoted option value before comparing it with RSUs.
Public equity is uncertain too. With no refreshers, Offer A's total falls from $1.275M to $1.245M. If all its assumed RSU vest values, including refreshers, are 50% lower, it totals $1.040M: $805K target cash plus $235K equity. Use comparable downside assumptions for both offers, not a stock-price guarantee for one and a worst case for the other.
Using the zero-equity case, predict Offer B's four-year cash total if bonuses also pay zero. Then check your reasoning:
Why only salary remains
Four years of 190,000 dollars in annual salary produce 760,000 dollars, assuming employment continues. The difference from 836,000 dollars is the 76,000-dollar target bonus you removed. Exercising the illustrative options would reduce cash by another 80,000 dollars before any taxes; a paper valuation doesn't fund that purchase.
Before treating a private grant as cash, ask for its type, number of shares or options, strike price, fully diluted share count or ownership percentage, vesting and cliff, post-employment exercise window, tender policy, and transfer restrictions. A company valuation headline can't answer those questions.
US tax treatment also varies by instrument and event. The IRS says incentive stock options may trigger alternative minimum tax at exercise, while most nonstatutory options without a readily determinable fair market value create income at exercise equal to share value minus price paid.[8] State and non-US rules differ. Get personalized tax advice before exercising a material grant.
Once you can explain the package without treating every component as cash, prepare evidence for the level and scope you're discussing.
Turn ownership into evidence
Compensation data sets the peer group. Evidence supports scope. A tool list can't do either job.
Start with five facts: bottleneck, constraint, decision, measured result, and business effect.
Here's an illustrative version. An internal FAQ assistant took 4.2 seconds at p95 because each request sent a full document dump to the highest-cost model. Routing, caching, and shorter context reduced p95 to 1.1 seconds and token cost per conversation by 62%.
Here, p95 is the latency at or below which 95% of requests finish. The comparison needs the same task mix, load, and measurement boundary, plus an answer-quality check. Otherwise faster, cheaper answers might simply be less useful. A before-and-after result for three changes also doesn't prove which change caused how much of the improvement.
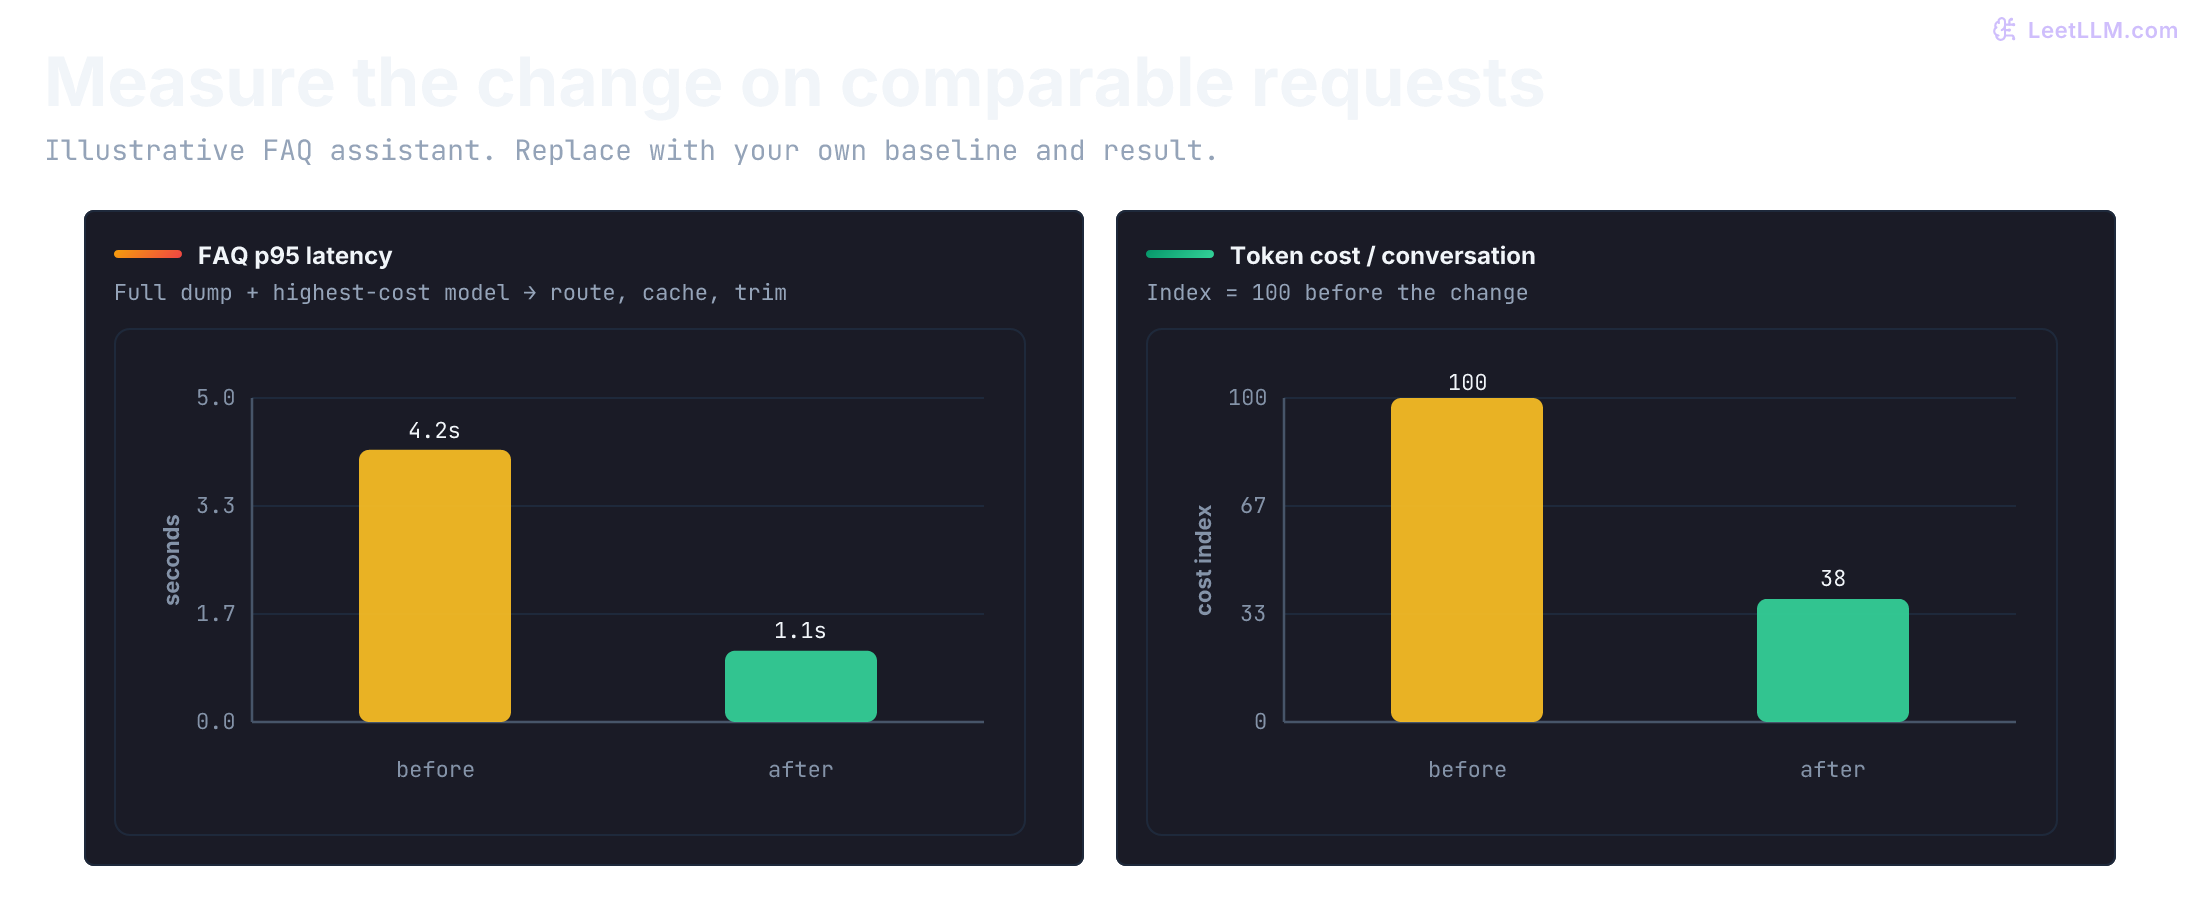
Don't borrow those figures. Bring an eval report, trace, benchmark, cost ledger, incident reduction, or adoption result you can inspect. Separate work you owned from the team outcome. If you need to produce this kind of evidence, Model Gateways, Routing, and Fallbacks covers the router, and LLM Cost Engineering shows how to keep the token ledger honest. The portfolio project guide shows how to package that evidence; use the technical presentation lesson to rehearse trade-offs without inflating credit.
Build one offer-call worksheet
Before the call, put these items on one page:
- exact role family, expected scope, likely level, and location policy
- three closest employer postings with field name and date captured
- one broad occupation or metro benchmark for context
- four-year schedule for base, sign-on, target bonus, equity, and refreshers
- downside, stated-value, and upside equity scenarios
- vesting, cliff, exercise, clawback, and liquidity terms
- two measured ownership stories tied to the role's current bottlenecks
- questions whose answers would change your decision
Ask the recruiter to name the compensation field alongside the number: "Is that annual salary, base salary, target cash, or total compensation?" That question prevents most category errors.
Ask whether the equity quote is grant-date value, current annualized value, or a number of shares. Ask which components are guaranteed, targeted, discretionary, or subject to approval.
Salary-negotiation laws and tax rules vary by jurisdiction. Don't turn a general script into legal advice. Keep the arithmetic pre-tax, record the assumptions, and bring local counsel or a tax professional into any material equity or relocation decision.
The BLS figures use the May 2025 OEWS release. The OpenAI and Anthropic postings were checked on September 2, 2026. Recheck every volatile source before a real offer call. Gaps between the target role and your evidence can shape the next project through the AI engineer learning route.